Post by Admin on Nov 11, 2019 22:07:13 GMT
Inference of mitochondrial DNA haplogroups and contamination
Since all libraries were treated with partial-UDG, a deamination signature of > 0.04 remain the last 2 bp
on each end of a read (also a criteria used in sample screening). In the main pipeline used for genotype
calling, two base pairs on each end are trimmed. However, for determining mitochondrial contamination
and the endogenous mitochondrial genome, these untrimmed reads were used to extract only reads with a
damage signature. The endogenous consensus mitochondrial genome was called simultaneously while
estimating mitochondrial contamination using schmutzi (47). Sequencing reads were aligned to the
revised Cambridge Reference Sequence (rCRS) mitochondrial genome (NC_012920.1).
First deamination and a contamination estimate based on it were estimated using the contDeam tool in
schmutzi with the following parameters: length of expected deamination set to 2 (--lengthDeam 2) and
library type set to double strand (--library double). Second, the main schmutzi program was used to 1)
estimate contamination based on a haplogroup frequency database in conjunction with the deamination
estimates from contdeam and 2) to assemble the endogenous consensus MT genome informed by
contamination. Base quality filtering of 30 (--qual 30) and the --uselength parameter were both used. We
found that using a global haplogroup frequency database did not provide any additional information than
using the eurasian database, both provided by schmutzi. We also ran schmutzi with both a set deamination
rate of 0.05 (based on results from Mapdamage during screening of samples) and with the rate estimated
by contDeam.
The output of this pipeline is a contamination estimate based on deamination rates, a contamination
estimate based on haplogroup frequencies, a contaminant MT genome, and an endogenous MT genome.
Haplogroups for the consensus endogenous genomes were called using the command line version of
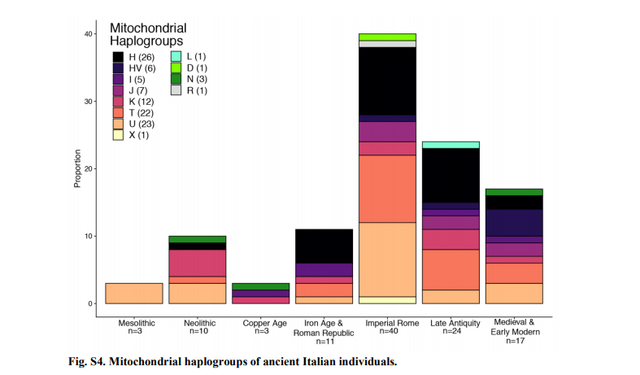
Haplogrep (v2.1.20) (59) (Table S2; Fig. S4). Contamination estimates are reported along with X
chromosome contamination estimates, where possible (for males).
Mesolithic (10,000-6,000 BCE; n=3)
All three mesolithic individuals have haplotypes from the U group, two from the U5 subgroup and one
from U8. In a study of the neolithic expansion in Europe, 83% of European hunter-gatherers (n = 23)
8 were shown to have U haplotypes, compared to 12% of farmers (n = 105)(60). More specifically,
haplogroup U5 (along with U2) represent the majority of mitochondrial variation in Western HunterGatherers (WHG), Eastern Hunter-Gatherers (EHG), and Scandinavian hunter-gatherers (SHG)(14).Thus
the Italian Mesolithic individuals reported here have typical mitochondrial haplogroups compared to
contemporaneous Europeans.
Neolithic and Copper Age (6,000-2,300 BCE; n=13)
Three Neolithic individuals reported here have mitochondrial haplotypes in the U group, three in the K
group, and one of each in the H, N, and T groups. The three Copper Age individuals have N, K, and I
haplogroups. The K haplogroup is thought to be a marker of the neolithic expansion as it is nearly absent
in hunter-gatherers and at the highest levels in the Near East (61). Isern shows that the frequency of K
decreases with increasing distance from Syria (used as a proxy for the origin of farming) and with
increasing time since the introduction of farming into Europe.
Individuals with H, N, and T haplogroups are also consistent with published findings on haplogroups
present during the Neolithic period in Europe. Although nearly absent among Mesolithic hunter-gatherers,
Haplogroup H was present among ~19% Early Neolithic Europeans, and has been found to have
increased in frequency over the course of the Neolithic expansion (62). Today, it represents > 40% of
European mitochondrial variation, the most common haplogroup amongst present-day Europeans.
Haplogroup N1a1, representing haplogroups of one Neolithic and one Copper Age individual in the
Roman time series, has been reported at frequencies only as high as ~9% (German Early Neolithic, n =
160) among Neolithic European populations (63). The frequency of N1a1 does not seem to noticeably
increase in subsequent time periods, as it is found at ~7% in central European Bronze Age populations,
and ~2% in the Yamnaya. The T haplogroup is present at <3% frequency in European Neolithic groups
from France, Germany, and Iberia. The I haplogroup (which is present in one Copper Age Roman
individual) is virtually absent among European Neolithic groups, although found at ~11% frequency in
Early Bronze Age central Europeans previously studied.
Iron Age and Roman Republic (900-27 BCE; n=11)
Among the 11 Iron Age and Roman Republic individuals in the time-series reported here, the
mitochondrial haplogroups H (n=5, 45%), I (n=2), K (n=1), U (n=1), and T (n=2) are represented. In a
study of 15 individuals from Botromagno, in southern Italy, from the same time period (800-500 BCE),
Emery et. al. found similar frequencies of the H haplogroup, at ~46% (7/15 individuals) (64). In contrast
to Iron Age individuals studied here, the U haplogroup was found at much higher levels in Botromagno
individuals, at 40% (6/15 individuals). Among the Botromagno Iron Age individuals, haplogroups V and
J (both n = 1) were also represented, however they were not present in any of the 11 Iron Age individuals
reported here.
Imperial Rome (27 BCE - 300 CE; n=48)
Among the 48 Imperial Roman individuals reported here, the most frequent haplogroups are H (n=10), U
(n=11), and T (n=10), all haplogroups present since the Neolithic period, according to the Roman timeseries reported here. Similarly, in a study of 30 individuals from Vagnari in southern Italy during this
period, the H haplogroup was also common at 40%, present in 12 out of 30 individuals, as was the T
haplogroup (n=5) (64). Surprisingly, the U haplogroup was not present among the Vagnari Roman era
individuals, despite being present in 23% of Imperial Roman individuals reported here.
Haplogroups J (n=3), which was not found in individuals of preceding time periods, and K (n=2) are
found at lower frequencies. Along with haplogroups H and T, J and K are also typical of Eurasian
populations. Both J and K are present at similar frequencies (n=2 each) in the individuals from Vagnari
during the same period.
Haplogroups D, HV, R, and X are represented by one individual each from the Imperial Roman period,
and interestingly, are not found in preceding time periods. Among the Vagnari individuals, haplogroups D
(n=2), HV (n=1), and X (n=2) are also present at low frequencies.
The D haplogroup is considered to be of East Asian origins. R78, the only individual in the time series
representing this haplogroup, projects closely to some eastern Mediterranean populations (Turkish Jews,
Cypriots, and Greeks) in PCA (Fig. S15), although not as closely as some other individuals of the same
time period. Although rare among modern Europeans, Prowse et. al. found that one out of ten individuals
from this same time period (2nd-4th century CE) in Vagnari (southern Italy) had the D mitochondrial
haplogroup (65).
Individual R132, notable for having substantial African ancestry, has a haplotype (R0a2j) belonging to a
sister clade, R0, of haplogroup H. The R0 clade has also been found in a Phoenician Lebanese individual
dated to 539–330 BCE (66). For present-day populations, one study found that the R0a subgroup is found
at nearly 40% frequency in the Arabian peninsula, and at 11% and 22% in Yemenite Jews and Ethiopian
Jews, respectively (34, 67). Another study that analyzed individuals from the 1000 Genomes Project,
found the R haplogroup to be virtually absent in European, African, and admixed American populations,
although fairly common in East Asian and Indian populations (of note Middle Eastern and North African
populations are not represented in the 1000 Genomes Project) (68).
Late Antiquity (300 CE - 700 CE; n=24)
As in previous periods, haplogroup H (n = 8, 33%) is the most frequent among Late Antique individuals,
followed by T (n=6), K (n=3), U (n=2), and J (n=2). Haplogroups HV, I, and L are all represented by one
individual each. All haplogroups, except L, are common among Eurasian populations. R30 is the only
individual in the time-series with a haplotype from this group, specifically subgroup L4, which is rare
globally (<0.5%, 12/2504) and found almost exclusively in African populations based on populations in
the 1000 Genomes Project (68). However, even in the African populations studied, L4 low frequencies
even in African populations studied (2.4%, 12/497). Nevertheless, Prowse et. al. showed that 1 out of 10
individuals at Vagnari in southern Italy had an L haplogroup (65).
Medieval and Early Modern (700 CE - 1800 CE; n=28)
In contrast to the increasing frequency of the H haplogroup in preceding time periods, only 2 Medieval
and Early Modern individuals (~8%) in the Roman time series have the H haplogroup. Haplogroups HV
(n=4, 17%), T (n=3) and U (n=3) are the most frequently observed; followed by H and J (two individuals
each); and I, K, N all with one individual each.
With the exception of haplogroup N, all others are fairly common in present-day European populations.
Haplogroup N is present at highest frequencies in Asian groups, compared to other populations in the
1000 Genomes Project (68). Of note, one Neolithic and one Copper Age individual have N haplogroups,
along with individual R59 from the Medieval period.
Since all libraries were treated with partial-UDG, a deamination signature of > 0.04 remain the last 2 bp
on each end of a read (also a criteria used in sample screening). In the main pipeline used for genotype
calling, two base pairs on each end are trimmed. However, for determining mitochondrial contamination
and the endogenous mitochondrial genome, these untrimmed reads were used to extract only reads with a
damage signature. The endogenous consensus mitochondrial genome was called simultaneously while
estimating mitochondrial contamination using schmutzi (47). Sequencing reads were aligned to the
revised Cambridge Reference Sequence (rCRS) mitochondrial genome (NC_012920.1).
First deamination and a contamination estimate based on it were estimated using the contDeam tool in
schmutzi with the following parameters: length of expected deamination set to 2 (--lengthDeam 2) and
library type set to double strand (--library double). Second, the main schmutzi program was used to 1)
estimate contamination based on a haplogroup frequency database in conjunction with the deamination
estimates from contdeam and 2) to assemble the endogenous consensus MT genome informed by
contamination. Base quality filtering of 30 (--qual 30) and the --uselength parameter were both used. We
found that using a global haplogroup frequency database did not provide any additional information than
using the eurasian database, both provided by schmutzi. We also ran schmutzi with both a set deamination
rate of 0.05 (based on results from Mapdamage during screening of samples) and with the rate estimated
by contDeam.
The output of this pipeline is a contamination estimate based on deamination rates, a contamination
estimate based on haplogroup frequencies, a contaminant MT genome, and an endogenous MT genome.
Haplogroups for the consensus endogenous genomes were called using the command line version of
Haplogrep (v2.1.20) (59) (Table S2; Fig. S4). Contamination estimates are reported along with X
chromosome contamination estimates, where possible (for males).
Mesolithic (10,000-6,000 BCE; n=3)
All three mesolithic individuals have haplotypes from the U group, two from the U5 subgroup and one
from U8. In a study of the neolithic expansion in Europe, 83% of European hunter-gatherers (n = 23)
8 were shown to have U haplotypes, compared to 12% of farmers (n = 105)(60). More specifically,
haplogroup U5 (along with U2) represent the majority of mitochondrial variation in Western HunterGatherers (WHG), Eastern Hunter-Gatherers (EHG), and Scandinavian hunter-gatherers (SHG)(14).Thus
the Italian Mesolithic individuals reported here have typical mitochondrial haplogroups compared to
contemporaneous Europeans.
Neolithic and Copper Age (6,000-2,300 BCE; n=13)
Three Neolithic individuals reported here have mitochondrial haplotypes in the U group, three in the K
group, and one of each in the H, N, and T groups. The three Copper Age individuals have N, K, and I
haplogroups. The K haplogroup is thought to be a marker of the neolithic expansion as it is nearly absent
in hunter-gatherers and at the highest levels in the Near East (61). Isern shows that the frequency of K
decreases with increasing distance from Syria (used as a proxy for the origin of farming) and with
increasing time since the introduction of farming into Europe.
Individuals with H, N, and T haplogroups are also consistent with published findings on haplogroups
present during the Neolithic period in Europe. Although nearly absent among Mesolithic hunter-gatherers,
Haplogroup H was present among ~19% Early Neolithic Europeans, and has been found to have
increased in frequency over the course of the Neolithic expansion (62). Today, it represents > 40% of
European mitochondrial variation, the most common haplogroup amongst present-day Europeans.
Haplogroup N1a1, representing haplogroups of one Neolithic and one Copper Age individual in the
Roman time series, has been reported at frequencies only as high as ~9% (German Early Neolithic, n =
160) among Neolithic European populations (63). The frequency of N1a1 does not seem to noticeably
increase in subsequent time periods, as it is found at ~7% in central European Bronze Age populations,
and ~2% in the Yamnaya. The T haplogroup is present at <3% frequency in European Neolithic groups
from France, Germany, and Iberia. The I haplogroup (which is present in one Copper Age Roman
individual) is virtually absent among European Neolithic groups, although found at ~11% frequency in
Early Bronze Age central Europeans previously studied.
Iron Age and Roman Republic (900-27 BCE; n=11)
Among the 11 Iron Age and Roman Republic individuals in the time-series reported here, the
mitochondrial haplogroups H (n=5, 45%), I (n=2), K (n=1), U (n=1), and T (n=2) are represented. In a
study of 15 individuals from Botromagno, in southern Italy, from the same time period (800-500 BCE),
Emery et. al. found similar frequencies of the H haplogroup, at ~46% (7/15 individuals) (64). In contrast
to Iron Age individuals studied here, the U haplogroup was found at much higher levels in Botromagno
individuals, at 40% (6/15 individuals). Among the Botromagno Iron Age individuals, haplogroups V and
J (both n = 1) were also represented, however they were not present in any of the 11 Iron Age individuals
reported here.
Imperial Rome (27 BCE - 300 CE; n=48)
Among the 48 Imperial Roman individuals reported here, the most frequent haplogroups are H (n=10), U
(n=11), and T (n=10), all haplogroups present since the Neolithic period, according to the Roman timeseries reported here. Similarly, in a study of 30 individuals from Vagnari in southern Italy during this
period, the H haplogroup was also common at 40%, present in 12 out of 30 individuals, as was the T
haplogroup (n=5) (64). Surprisingly, the U haplogroup was not present among the Vagnari Roman era
individuals, despite being present in 23% of Imperial Roman individuals reported here.
Haplogroups J (n=3), which was not found in individuals of preceding time periods, and K (n=2) are
found at lower frequencies. Along with haplogroups H and T, J and K are also typical of Eurasian
populations. Both J and K are present at similar frequencies (n=2 each) in the individuals from Vagnari
during the same period.
Haplogroups D, HV, R, and X are represented by one individual each from the Imperial Roman period,
and interestingly, are not found in preceding time periods. Among the Vagnari individuals, haplogroups D
(n=2), HV (n=1), and X (n=2) are also present at low frequencies.
The D haplogroup is considered to be of East Asian origins. R78, the only individual in the time series
representing this haplogroup, projects closely to some eastern Mediterranean populations (Turkish Jews,
Cypriots, and Greeks) in PCA (Fig. S15), although not as closely as some other individuals of the same
time period. Although rare among modern Europeans, Prowse et. al. found that one out of ten individuals
from this same time period (2nd-4th century CE) in Vagnari (southern Italy) had the D mitochondrial
haplogroup (65).
Individual R132, notable for having substantial African ancestry, has a haplotype (R0a2j) belonging to a
sister clade, R0, of haplogroup H. The R0 clade has also been found in a Phoenician Lebanese individual
dated to 539–330 BCE (66). For present-day populations, one study found that the R0a subgroup is found
at nearly 40% frequency in the Arabian peninsula, and at 11% and 22% in Yemenite Jews and Ethiopian
Jews, respectively (34, 67). Another study that analyzed individuals from the 1000 Genomes Project,
found the R haplogroup to be virtually absent in European, African, and admixed American populations,
although fairly common in East Asian and Indian populations (of note Middle Eastern and North African
populations are not represented in the 1000 Genomes Project) (68).
Late Antiquity (300 CE - 700 CE; n=24)
As in previous periods, haplogroup H (n = 8, 33%) is the most frequent among Late Antique individuals,
followed by T (n=6), K (n=3), U (n=2), and J (n=2). Haplogroups HV, I, and L are all represented by one
individual each. All haplogroups, except L, are common among Eurasian populations. R30 is the only
individual in the time-series with a haplotype from this group, specifically subgroup L4, which is rare
globally (<0.5%, 12/2504) and found almost exclusively in African populations based on populations in
the 1000 Genomes Project (68). However, even in the African populations studied, L4 low frequencies
even in African populations studied (2.4%, 12/497). Nevertheless, Prowse et. al. showed that 1 out of 10
individuals at Vagnari in southern Italy had an L haplogroup (65).
Medieval and Early Modern (700 CE - 1800 CE; n=28)
In contrast to the increasing frequency of the H haplogroup in preceding time periods, only 2 Medieval
and Early Modern individuals (~8%) in the Roman time series have the H haplogroup. Haplogroups HV
(n=4, 17%), T (n=3) and U (n=3) are the most frequently observed; followed by H and J (two individuals
each); and I, K, N all with one individual each.
With the exception of haplogroup N, all others are fairly common in present-day European populations.
Haplogroup N is present at highest frequencies in Asian groups, compared to other populations in the
1000 Genomes Project (68). Of note, one Neolithic and one Copper Age individual have N haplogroups,
along with individual R59 from the Medieval period.