|
|
Post by Admin on Jun 28, 2022 17:42:17 GMT
To better understand the contexts of Kara-Djigach and Burana, we translated and analysed surviving archival information from their excavations (Supplementary Information 2 and Supplementary Figs. 1–4). Furthermore, we generated human genomic data from 7 individuals (5 from Kara-Djigach and 2 from Burana) through a hybridization capture of approximately 1.24 million ancestry-informative single-nucleotide polymorphisms (SNPs)28, which resulted in 4 individuals with sufficient genomic coverage for population genetic analyses (>30,000 SNPs). Using principal component analysis and ancestry modelling, we found these individuals to be falling broadly within the variability of ancient and present-day populations from central Eurasia. However, precise connections could not be determined given the scarcity of contemporaneous human genomic data from this region (Supplementary Information 3, Supplementary Fig. 5 and Supplementary Tables 2–5). On the basis of the available tombstone inscriptions, burial artefacts, coin hoards and historical records, we found that the Chüy Valley housed ethnically diverse communities that relied on trade and maintained connections with several regions across Eurasia (Supplementary Information 2). Such links may have contributed to the spread of infectious diseases to and from this region during the fourteenth century.
Ancient pathogen DNA screening
To investigate traces of ancient pathogen DNA that could explain the cause of the suspected epidemic, shotgun metagenomic data generated from all seven individuals were taxonomically classified using the HOPS pipeline29 (Supplementary Table 6). Of those, three individuals exhumed from the Kara-Djigach cemetery (BSK001, BSK003 and BSK007) displayed potential evidence of ancient Y. pestis DNA (Supplementary Table 7) as well as low edit distances in reads mapping against the CO92 reference genome, and the presence of chemical alterations characteristic of aDNA (Supplementary Fig. 6 and Supplementary Table 8). As such, the respective DNA libraries were subjected to whole-genome Y. pestis capture (Methods).
|
|
|
|
Post by Admin on Jun 29, 2022 17:41:16 GMT
The ancestor of a fourteenth-century polytomy
Whole-genome Y. pestis capture yielded 6.7-fold and 2.8-fold average coverage for BSK001 and BSK003, respectively. Coverage across all three Y. pestis plasmids ranged from 24.7-fold to 4.7-fold (Supplementary Tables 9 and 10). For BSK007, genomic coverage was lower, approximately 0.13-fold, resulting from poorer aDNA preservation that was also reflected in the shotgun screening and human DNA enrichment data (Supplementary Tables 2, 3 and 8). Nevertheless, this sample was considered a true Y. pestis-positive because of the even distribution of mapping reads against the CO92 reference chromosome and the presence of aDNA-associated damage (Extended Data Figs. 2 and 3 and Supplementary Tables 9–11). Furthermore, a metagenomic classification of BSK007 reads aligning to the pCD1, pMT1 and pPCP1 plasmids identified >99% as Y. pestis-specific (Extended Data Fig. 3).
To evaluate whether the higher-coverage Y. pestis genomes BSK001 and BSK003 represented distinct bacterial strains, we compared their SNP profiles. To limit variant calls deriving from environmental contamination, particularly given the high amounts of multi-allelic sites identified in both genomes (Supplementary Fig. 7), we performed a taxonomy-informed metagenomic filtering using MALT (Methods and Supplementary Table 11). We identified 20 sites differing between BSK001 and BSK003, all of which are unique variants in the lower-coverage BSK003 (Supplementary Table 12). On the basis of previously defined authenticity criteria30,31 (Methods), all such variants were consistent with residual exogenous contamination, suggesting that the two genomes were probably identical. Recovery of identical strains from both individuals is consistent with published evidence showing low diversity in Y. pestis genomes isolated from single epidemic contexts10,17,20,21,32. On the basis of their associated tombstones, BSK001, BSK003 and BSK007 were buried during the epidemic year 1338–1339 (Fig. 1 and Supplementary Information 2) and our data further support a Y. pestis involvement in this event.
We performed a comparative SNP analysis between the Kara-Djigach genomes and previously published historical and currently circulating Y. pestis diversity (Fig. 2a, Supplementary Tables 13–15). For this, BSK001 and BSK003 were combined (BSK001/003) to achieve an increased genomic resolution (combined coverage of 9.5-fold; Supplementary Table 9). Our analysis revealed one SNP unique to BSK001/003 when compared against 203 modern and 46 historical Y. pestis chromosomal genomes (Extended Data Fig. 4 and Supplementary Tables 16 and 17). This SNP was found in a region with persistent multi-allelic sites; therefore, it is considered artefactual31 (Supplementary Fig. 8). Consistent with previous research on the evolutionary history of Y. pestis16, our inferred maximum likelihood phylogeny exhibited five major branches, designated 0, 1, 2, 3 and 4, with published Second Pandemic genomes being associated with branch 1 (Fig. 2b). The placement of BSK001/003 is ancestral to all published fourteenth-century genomes from western Eurasia (Fig. 2b and Extended Data Fig. 5), separated by one SNP from LAI009, an isolate from the Volga region in eastern Europe17, and by two SNPs from five genetically identical Black-Death-associated genomes from southern, central and northern Europe17,21. Specifically, BSK001/003 is positioned on a node previously designated N07 (ref. 16), which preceded the multifurcation of branches 1–4. To evaluate whether missing data affected the accuracy of our phylogenetic placements, we investigated all BSK001 and BSK003 variant calls for shared positions with lineages deriving from the N07 node and those directly preceding it. BSK001/003 carries the ancestral state in all covered diagnostic SNPs defining branches 1–4 and 0.ANT3, which is the closest related branch 0 lineage to BSK001/003, as well as the derived state in all positions leading from 0.ANT3 to N07 (Fig. 2c, Extended Data Fig. 6 and Supplementary Table 18). At our current resolution, we conclude that BSK001/003 represents the direct progenitor of the branch 1–4 polytomy.
|
|
|
|
Post by Admin on Jun 29, 2022 22:10:17 GMT
Fig. 2: Comparisons between BSK001/003 and published Y. pestis genomic diversity. 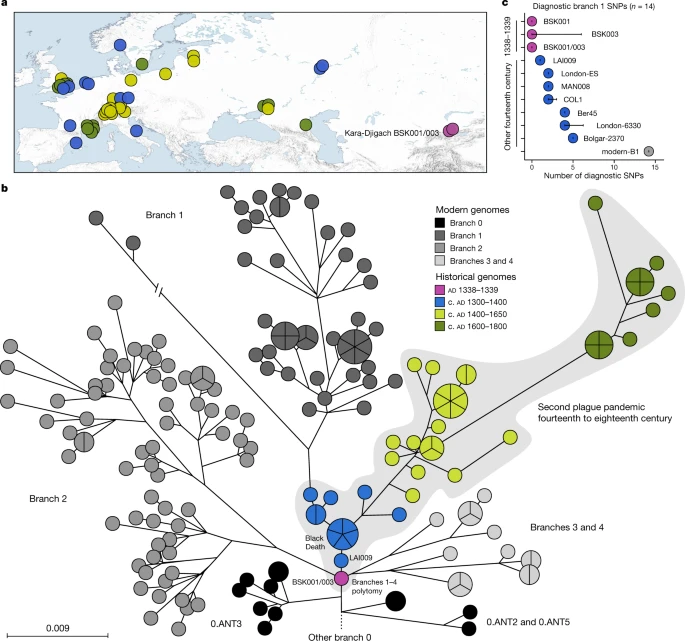 a, Map of all historical Y. pestis genomes used in the present study (n = 48). The colours represent different genome ages on a scale between 1300 and 1800, as depicted in b. The colour scale is maintained across all panels of this figure. To aid visibility in overlapping symbols, a jitter option was implemented for plotting genomes on the map. The map was created with QGIS v.3.22.1 (ref. 51) and uses Natural Earth vector map data from www.naturalearthdata.com/. b, Y. pestis maximum likelihood phylogeny based on 2,960 SNPs, visualized using GrapeTree50. The depicted portion of the phylogeny contains the closest related lineages to BSK001/003. (For a fully labelled tree, see Extended Data Fig. 5). The colours of published historical strains are consistent with a. The scale denotes the number of substitutions per genomic site. c, Abundance of diagnostic SNP sharing in fourteenth-century Y. pestis genomes. The number of diagnostic SNPs (n) shared between all modern genomes on branch 1, and therefore defining this branch, were retrieved from a comparative SNP table of 203 modern Y. pestis genomes. SNP sharing was assessed by determining the allele status of each diagnostic position according to a threefold SNP calling threshold. The error bars denote the degree of missing data (n) in the respective ancient genome. Refer to Extended Data Fig. 6 and Supplementary Table 18 for an overview of diagnostic SNP sharing on different phylogenetic branches. |
|
|
|
Post by Admin on Jun 30, 2022 18:00:57 GMT
Divergence time for the branch 1–4 polytomy The polytomy of branches 1–4 is a major event in the evolution of Y. pestis given its association with the Black Death9,26,33 and the rich genetic diversity that emerged from it16 (Fig. 2b). Estimates on the timing of this diversification have so far yielded wide ranges spanning from the tenth to the fourteenth centuries16,34. Recently, a narrower time frame was proposed that placed this emergence in the early thirteenth century, more than 100 years before the Black Death22,26. As BSK001/003 represents the common ancestor of branches 1–4, we used this genome from 1338 to 1339 to construct a time-calibrated phylogeny and re-estimate an age range for this diversification with BEAST2 (Supplementary Figs. 9 and 10 and Supplementary Table 19). After evaluating a number of demographic models (Supplementary Table 20), our resulting estimates based on the coalescent Bayesian skyline model revealed overlapping ages for the divergence of BSK001/003 (95% highest posterior density (HPD): 1308–1339), as well as for that of branch 1 from branches 2–4 (95% HPD: 1317–1345) (Fig. 3). As BEAST2 only infers bifurcating trees, we also used TreeTime35 to infer a time-calibrated phylogeny that can retain polytomies. Consistent with our estimates above, we inferred a 1316–1340 date for the split time of branches 1–4 (Supplementary Fig. 11), although we caution that this method does not account for age uncertainties in ancient genomes. Taken together, the present results support an age range spanning the first half of the fourteenth century for the timing of the branch 1–4 polytomy. Fig. 3: Molecular dating of Y. pestis branches 1–4. 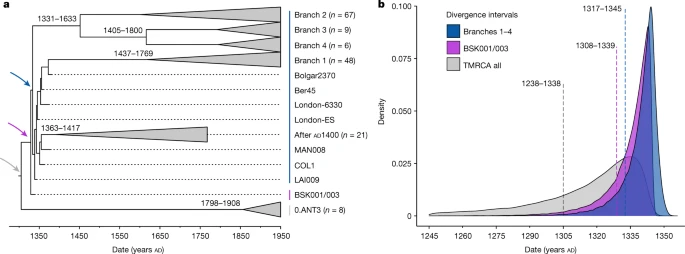 a, Maximum clade credibility time-calibrated phylogenetic tree. The tree is based on 167 genomes (historical and modern) and was estimated using the coalescent skyline tree prior and a log-normal relaxed clock. Collapsed branches contain modern and ancient isolates dating after AD 1400 (post-Black Death). The coloured arrows mark the nodes, for which equivalent posterior age distributions are shown in b. The estimated divergence dates (95% HPD intervals) of modern branches are shown on each corresponding node. b, Estimated posterior distributions based on the coalescent Bayesian skyline tree prior for the divergence of Y. pestis branches 1–4 (blue), for the estimated divergence of BSK001/003 (purple) and for the entire dataset used for this analysis (time to the most recent common ancestor of branches 1–4 and 0.ANT3, shown in grey). The dotted lines indicate mean posterior estimates and are annotated with the corresponding 95% HPD intervals. Furthermore, to quantify the proportion of present-day Y. pestis genetic diversity that emerged from this polytomy, we computed mean pairwise distances (MPDs) and Faith’s phylogenetic diversity (FPD) indices in 203 genomes comprising our entire modern dataset, as well as 130 genomes comprising branches 1–4 (Methods). In our dataset, 64% (130 out of 203) of modern Y. pestis strains belonged to branches 1–4, reflecting the high worldwide frequency known for these lineages16,36,37. We estimate that branches 1–4 represent approximately 40% of the overall phylogenetic diversity within present-day Y. pestis based on our full dataset (MPD ratio: 41%; 95% percentile interval (PI): 35.3–46.4; FPD ratio: 35.9%; 95% PI: 31.6–39.5). This value is marginally reduced after equalizing the number of genomes in branches 1–4 and branch 0 (MPD ratio: 36.8%; 95% PI: 32.0–41.9; FPD ratio: 33.9%; 95% PI: 29.4–37.7) (Extended Data Fig. 7). Given that the known history of Y. pestis reaches back at least 5,000 years38, it is notable that a substantial fraction of its surviving genetic diversity accumulated since the fourteenth century. |
|
|
|
Post by Admin on Jul 1, 2022 16:39:47 GMT
Plague reservoirs in the Tian Shan area To address existing hypotheses on the Black Death’s geographical origins (Supplementary Information 1), we investigated the possibility of a local emergence versus an introduction of the BSK001/003 strain into the Chüy Valley from a different area. For this, we assessed the geographical distribution of the most closely related ancestral branching lineages to BSK001/003 and identified 164 present-day 0.ANT strains with record of their isolation locations (Supplementary Table 21). Consistent with previous interpretations9,18,26, we found that all such strains were retrieved from foci in eastern Kazakhstan, eastern Kyrgyzstan and the Xinjiang Uygur Autonomous Region of northwestern China (Fig. 4 and Extended Data Fig. 8). Although we cannot exclude a different geographical range for these lineages in the past, the current data are consistent with a local emergence of BSK001/003 within the extended Tian Shan region. Intriguingly, the oldest recovered genome associated with 0.ANT was also identified in the Tian Shan region (third century AD)39 and forms part of an extinct clade that caused the first plague pandemic (sixth to eighth centuries AD)30. As noted previously18,26,33,40, most extant 0.ANT strains have been isolated from marmots and their ectoparasites known to be the primary Y. pestis reservoirs in these areas (Supplementary Table 21). Therefore, such species could represent possible candidates for the spillover that led to the second plague pandemic. Fig. 4: Geographical isolation locations of modern 0.ANT lineages. 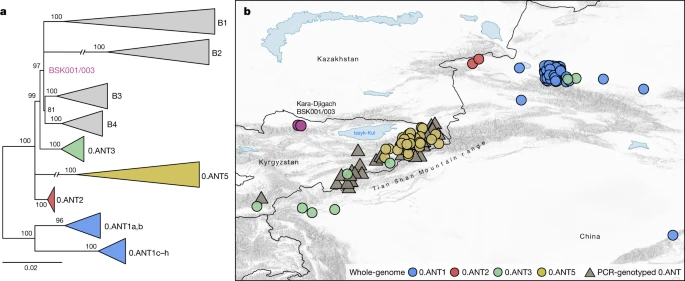 a, Maximum likelihood phylogenetic tree, based on 2,441 genome-wide variant positions. The tree was constructed to indicate the genetic relationships between available 0.ANT genomes depicted on the map and BSK001/003. Modern branches were collapsed to enhance tree clarity (see Extended Data Fig. 8 for a full tree). b, Map depicting the geographical isolation locations of 0.ANT strains (Supplementary Table 21), which belong to the closest ancestral branching lineages to the Kara-Djigach strain. The map includes both whole-genome data (further specified as 0.ANT lineages 1, 2, 3 and 5) and PCR-genotyped isolates that are broadly defined as 0.ANT, belonging to any of the 4 lineages. For strains in which exact geographical coordinates were unavailable, locations were approximated according to their associated plague reservoirs. To aid visibility in overlapping symbols, a jitter option was implemented for plotting objects on the map. The map was created with QGIS v.3.22.1 (ref. 51) and uses Natural Earth vector map data from www.naturalearthdata.com/. |
|

