|
|
Post by Admin on Nov 10, 2019 21:17:26 GMT
An international team of scientists has for the first time performed an analysis of the complete genome of the population of North Africa. They have identified a small genetic imprint of the inhabitants of the region in Palaeolithic times, thus ruling out the theory that recent migrations from other regions completely erased the genetic traces of ancient North Africans. 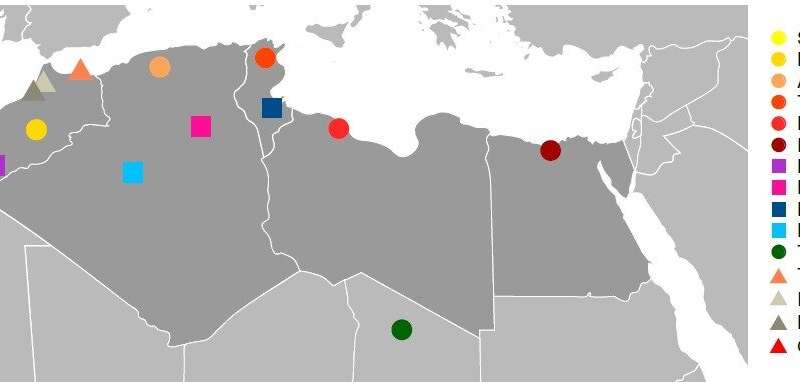 The origin and history of the population of North Africa are different from the rest of the continent and are more similar to the demographic history of regions outside Africa: the Middle East, Europe or Asia. Palaeontological remains exist that prove the existence of humans in the region more than 300,000 years ago. In any case, previous genetic studies had shown that current populations of North Africa originated as a result of a Back to Africa process, that is, recent migrations from the Middle East that populated northern Africa. Hence, the debate that arises is one of continuity versus replacement. On the one hand, the continuity hypothesis posits that current North African populations descend from Palaeolithic groups, i.e., that such ancient humans are the ancestors of present human populations. Meanwhile, other hypotheses argue that the populations that existed in Palaeolithic times were replaced, and that the humans that currently inhabit North Africa are the result of recent migrations that arrived there as of the Neolithic.  In this study, the researchers compared genetic data from current North African individuals with data recently published on the DNA of fossil remains found at different sites in Morocco. "We see that the current populations of North Africa are the result of this replacement but we detect small traces of this continuity from Palaeolithic times, i.e., total replacement did not take place in the populations of North Africa", reveals David Comas, lead author. "We do not know whether the first settlers 300,000 years ago are their ancestors, but we do detect imprints of this continuity at least since Palaeolithic times, since 15,000 years ago or more", he adds. "We have seen that the genetic imprint of Palaeolithic populations of North Africa is unique to the current North African populations and is decreasingly distributed from west to east in the region, inversely proportionally to the Neolithic component coming from the Middle East, which had a greater effect on the eastern region, which is geographically closer", says Gerard Serra-Vidal, first author.  "Therefore, our results confirm that migrations from other regions such as Europe, the Middle East and sub-Saharan Africa to this area did not completely erase the genetic traces of the ancient North Africans", explains Comas. These results of the populations of North Africa are in contrast with what is known about the European continent, in whose current populations a strong Palaeolithic component is found, i.e., more continuity and less replacement than in North Africa. Many genomic data are still missing, both of current populations and of fossil remains, to be able to establish the population history of the human species. "This is or particular concern in populations such as those of North Africa about which we have very little information compared to other populations in the world. In order to have a complete picture of human genome diversity still have to do a considerable amount of research", Comas concludes. Summary North Africa is located at the crossroads of the Mediterranean Sea, the Middle East, and the Sahara Desert. Extensive migrations and gene flow in the region have shaped many different cultures and ancestral genetic components through time [1, 2, 3, 4, 5, 6]. DNA data from ancient Moroccan sites [7, 8] has recently shed some light to the population continuity-versus-replacement debate, i.e., the question of whether current North African populations descend from Palaeolithic groups or, on the contrary, subsequent migrations swept away all pre-existing genetic signal in the region. In the present study, we analyze 21 complete North African genomes and compare them with extant and ancient genome data in order to address the demographic continuity-versus-replacement debate, to assess whether these demographic events were homogeneous (including Berber and Arabic-speaking groups), and to explore the effect of Neolithization and posterior migration waves. The North African genetic pool is defined as a melting pot of genetic components, including an endemic North African Epipalaeolithic component at low frequency that forms a declining gradient from Western to Eastern North Africa. This scenario is consistent with Neolithization having shaped most of the current genetic variation in the region when compared to posterior back-to-North-Africa migration waves such as the Arabization. A common and distinct genetic history of the region is shown, with internal different proportions of genetic components owing to differential admixture with surrounding groups as well as to genetic drift due to isolation and endogamy in certain populations. Reference Serra-Vidal et al. (2019) Heterogeneity in Palaeolithic Population Continuity and Neolithic Expansion in North Africa. Current Biology. DOI: doi.org/10.1016/j.cub.2019.09.050 |
|
|
|
Post by Admin on Nov 11, 2019 18:10:27 GMT
Results and Discussion Genetic Components and Population Structure in North Africans Seventeen North African genomes were sequenced together with sixteen sub-Saharan and Eurasian individuals. In total, 10.86 million SNPs were called, using Illumina HiSeq 2000 at a mean coverage of 26×. All analyses were restricted to a high-confidence, 2-Gbp fraction of the genome obtained after applying quality control filtering (see STAR Methods). As a validation process, seven samples were independently genotyped through Affymetrix 6.0 SNP array (see STAR Methods). See Table S1 for extra information and summary statistics. The initial dataset was merged with other available datasets (see STAR Methods), providing ten current and four ancient North African groups (Figure S1). A first exploration of the data was performed using principal component analysis (PCA). The first component (PC1, accounting for 3.5% of the variation) captures the genetic differentiation between sub-Saharan Africans and non-African populations, with ancient and current North Africans placed in an intermediate position (Figure 1A). PC2 (0.7% of the variation) splits Middle Easterns and Europeans, with North Africans closer to the former. Regarding ancient North Africans, while Canary Guanches (∼5th century BCE) cluster with current North Africans (in agreement with their putative Berber origin [9]), Moroccan Epipalaeolithic samples from Taforalt cluster independently, while Moroccan Early (IAM) and Late Neolithic (KEB) have intermediate positions in the PC.  Figure 1 Principal Component Analysis and ADMIXTURE Analysis for K = 6 Population structure and ancestry components were determined by ADMIXTURE (Figures 1B and S2). The lowest cross-validation errors were found in the range between K = 4 and K = 7, which depicts North African ancestry as a mosaic of components that are consistently conserved across different values of K (Figure 1C): (1) a sub-Saharan component derived from trans-Saharan gene flow (black); (2) European and Anatolian Neolithic component (white); (3) an ancient Middle Eastern component, prevalent in Natufian and Levant Neolithic and also present in current Levantine populations, particularly in Bedouin groups (blue); (4) a component coming from Caucasus hunter-gatherers and Iran Neolithic (purple); and, (5) a North African autochthonous Epipalaeolithic component prevalent in the Moroccan Epipalaeolithic from Taforalt and Early Neolithic samples (orange), observed at low proportions in Moroccan Late Neolithic, Guanches, and in current Canary Islanders. The North African autochthonous component is absent in any other population outside North Africa from K = 7 onward, while its presence for lower K in sub-Saharan population values might be explained by the presence of a sub-Saharan ancestral component in North African Palaeolithic populations, as pointed out by [8]. Haplotype-based methods also point to the presence of a genetic component coming from Epipalaeolithic times in current North African populations. Taforalt samples cluster together with current North Africans in the fineSTRUCTURE haplotype-sharing-based tree (Figure S3), while the ChromoPainter coancestry matrix results point to higher levels of genomic tracts in current North Africans coming from their Epipalaeolithic ancestors than in any other extant population. Most North African current populations cluster together in a single cluster, although genetic groups within the North African cluster do not correspond to geographical or linguistic-based populations, in agreement with certain degree of genetic heterogeneity ([1] and others). Even though a sudden genetic change comparing early and late Neolithic samples in Morocco has been recently proposed [7], our data show that there are still traces of the Epipalaeolithic ancestors in the genomes of extant North Africans, as shown by the admixture components and the amount of shared haplotypes between ancient and present North African genomes. Our results confirm that gene flow in the area, coming for surrounding regions such as Europe, the Middle East or sub-Saharan Africa did not completely erase the ancient background of autochthonous North Africans in the last 15,000 years. This Palaeolithic autochthonous genetic component might correlate with the Maghrebi component as a result of a back-to-Africa gene flow defined by [6], and its presence is not distributed following a uniform pattern in the area. Genetic Heterogeneity within North Africa Internal differences can be observed in both the ADMIXTURE and ChromoPainter results; in particular, some ancestral components present geographical gradients across the region. The gradients observed in the previous analyses were tested with f3(X, Taforalt; Ju/’hoanNorth), f3(X, Yoruba-Mandenka; Ju/’hoanNorth), and f3(X, CHG-Iran_N; Ju/’hoanNorth) (Figure S4). Saharawi and Berber groups show the highest outgroup-f3 values for the Epipalaeolithic Taforalt component (0.218–0.222). The ancient samples IAM (0.322), KEB (0.235), and Guanche (0.227) show a higher North African Epipalaeolithic component than current populations (in agreement with the ADMIXTURE analysis), whose decrease is compatible with a dilution of the Taforalt component through time. This component is significantly more frequent in Western (Saharawi, Moroccan, Algerian) and Berber-speaking individuals (Saharawi, Mozabites, Moroccan, and Moroccan and Tunisian Berbers) (Mann-Whitney U test, p value = 4.52e−15), suggesting a continuity of this autochthonous North African component in Berber-speaking groups. Although no perfect correlation between culture (i.e., Arabic- and Berber-speaking groups) and genetics can be claimed ([1]), the consideration of the Berber-speaking groups as the autochthonous peoples of North Africa [10] is reinforced by the present results. Zenata, Mozabite, Saharawi, and Moroccan groups show the highest proportions of sub-Saharan ancestry, which could be attributed to the slave trade routes carried out during Roman and Arab presence mainly in northwest Africa [11, 12]. The Taforalt and Moroccan Early Neolithic have a higher sub-Saharan affinity than most current North Africans (as stated by [8]), whereas the Moroccan Late Neolithic and the Guanches have a similar level of sub-Saharan affinity to most current groups analyzed in the present study. Egyptian and Libyan show the highest proportion of the Caucasus-Iran component, in agreement with their geographical proximity to southwest Asia. A high f3 value is also estimated for KEB (0.250), in contrast to the lower estimated values found for Taforalt and IAM (0.206, 0.216), suggesting that this component might have entered North Africa during the late Neolithic coming from Iran and may have been posteriorly diluted in western North Africa. |
|
|
|
Post by Admin on Nov 12, 2019 18:29:37 GMT
Admixture Models in North Africa North African populations have been described as having a major influence from outside the African continent, together with a sub-Saharan component coming from trans-Saharan migrations [6]. In order to determine to which extent the North African genomes can be modeled as an admixture of sub-Saharans and out-of-African components, f3 admixture test was performed as f3(Sub-Saharan, West Eurasian; X), with Yoruba and Mandenka as sub-Saharan populations, Basques and Iraqis as West Eurasians, and X being each North African group analyzed. f3 results are negative for most North African populations, fitting a model of admixture between sub-Saharans and Eurasians. However, some samples, such as some Algerian, Mozabite, Zenata, Saharawi, and particularly Tunisian Berbers, show significantly positive f3 results (Figure 2A) due to extensive genetic drift, as further proved by a TreeMix analysis (data not shown), which discards a different genetic history of these groups.  Figure 2 Admixture-f3(Yoruba-Mandenka, Basque-Iraqi; North African) and Runs of Homozygosity Analysis To determine the main Eurasian ancestry sources in North Africa during the back-to-Africa events and test whether these sources are homogeneous across North African groups, admixture-f3 tests of the form f3(OOA, SS; NA) were performed (OOA, out of Africa population; SS, Sub-Saharan population; NA, North African population). The sub-Saharan source was fixed to Yoruba (no significantly different results were found when choosing an East African group, such as Dinka, instead; data not shown). For all groups (with the exception of Tunisian Berbers, for which admixture was not detected through f3, see above), the most significant results were found for Sardinians, Basques, and North Italians (data not shown). When the analyses were repeated adding ancient Eurasian populations [13] to the dataset, the higher significant values were found with the Neolithic farmers from Europe and Anatolia and, again, Sardinian and Basques, which is consistent with their high frequency of Neolithic component [13]. These results point to the main role of the Neolithization process when shaping the current North African genetic landscape, thus supporting the PCA, ADMIXTURE, and internal f3 tests, where Eurasian gene flow after Neolithization (such as the Arabization process starting in the 7th century CE) seem to have had a lower impact. The arrival of the Neolithic to North Africa as a demic diffusion process from the Middle East with putative interactions with local groups is widely accepted [14, 15], although some hypotheses and recent genetic data also point to direct contacts with Iberia [7, 16]. Despite recent approximate Bayesian computational based analyses of genetic data suggesting that the synchronous Neolithic expansion from the Middle East through both Mediterranean shores (i.e., Europe and North Africa) had a similar demographic pattern [17], our results point to a larger demographic replacement in North African than in European populations. The genomes of current Europeans carry a larger amount of hunter-gatherer components (up to 50% in Northern Europeans, according to [18]) compared to those of North Africans, where the Palaeolithic component, although present in extant populations, it is found at much lower frequencies (from 18.1% in Western Sahara to 5.2% in Egypt, according to the crude estimates of ADMIXTURE). This might suggest that the Neolithic demographic imprint was lower in Europe than in North Africa, where fewer local hunter-gatherers were assimilated by Neolithic farmers [13]. Complex demographic scenarios were tested with qpGraph [19] on a model involving different ancestral components: sub-Saharan (Yoruba), European (Basque), Middle Eastern (BedouinB), and North African Epipalaeolithic (Taforalt) (Figure 3). All North African groups fit into the tested model, with varying proportions of the four ancestral components, yielding compatible results with the admixture-f3 tests (Figure 2A). Admixture signals in contemporary North African populations were dated using MALDER. All population triplets of the form (Ref A, Ref B, Target) were tested, taking the same populations used in the qpGraph analysis (i.e. Yoruba, Basque, BedouinB, and Taforalt) as references. Tunisian Berbers were chosen instead of Taforalt when the latter lacked power to give significant results due to their high missing data, since Tunisian Berbers have a high North African component, according to previous studies [1]. Interestingly, only tests involving the Yoruba population passed all the pre-test steps and yielded statistically significant results. Dates for these admixture times are shown in Table S2 for Saharawi and Egyptian, which account for both geographic and genetic diversity extremes in North Africa. These results (ranging from 1329 to 1643 AD) are compatible with previous estimates of the sub-Saharan introduction in North African populations in recent historical times ([6]).  Figure 3 Tested qpGraph Model and Proportions of Ancestral Components in North African Populations Genetic drift detected in the admixture-f3 analyses was further studied by computing the runs of homozygosity (ROH). Long runs of homozygosity are a signal of recent relatedness between individuals (i.e., interbreeding or consanguinity), which tend to occur in populations that are isolated or endogamous, while short runs of homozygosity show historically low effective population sizes. We compared the cumulative length of short ROHs (shorter than 1 Mb) and the length of long ROHs (longer than 1 Mb) (Figure 2B). North African samples show intermediate levels of length of short ROHs between sub-Saharan samples and non-African samples. Long ROHs, on the contrary, group North Africans with most sub-Saharan and Eurasian samples, with the exception of Tunisian Berber samples, which have significantly high values, pointing to high levels of interbreeding. Differences in the number and cumulative length of long and short ROHs were not statistically significant between Arabs and Berbers (Mann-Whitney U tests p > 0.05), pointing to no correlation between cultural groups and genetic heterogeneity. Genetic inbreeding might have been frequent and has been claimed in some North African populations as a result of isolation [20, 21]. Nonetheless, not all North African groups exhibit long ROH or signals of extensive drift, and these signals are not correlated by geography or culture, pointing to heterogeneity in the isolation patterns of North African populations [1, 20]. The simplistic idea of considering Berber-speaking groups as small, isolated, and inbred not only is misleading but also is not supported by the present data. Population dynamics in North Africa were further assessed using multiple sequentially Markovian coalescent (MSMC) analyses to estimate population changes in the effective population size (Ne) through time. North African individuals show similar effective population size patterns to Eurasians (Figure 4A), with a population decrease after the split with sub-Saharan Africans (∼70 thousand years ago [kya] according to [22]), suggesting an Ne reduction after the out-of-Africa event. Almost all North African individuals show a very similar MSMC pattern, pointing to a relatively homogeneous population size evolution history (at least during the time period with MSMC credible interval values).  Figure 4 Effective Population Size throughout Time and Pairwise Genetic Differences The Zenata Berbers, however, show a minor Ne decay compared to the rest of North Africans and Eurasians analyzed. As pointed out by [22], an extensive admixture history may affect the coalescent history estimated by models that use the density of heterozygous sites, such as MSMC. This might explain why the decay in most North Africans is almost as sharp as the one observed in Basques (due to the high proportion of West Eurasian ancestry in North Africans), and it is moderate in the Zenata, which show a higher proportion of sub-Saharan ancestry (see for instance PCA, ADMIXTURE, f3 analyses, and qpGraph estimates). To assess the influence of sub-Saharan admixture on MSMC results, we masked sub-Saharan tracts found in each North African sample and repeated MSMC analyses. Zenata individuals showed similar Ne decay as the rest of North Africans (data not shown). The nucleotide diversity analysis (π, as defined by [23]) (Figure 4B) shows a similar pattern, with higher values in the Zenata and reduced values in out-of-Africa populations and in North Africans with the highest proportions of non-African ancestry, which was affected by the out-of-Africa bottleneck. Published:October 31, 2019 DOI:https://doi.org/10.1016/j.cub.2019.09.050 |
|
|
|
Post by Admin on Sept 4, 2020 20:07:03 GMT
Pleistocene North African genomes link Near Eastern and sub-Saharan African human populations Abstract North Africa is a key region for understanding human history, but the genetic history of its people is largely unknown. We present genomic data from seven 15,000-year-old modern humans, attributed to the Iberomaurusian culture, from Morocco. We find a genetic affinity with early Holocene Near Easterners, best represented by Levantine Natufians, suggesting a pre-agricultural connection between Africa and the Near East. We do not find evidence for gene flow from Paleolithic Europeans to Late Pleistocene North Africans. The Taforalt individuals derive one-third of their ancestry from sub-Saharan Africans, best approximated by a mixture of genetic components preserved in present-day West and East Africans. Thus, we provide direct evidence for genetic interactions between modern humans across Africa and Eurasia in the Pleistocene. Under typical conditions (i.e., aside from intermittent greening periods), the Sahara desert poses an ecogeographic barrier for human migration between North and sub-Saharan Africa (1). Sub-Saharan Africa is home to the most deeply divergent genetic lineages among present-day humans (2), and the general view is that all Eurasians mostly descend from a single group of humans that dispersed outside of sub-Saharan Africa around 50,000 to 100,000 years before the present (yr B.P.) (3). This group likely represented only a small fraction of the genetic diversity within Africa, most closely related to a Holocene East African group (4). Present-day North Africans share a majority of their ancestry with present-day Near Easterners but not with sub-Saharan Africans (5). Thus, from a genetic perspective, present-day North Africa is largely a part of Eurasia. However, the temporal depth of this genetic connection between the Near East and North Africa is poorly understood and has been estimated only indirectly from present-day mitochondrial DNA (mtDNA) variation (6, 7). Owing to challenging conditions for DNA preservation, relatively few ancient genomes have been recovered from Africa. Genome-wide data from 23 individuals have been reported from South and East Africa, with the oldest dating back to 8100 yr B.P. (4, 8, 9). In North Africa, a genomic study of Egyptian mummies from the first millennium BCE showed that the genetic connection between the Near East and North Africa was established by that time (5). However, the genetic affinity of North African populations at a greater time depth has remained unknown. Here we present genome-wide data from seven individuals, directly dated between 15,100 and 13,900 calibrated years before present (cal. yr B.P.) (table S1), from Grotte des Pigeons near Taforalt in eastern Morocco (10). These genomic data provide a critical reference point to help explain the deep genetic history of North Africa and the broader Middle East (Fig. 1). The Taforalt individuals are associated with the Later Stone Age Iberomaurusian culture, whose origin is debated. These individuals may have descended either directly from the manufacturers of the preceding Middle Stone Age technologies (Aterian or local West African bladelet technologies) or from an exogenous population with ties to the Upper Paleolithic technocomplexes of the Near East or Southern Europe (10, 11).  Fig. 1 Spatiotemporal locations of the Taforalt and other ancient genomes. (A and B) Geographic locations of representative ancient genomes from West Eurasia and Africa included in our analysis. The Pleistocene Taforalt site is denoted by a red circle. (C) The date range of each ancient group is marked by black bars, representing the range of 95% confidence intervals of radiocarbon dates across all dated individuals (cal. yr B.P. on the x axis). Group labels are taken from previous studies reporting each ancient genome (4, 16, 27). N, Neolithic; WHG, Western European hunter-gatherers; EHG, Eastern European hunter-gatherers; CHG, Caucasus hunter-gatherers. For nine Taforalt individuals (table S2), we created double-indexed single-stranded DNA libraries (12) for next-generation sequencing of DNA isolated from petrous bones. We then used in-solution capture probes (13) to enrich libraries for the whole mitochondrial genome and ~1,240,000 single-nucleotide polymorphisms (SNPs) in the nuclear genome (14). The DNA fragments obtained from seven individuals, six genetic males and one female, had postmortem degradation characteristics typical of ancient DNA (tables S3 to S5 and fig. S6). We reconstructed the mitochondrial genomes of all seven individuals (102× to 1701× coverage, unmerged libraries; table S4) while maintaining a low level of contamination from the DNA of modern humans (1 to 8%; table S4). For the nuclear data analysis, in which ancient DNA is more susceptible to contamination than in mitochondrial analyses, we analyzed five individuals (four males and one female) on the basis of coverage (table S3, merged libraries) and negligible modern human contamination for males (1.7 to 2.5%; table S5). For each individual, we randomly chose a single base per site as a haploid genotype. We intersected our new data with data from a panel of worldwide present-day populations, genotyped on the Affymetrix Human Origins array for ~600,000 markers, as well as ancient genomic data covering Europe, the Near East, and sub-Saharan Africa (4, 8, 15–17). The final data set includes 593,124 intersecting autosomal SNPs with 183,041 to 544,232 SNP positions covered for each of the five individuals (table S3). For group-based analyses involving other ancient individuals, we adopted the population labels from the original studies (4, 16). We found an overall high genetic relatedness between the Taforalt individuals, suggesting a strong population bottleneck (fig. S26). We analyzed the genetic affinities of the Taforalt individuals by performing principal components analysis and model-based clustering of worldwide data (Fig. 2). When projected onto the top principal components of African and west Eurasian populations, the Taforalt individuals form a distinct cluster in an intermediate position between present-day North Africans [e.g., Amazighes (Berbers), Mozabites, and Saharawis] and East Africans (e.g., Afars, Oromos, and Somalis) (Fig. 2A). Consistently, we find that all males with sufficient nuclear DNA preservation carry Y haplogroup E1b1b1a1 (M-78; table S16). This haplogroup occurs most frequently in present-day North and East African populations (18). The closely related E1b1b1b (M-123) haplogroup has been reported for Epipaleolithic Natufians and Pre-Pottery Neolithic Levantines (Levant_N) (16). Unsupervised genetic clustering also suggests a connection of Taforalt to the Near East. The three major components that make up the Taforalt genomes are maximized in early Holocene Levantines, East African hunter-gatherer Hadza from north-central Tanzania, and West Africans (number of genetic clusters K = 10; Fig. 2B). In contrast, present-day North Africans have smaller sub-Saharan African components with minimal Hadza-related contribution (Fig. 2B).  Fig. 2 Summary of the genetic profile of the Taforalt individuals. (A) The top two principal components (PCs) calculated from present-day African, Near Eastern, and Southern European individuals from 72 populations. The Taforalt individuals are projected thereon (red inverted triangles), and selected present-day populations are denoted by various colored symbols. Labels for other populations (denoted by small gray squares) are provided in fig. S8. (B) ADMIXTURE analysis results of chosen African and Middle Eastern populations (K = 10). Ancient individuals are labeled in red. Major ancestry components in Taforalt individuals are maximized in early Holocene Levantines (green), West Africans (purple), and East African Hadza (brown). The ancestry component prevalent in pre-Neolithic Europeans (beige) is absent in Taforalt. We calculated outgroup f3 statistics of the form f3(Taforalt, X; Mbuti) across worldwide ancient and present-day test populations. Consistent with previous analyses, we find that ancient Near Eastern populations, especially Epipaleolithic Natufians and early Neolithic Levantines, show the highest outgroup f3 values with Taforalt (Fig. 3A). This is confirmed by f4 symmetry statistics of the form f4(Chimpanzee, Taforalt; NE1, NE2) that measure a relative affinity of a pair of Near Eastern (NE) groups to Taforalt. A positive value indicates that NE2 is closer than NE1 to Taforalt. We consistently find positive f4 values when the NE2 group is Natufian or Levant_N and the NE1 group is representative of other populations [z score = 2.2 to 11.0 standard error (SE); table S6]. Congruent to the outgtoup-f3 results, the Natufian population shows higher affinity to Taforalt than does the Levant_N group (z score = 2.2 SE; table S6). This indicates that the early Holocene Levantine populations, overlapping with or postdating our Taforalt individuals by up to 6000 years (16), are most closely related to the Taforalt group, among Near Eastern populations. Next, we evaluated whether the Taforalt individuals have sub-Saharan African ancestry by calculating f4(Chimpanzee, X; Natufian, Taforalt). We observe significant positive f4 values for all sub-Saharan African groups and significant negative values for all Eurasian populations, supporting a substantial contribution from sub-Saharan Africa (Fig. 3B). West Africans, such as Mende and Yoruba, most strongly pull out the sub-Saharan African ancestry in Taforalt (Fig. 3B and figs. S15 and S16). Science 04 May 2018: Vol. 360, Issue 6388, pp. 548-552 DOI: 10.1126/science.aar8380 Supplementary Materials www.sciencemag.org/content/360/6388/548/suppl/DC1 |
|
|
|
Post by Admin on Sept 5, 2020 4:22:49 GMT
 Fig. 3 Geographic distribution of the genetic affinity of the Taforalt group with worldwide populations. (A) Mean shared genetic drift with the Taforalt group, as measured by outgroup f3 statistics in the form f3(Taforalt, X; Mbuti). Warm colors denote populations genetically close to Taforalt. Large diamonds and squares represent the 10 highest and lowest f3 values, respectively. Early Holocene Levantine groups (Natufians and Neolithic Levantines) show the highest affinity with Taforalt. The statistics and their associated SEs for the top 30 signals are presented in fig. S14. (B) Extra genetic affinity with the Taforalt group in comparison to Natufians, as measured by f4 statistics in the form f4(Chimpanzee, X; Natufian, Taforalt). Large diamonds and squares represent the 10 most positive and negative f4 values, respectively. Sub-Saharan Africans show high positive values, with West African Yoruba and Mende having the highest values, supporting the presence of sub-Saharan African ancestry in Taforalt individuals. In contrast, all Eurasian populations are genetically closer to Natufians than to the Taforalt group. The statistics and their associated SEs for the top 30 signals are presented in fig. S16. We investigated whether two first-hand proxies, Natufians and West Africans, are sufficient to explain the Taforalt gene pool or whether a more complex admixture model is required. We thus tested whether Natufians could be a sufficient proxy for the Eurasian ancestry in Taforalt without explicit modeling of its African ancestry (fig. S18). This line of investigation was inspired by proposed archaeological connections between the Iberomaurusian and Upper Paleolithic cultures in Southern Europe, either via the Strait of Gibraltar (19) or Sicily (20). If this connection is true, both the Upper Paleolithic European and Natufian ancestries will be required to explain the Taforalt gene pool. For our admixture modeling with the program qpAdm (16), we chose outgroups that can distinguish sub-Saharan African, Natufian, and Paleolithic European ancestries but are blind to differences between sub-Saharan African lineages (11). A two-way admixture model, comprising Natufian and sub-Saharan African populations, does not significantly deviate from our data (χ2 P ≥ 0.128), with 63.5% Natufian and 36.5% sub-Saharan African ancestry, on average (table S8). Adding Paleolithic European lineages as a third source only marginally increased the model fit (χ2 P = 0.019 to 0.128; table S9). Consistently, by using the qpGraph package (21), we find that a mixture of Natufian and Yoruba reasonably fits the Taforalt gene pool (|z| ≤ 3.7; fig. S19 and table S10). Adding gene flow from Paleolithic Europeans does not improve the model fit and provides an ancestry contribution estimate of 0% (fig. S19). We thus find no evidence of gene flow from Paleolithic Europeans into Taforalt within the resolution of our data. We further characterized the sub-Saharan African–related ancestry in the Taforalt individuals by using f4 statistics in the form f4(Chimpanzee, African; Yoruba/Mende, Natufian). We find that Yoruba or Mende and Natufians are symmetrically related to two deeply divergent outgroups, an ancient South African group from 2000 yr B.P. (aSouthAfrica) and Mbuti Pygmy, respectively (|z| ≤ 1.564 SE; table S11). Because f4 statistics are linear under admixture, we expect the Taforalt population not to be any closer to these outgroups than Yoruba or Natufians if the two-way admixture model is correct. However, we find instead that the Taforalt group is significantly closer to both outgroups (aSouthAfrica and Mbuti) than any combination of Yoruba and Natufians (z ≥ 2.728 SE; Fig. 4). A similar pattern is observed for the East African outgroups Dinka, Mota, and Hadza (table S11 and fig. S20). These results can only be explained by Taforalt harboring an ancestry that contains additional affinity with South, East, and Central African outgroups. None of the present-day or ancient Holocene African groups serve as a good proxy for this unknown ancestry, because adding them as the third source is still insufficient to match the model to the Taforalt gene pool (table S12 and fig. S21). However, we can exclude any branch in human genetic diversity more basal than the deepest known one represented by aSouthAfrica (4) as the source of this signal: it would result in a negative affinity to aSouthAfrica, not a positive one as we find (Fig. 4). Both an unknown archaic hominin and the recently proposed deep West African lineage (4) belong to this category and therefore cannot explain the Taforalt gene pool.  Fig. 4 Relative genetic affinity of representative sub-Saharan African groups to a mixture of Yoruba and Natufians in comparison to the Taforalt group. We measured f4 statistics in the form f4(Chimpanzee, African; Yoruba+Natufian, Taforalt) by using (A) aSouthAfrica, (B) Mbuti, and (C) Hadza as the African group. The f4 statistics were calculated for the proportions of Natufian-related ancestry ranging from 0 to 100% in increments of 1%. The blue rectangle marks a plausible range of Natufian ancestry proportion, estimated by our qpAdm modeling [0.637 ± (2 × 0.069)]. Gray solid and dotted lines represent ±1 and −3 SE ranges, respectively. SEs were calculated by 5-centimorgan block jackknife method. Mitochondrial consensus sequences of the Taforalt individuals belong to the U6a (six individuals) and M1b (one individual) haplogroups (15), which are mostly confined to present-day populations in North and East Africa (7). U6 and M1 have been proposed as markers for autochthonous Maghreb ancestry, which might have been originally introduced into this region by a back-to-Africa migration from West Asia (6, 7). The occurrence of both haplogroups in the Taforalt individuals proves their pre-Holocene presence in the Maghreb. We used the BEAST v1.8.1 package (24) to analyze the seven ancient Taforalt individuals in combination with four Upper Paleolithic European mtDNA genomes (22, 23) and present-day individuals belonging to U6 and M1 (7). By using a human mtDNA mutation rate inferred from tip calibration of ancient mtDNA genomes (23), we obtained divergence estimates for U6 at 37,000 yr B.P. (40,000 to 34,000 yr B.P. for 95% highest posterior density, HPD) and M1 at 24,000 yr B.P. (95% HPD: 29,000 to 20,000 yr B.P.) (table S15). Our estimated dates are considerably more recent than those of a study using present-day data only (45,000 ± 7000 yr B.P. for U6 and 37,000 ± 7000 yr B.P. for M1) (7) but are similar to those of Pennarun et al. (25). Moreover, we observed an asynchronous increase in the effective population size for U6 and M1 (fig. S24), which suggests that the demographic histories of these North and East African haplogroups do not coincide and might have been influenced by multiple expansions in the Late Pleistocene (25). Notably, the diversification of haplogroups U6a and M1 found for Taforalt is dated to ~24,000 yr B.P. (fig. S23), which is close in time to the earliest known appearance of the Iberomaurusian culture in Northwest Africa [25,845 to 25,270 cal. yr B.P. at Tamar Hat (26)]. The relationships of the Iberomaurusian culture with those of the preceding Middle Stone Age, including the local backed bladelet technologies in Northeast Africa, and the Epigravettian in Southern Europe have been questioned (13). The genetic profile of Taforalt suggests substantial Natufian-related and sub-Saharan African–related ancestries (63.5 and 36.5%, respectively) but not additional ancestry from Epigravettian or other Upper Paleolithic European populations. Therefore, we provide genomic evidence for a Late Pleistocene connection between North Africa and the Near East, predating the Neolithic transition by at least four millennia, while rejecting the hypothesis of a potential Epigravettian gene flow from Southern Europe into northern Africa, within the resolution of our data. Archaeogenetic studies on additional Iberomaurusian sites will be critical to evaluate the representativeness of Taforalt for the Iberomaurusian gene pool. We speculate that the Natufian-related ancestral population may have been widespread across North Africa and the Near East, associated with microlithic backed bladelet technologies that started to spread out in this area by at least 25,000 yr B.P. [(10) and references therein]. However, given the absence of ancient genomic data from a similar time frame for this broader area, the epicenter of expansion, if any, for this ancestral population remains unknown. Although the oldest Iberomaurusian microlithic bladelet technologies are found earlier in the Maghreb than their equivalents in northeastern Africa (Cyrenaica) and the earliest Natufian in the Levant, the complex sub-Saharan ancestry in Taforalt makes our individuals an unlikely proxy for the ancestral population of later Natufians who do not harbor sub-Saharan ancestry. An epicenter in the Maghreb is plausible only if the sub-Saharan African admixture into Taforalt either postdated the expansion into the Levant or was a locally confined phenomenon. Alternatively, placing the epicenter in Cyrenaica or the Levant requires an additional explanation for the observed archaeological chronology. |
|

