|
|
Post by Admin on Jan 11, 2020 7:27:44 GMT
 A study published on Friday, January 10 in PLOS ONE now shows for the first time what effect this inconspicuous deviation had in the prehistoric past. A Slovak-German research team has investigated the alignment of early Neolithic houses in Central and Eastern Europe. Scientists from Kiel University (CAU) and the Slovakian Academy of Sciences were able to prove that the orientation of newly built houses deviated by a small amount from that of existing buildings, and that this deviation was regularly counterclockwise. Archaeologist Dr. Nils Müller-Scheeßel, who coordinated the study, says, "Researchers have long assumed that early Neolithic houses stood for about a generation, i.e., 30 to 40 years, and that new houses had to be built next to existing ones at regular intervals. By means of age determination using the radiocarbon method, we can now show that the new construction was associated with a barely perceptible rotation of the house axis counterclockwise. We see pseudoneglect as the most likely cause of this." 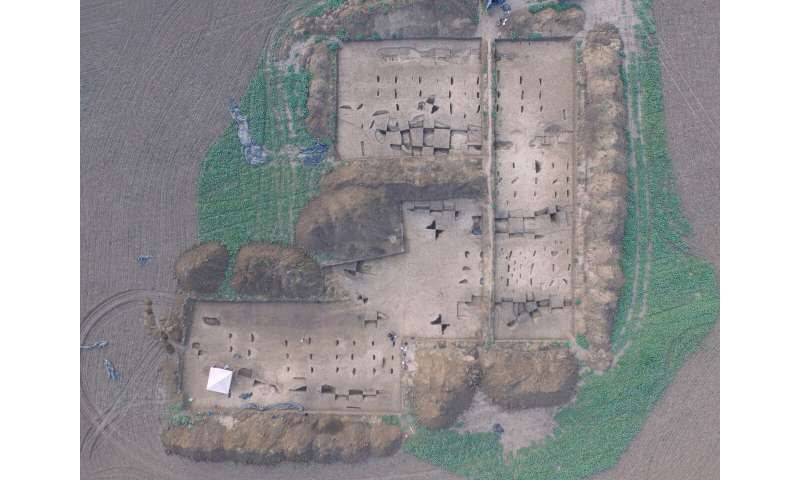 This insight was made possible by the interpretation of one of the fastest-growing archaeological data sets at present, namely the results of geophysical magnetic measurements. Differences in the Earth's magnetic field are used to visualise archaeological features lying underground. Early Neolithic house ground plans belong to the best identifiable types of features. "In recent years, we have discovered hundreds of Early Neolithic houses in our field of work in southwestern Slovakia using geophysical prospection methods. Excavating all these houses is neither possible nor desirable for reasons of monument conservation. The possibility of using pseudoneglect to bring the houses into a relative sequence without excavation and thus to break down the settlement activity of an entire small region raises our research to a completely new level," says Müller-Scheeßel. "Absolute dating using scientific methods must, of course, confirm the basic trend in every case." 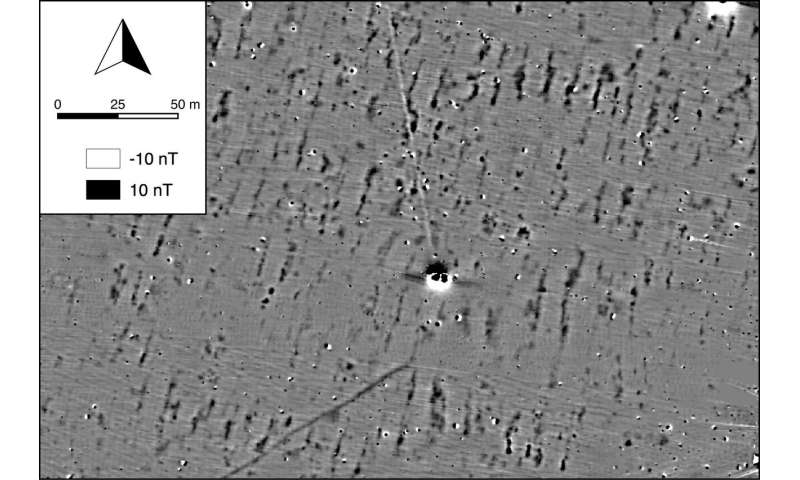 The study also refers to comparable archaeological observations at other places and times, which show that similar changes in orientation also seem to apply to more recent prehistoric periods. The significance of pseudoneglect thus extends far beyond the dating of early Neolithic houses. Müller-Scheeßel N, Müller J, Cheben I, Mainusch W, Rassmann K, Rabbel W, et al. (2020) A new approach to the temporal significance of house orientations in European Early Neolithic settlements. PLoS ONE 15(1): e0226082. doi.org/10.1371/journal.pone.0226082 |
|
|
|
Post by Admin on Jan 11, 2020 19:10:36 GMT
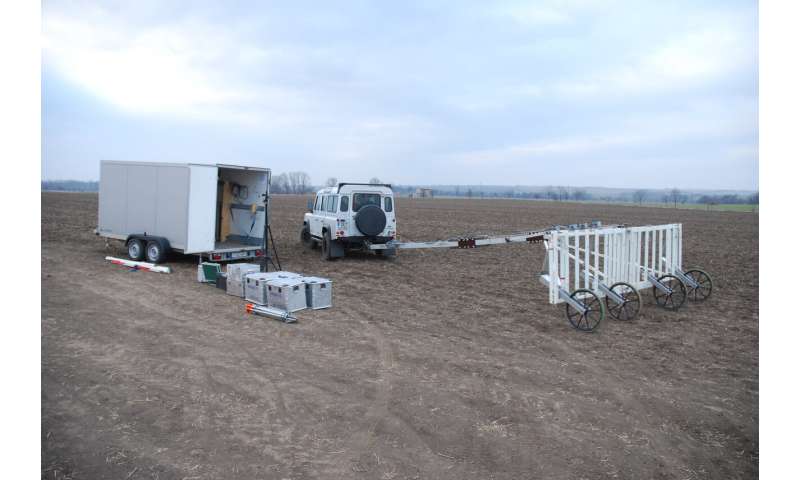
Introduction The onset of large-scale magnetic surveys during the last decade has offered completely new possibilities for the study of settlement systems. Within European archaeology, among others, this is especially relevant for the reconstruction of Chalcolithic mega-settlements of eastern Europe [1], Neolithic enclosures all over Europe [2], and also settlements of the earliest Neolithic group in Central Europe, the so-called Linearbandkeramik (LBK) (e. g., [3, 4]).  Fig 1. Terrain map of Slovakia and surrounding region, showing the location of Vráble 'Véľke Lehemby' and the Žitava-valley. Using excavation results and Bayesian dating and combining this chronological information with magnetic plans, we propose that it is possible to make substantial claims about the settlement history of a whole region without the need to excavate large areas. As Bayesian 14C-calibration shows that the orientation of houses follows a chronological order, orientation can be used as a proxy for the chronological order of houses. We see the change in orientation as the concrete outcome of a neurobiological phenomenon, pseudoneglect, which hitherto has been attested only in laboratory studies. The pseudoneglect hypothesis is relevant where there are no other stronger constrains influencing building activities (topography, circular arrangement of houses, proximity of houses, but also social factors like overarching authorities, etc.). Our study takes the so-called Linearbandkeramik as example, which is inextricably linked with the onset of Neolithic lifeways in Central Europe at around 5300 cal BCE. What sets LBK settlements apart from any other archaeological culture, is their use of very characteristic long houses. These are massive buildings of lengths of 30 meters and more, the roof supported by solid posts of oak, always set in cross-rows of three. Additionally, the houses are uniquely marked by long clay extraction and refuse pits at each side. These characteristics make LBK settlements and houses easily identifiable within magnetic surveys and an ideal test-case for our approach. Especially huge rescue excavations like that on the Aldenhovener Platte have pioneered large-scale settlement studies in terms of settlement systems and networks of the LBK. They are, however, mostly still based on typochronological instead of scientific dating methods [5, 6], as the excavations were already done before the main 14C-boom in archaeology. In other cases, larger geophysical surveys combined with small-scale excavations have produced important insights into the general layout of LBK houses and settlements [7, 8]. Nevertheless, without the extremely time-consuming large-scale excavations such as those carried out on the Aldenhovener Platte, the understanding of the diachronic developments of the settlements are necessarily much coarser (e. g., [9] for the Wetterau in Central Germany). Therefore, we propose a new approach to understanding the chronological development of large-scale settlements without extensive excavation: dating by house orientation. The idea that house orientation holds significance has been around for a long time in LBK research, but the discussion of regional differences in orientation always trumped considerations of variance in house orientation at individual sites (for an overview of approaches to orientation of LBK houses see [10], 529ff.). It is, however, at the local, site-specific level that house orientation can be used for relative chronological dating. Therefore, we are not interested in the differences in orientation of houses between, say, Slovakia and the Alsace, but only in those differences per site or per micro-region. E. Sangmeister ([11], 91ff.) was the first to point out the variation in house orientation within the same settlement. Taking the settlement of Köln-Lindenthal as an example, he grouped the houses into seven classes of the same orientation (within 2–3°) and postulated the contemporaneity of houses within these groups. Apart from the similar orientation, the fact that all houses of each group were found across the whole settlement was, in his eyes, a very strong argument. He assumed that the settlements were temporarily abandoned and, when resettled, the houses were built with a slightly different orientation ([11, 12], 454). Despite the fact that he found similar patterns in other settlements, his suggestion was never adopted and later was even refuted on the grounds of overlapping houses with the same orientation ([13], 224f.) or ceramic typology ([14], 106). However, taking magnetic prospections in southwest Slovakia as point of departure, we will show that the findings of Sangmeister should have been taken more seriously. During our fieldwork in Vráble we conducted a comprehensive dating program and thus produced a dataset that is large enough to compare orientation and dating of houses in detail. A comparison of these two measures proves their correlation and the testing of this dating method at other sites suggests that orientation could play a key-role in deciphering the development of large-scale settlements as referred to above. Under certain conditions orientation could serve as a proxy for relative chronology, and in addition, when combined with small-scale excavations for 14C-dating can also be integrated into the absolute chronology of a specific site.  Fig 2. The Žitava-valley with the LBK sites with magnetic imagery. 1 Sľažany 'Na Domovine'; 2 Čierne Kľačany 'Mlynské diely'; 3 Nevidzany 'Konopiská'; 4 Horný Ohaj 'Dolne siatie'; 5 Čifare 'Kapustniská'; 6 Telince 'Horné lúky'; 7 Vráble 'Véľke Lehemby'; 8 Vráble 'Drakovo'; 9 Maňa 'Za hlbokou cestou'; 10 Vlkas 'Do hulského chotára'; 11 Úľany nad Zitavou 'Dolné diely’. Excavations were carried out in the three settlements of Vráble (Fig 3) uncovering a total of 15 houses. The ceramic material unanimously date these houses to the youngest LBK, which is also supported by the 99 14C-dates obtained. A large number of additional 14C-dates from nine other houses was gained by a targeted coring program [21]. Our excavations in the Žitava-valley have shown (like in other cases, cf. [8]) that the agreement between the excavated features and the magnetic picture is very high [22, 23]). Because LBK houses are unique and easily identified by their characteristic long pits bracketing the long sides of the house, it seems permissible to reconstruct the number and placement of houses on the basis of the magnetic measurement. Therewith, size and orientation of houses can also be reasonably determined. This methodology has successfully also been applied elsewhere on LBK settlements (e. g. [3], 83 Fig 7). It is likely that the actual number of houses in ancient times was higher than is estimated by this method. In some instances, long pits might have already eroded away, in others they might not be filled by significant amounts of material with high magnetic susceptibility. Finally there might be such a large degree of overlap between adjacent house pits that they are no longer distinguishable in the magnetic picture. All of these factors lead to an underestimation of house numbers, never to an overestimation. For the present context it is especially important that the orientation of houses is not be affected by these possible taphonomic processes. Currently it is not possible to reliably identify archaeological features in magnetic plans automatically (for a semi-automatic approach see [24]). This is due to the very low magnitude of signal of the features on the one hand, and the still greater variability of the signal on the other. Automatic classification thus leads either to the marking of only the most distinctive features or virtually the whole area, depending on the chosen sensitivity.  Fig 3. The site plan of Vráble 'Véľke Lehemby' derived from magnetic images with three distinct LBK settlements with excavation trenches and dated houses. Therefore, it seemed more fruitful to perform an expert identification of features focusing first on delimiting the long pits and successively on the houses. For that purpose a polygon was drawn between two long pits seemingly belonging together based on orientation, position and length. This was done for each site by three of the authors (M. F., W. M., N. M.-S.) independently. Houses were only accepted which were identified by at least two of the authors, i.e. where the area of overlap between polygons drawn by different researchers was equal to at least half of the area of the largest polygon. In order to avoid human measurement errors, the orientation of individual houses was calculated automatically. The orientation was determined by taking the average of the orientation of the long sides of each house as expressed by the reconstructed polygons (minimum number of long sides = 4 as at least two polygons identified by two experts per house). In this way, it is also possible to estimate the standard deviation of orientation for each house. As it is normally not possible to identify an unequivocal single direction for houses, we reported orientations by their degree closest to true north. Thus, orientations range from 270° (west–east) over 360°/0° (north–south) to 89.9° (eastnortheast–westsouthwest). According to this system, values between 90° and 269.9° cannot occur. |
|
|
|
Post by Admin on Jan 12, 2020 2:34:22 GMT
Results Identification of houses As the result of the expert identification, a total of 581 anomalies in 13 sites were identified as LBK longhouses (Table 1). There are differences between the sites: While ground plans identified by only two of the three experts predominate at most sites, the expert identifications are more unanimous at some settlements. This applies in particular to the sites Čierne Kľačany and Úľany nad Zitavou. Vráble is also dominated by houses where all three experts agree. The degree of agreement is likely an indication of the state of preservation and thus the clarity of the magnetic anomalies, or could possibly also reflect building density as with overlapping houses the chance that the same long pit is assigned to different houses by the experts rises.  Table 1. The LBK-sites in the Žitava-valley with descriptive statistics on sizes and number of houses. Orientation of houses Within the Upper Žitava Valley the orientation of the houses is relatively uniform. The average orientation is 18.0° with 0.0407 circular variance. Nevertheless, the range of measured degrees covers more than one eighth of a full circle (> 45°) and includes orientations between 355.6° and 44.2°. If the data are broken down to settlement level, there are also clear differences. The mean values for each settlement range between 8.2° and 25.8°. Within the settlement cluster of Vráble the differences are very limited: the average orientations are 15.2°, 16.3° and 18.0° for the northern, southwestern, and southeastern settlement respectively. The average distance between house centroids of the settlements ranges between 16.0 and 40.0 m, signaling differences in building densities. In relation to the difference in orientation between neighboring houses, an interesting negative correlation surfaces (Fig 4): It seems that with higher distances between nearest neighbors, the differences in average orientation decrease. Likewise, higher density equals stronger differences in orientation.This means that with a larger distance between houses (equaling a lower density of the settlement layout), the variability of house orientation decreases.  Fig 4. Regression line with 95%-confidence interval of arithmetic mean of distances and circular mean difference of orientation between nearest neighbors/houses (only settlements with magnetic measurements of areas of 5+ha). doi.org/10.1371/journal.pone.0226082.g004Furthermore, we see that houses with similar orientations are spaced at regular intervals (Fig 5). The maxima of kernel density estimates for the distances of houses showing a difference in orientation of 4° or less peak at distances of around 75 and 150 m, distances which are much higher than that to the nearest neighbor.  Fig 5. Kernel density estimation (Gaussian Kernel, bandwidth = 15 m) of the maxima of the distances between houses with similar orientation (difference < = 4°) (n = 10; only settlements with magnetic measurements of areas of 5+ha). Dating of houses at Vráble In the Bayesian model of 14C dates from Vráble presented by [21], the occupation of the settlement cluster is dated to ca. 5250–4950 BCE and the duration of house use is on average 40 years. House orientation was not part of the modeling process. Therefore, it is far from self-evident that we find a correlation between the modeled first dates (represented by their weighted mean) and the orientation of the respective houses (Fig 6). For the three settlement parts treated as a whole, the correlation-coefficient r is only moderately strong (0.30). Remarkably, it is much higher when looking at the individual settlement. Generally, the correlations between the first dates and orientation are high for the southwestern and northern settlements (0.94 and 0.84 respectively), while in the southeastern settlement, the correlation is relatively loose (0.48). This can, however, be explained by the fact that in the last settlement an exceptional group of houses was selected for excavation: a group of four houses standing so close together that we initially expected a contemporary house cluster. Through excavation, we could demonstrate that this group of houses actually represents a time-depth of 200 years (5200–5000 BCE). The unusually close proximity of these houses prevented the deviation in house orientation over time that we can observe in the other areas of the settlement.  Fig 6. Relationship between the modeled first dates (represented by their weighted mean) and the orientation of the respective house of Vráble. Regression line with 95%-confidence intervals for Vráble as a whole and each of its three settlements (see text). Testing the correlation: Diachronic change in house orientation across LBK Europe A tendency of older houses towards a more northerly direction and of younger houses towards a more north-western orientation–i.e. a leftward shift in orientation–was also observed in the Merzbachtal in western Germany ([30], 925 with fig 741). Despite the fact that E. Mattheußer ([31], 10) argued that there is no general tendency in changing house orientation over time, her own data tells a different story (Fig 7A). While houses of older phases show an average orientation of about 325°, later houses are clearly oriented more to the west (the regression line ending at 308°). Across the 13 phases of an assumed length of 25 years each [32], this equals 5° over 100 years, 1° every 19 years, or 1.3° from phase to phase (see regression equation).  Fig 7. Orientation and building phases of houses in the Rhineland. a „Aldenhovener Platte”and „Hambacher Forst”(n = 128; mean orientation and standard deviation data after [31], 10 Abb. 10); b Erkelenz-Kückhoven (n = 26; data after [33]). Regression lines with 95%-confidence intervals. The same tendency is also well observable for the large settlement of Erkelenz-Kückhoven (Fig 7B). 26 houses are datable according to [33]. Grouped by phases, the average orientation shows a very high correlation with age. The oldest houses have a westward orientation of around 20° west from true North (= 340°), the youngest houses deviate to about 35° west from North (= 325°). During 11 phases, each lasting ca. 25 years (i.e. 275 years in total), the orientation of the houses thus shifted on average 15°. This equates with a deviation of 5° over 100 years, 1° every 18 years, or 1.6° from phase to phase (see regression equation). In eastern France, in Alsace, a change in house orientation was observed in several settlements [34–36]. The phasing of the houses is based on a thorough ceramic sequence that was used for Bayesian modeling of high quality 14C-dates [37]. In Bischoffsheim, houses which are attributed to the oldest phase have orientations between 283° and 335°, with the majority oriented between 300° and 320°. The houses of the middle phase show directions between 290° and 305°. Finally, the latest houses face 290° ([36], 23f. with Fig 7). Another local region where a change in orientation was observed is the area north of the Harz Mountains ([38], 172; 176). While the oldest houses are oriented north-south, the younger ones are directed northwest-southeast. Taking the data from this sample of well-researched micro-regions together– Alsace, Merzbach valley, northern Harz, and southwest Slovakia– there can be little doubt that there is a temporal shift in house orientation to be found on a local scale across the LBK. In all cases this shift is counter-clockwise, whether from an original northeast more towards true north or from an original northwest towards west. |
|
|
|
Post by Admin on Jan 12, 2020 5:54:47 GMT
Discussion House orientation as a measure of time In our view, these findings can most plausibly be explained with as a slow, continuous process of a uni-directional change of orientation through time. An increasing number of house plans over the course of the settlement histories leads to decreasing distances between neighboring houses. Apparently an increase in the overall variability in orientation accompanies this process. The duration of a settlement’s occupation, the density of houses within it, and the variability of orientation of houses seem to be connected. The fact that higher density of buildings is linked to increasingly deviating orientations between immediate neighbors implies that houses were usually not built very close to older houses, otherwise we would expect a closer alignment between the older and younger houses. The fact that houses with similar orientations are found at regular intervals of 75 and 150 m is in our view a clear argument for the existence of house wards („Hofplatzmodell“) as has been argued in the past [39]. With a distance of 75 m (taking the value of 150 m as the double of the regular distance; for the methodology see [40]) between contemporary houses, such a house ward would have encompassed roughly 0.5 ha. The buildings of one house ward were erected over time within this circumscribed area of 0.5 ha, resulting in the emergence of the described pattern as the buildings’ show more and more changes in their orientation. The regression analysis of orientation and age at Vráble reveals that orientation shifted on average by between 0.03° (southeastern settlement), 0.13° (southwestern settlement) and 0.18° (northern settlement) per year or between 3°, 13° and 18° in 100 years. For the Vráble settlement as a whole the change amounts to 0.05° per year or 5° in 100 years. The most reliable value can be attributed to the southwestern settlement as here, as already emphasized above, we have the best coverage. The fact that Bayesian 14C-modeling implies a broad co-existence of the three settlements [21] correlates with the observation of very similar means of the orientation of houses (see above). Therefore, we argue that the differences in the regression analyses of the three settlements are due to uneven sampling and do not reflect fundamental different principles in orientating houses. If we interpret the differing orientation as a proxy for the individual dating of houses, the spatial development of the settlement can be reconstructed both in time intervals and as a steady process. Consequently, interesting conclusions regarding the history of the southwestern settlement can be drawn (Fig 8). Firstly, there is no clear spatial pattern visible concerning a possible direction of settlement development, say, from north to south or east to west. Already at the beginning of occupation, in the first phases, houses seem to cover almost the entire 14 ha area. This implies, secondly, that already at the very beginning of the settlement, the final size it would reach was implicitly or explicitly determined. This is not unlikely given that all three settlements in Vráble have the same size and shape. The only obvious exception is the northeastern-most part of the southwestern settlement where only houses with orientations less than or equal to 20° appear. Already judging by the settlement layout it was suspected that this appendix-like part of the settlement might be somewhat younger that the rest. The fact that the ditches, however, encircle even this appendix can be taken as a hint that the ditch system was erected only in the second half of the existence of Vráble, or even towards its end. Finally, after a modest beginning in the first two phases of occupation (c. 5275–5225 BCE), the settlement remains at a densely populated level with 10 houses or more, and with even more than 20 houses in the phases representing orientations of </ = 20° and </ = 16 (c. 5150–5100 BCE).  Fig 8. Orientation of houses of the southwestern settlement of Vráble in steps of 4°. doi.org/10.1371/journal.pone.0226082.g008Change in orientation in the Žitava valley Mapping the 4°-interval (roughly equalling phases of 40 years and thus the length of the occupation of individual houses [see above] between 5275–4950 BCE) for all magnetically prospected settlements of the Žitava-valley, we can model a chronological sequence in which a process of settlement concentration within this micro-region emerges (Figs 9 and 10).  Fig 9. Orientation of houses of the LBK-settlements of the Žitava-valley in steps of 4°.  Fig 10. Hypothetical settlement development in the Žitava-valley based on house orientations and compared to KDE-modeled 14C-dates (function „KDE_plot”of OxCal 4.3). doi.org/10.1371/journal.pone.0226082.g010While the settlement of Vráble is–apart from Úľany–the only settlement that is present on all maps, it seems to have reached a remarkable position in terms of size only after approximately 100 years (orientation </ = 24°, c. 5175 BCE). However, from then onwards it is the only settlement with more than 30 contemporary houses. This is especially clear in the last phases (orientation </ = 8°, ca. 5025–4950 BCE) where in most other sites of the Žitava valley LBK-settlement seems to have ceased completely. The interpretation of the magnetic prospections thus underlines the special status of Vráble probably as a central site, comparable for example to Langweiler 8 in the well-researched Merzbachtal [41]. However, it seems to have gained this prominent position only towards the end of the local LBK and at the expense of other settlements’ existence. In consequence, we are able to detect an agglomeration process of the local population. The maps imply that the Žitava valley was already fully settled when the settlements represented by magnetic plans were founded. Assuming a steady change in orientation, the houses depicted in the magnetic imagery can be hypothetically pin-pointed mainly to a duration of 300 years and the time-range 5250–4950 calBC. According to14C-dates, the change from the so-called younger LBK (Notenkopfkeramik) to the Želiezovce-group, the youngest variant of local LBK, happened around 5200 calBC [21]. Therefore, some of the identified houses should belong to the Notenkopfkeramik phase. This is in accordance with ceramic surface finds which imply that older LBK settlements already reached even remote parts of the Upper Žitava valley and its tributaries ([42], 205 map 4 no. 36.59). Explanation: Pseudoneglect The supra-regional differences and tendencies in orientation across the LBK world have been the topic of intensive discussions in the past and have been explained with a wide variety of theories (climate/dominating wind directions: [43]; home of the ancestors: [44]; exposure to the sun: [10]). Astonishingly, the variability of house orientation within individual settlements was never investigated in more detail. As mentioned above, the suggestion by Sangmeister that variability in orientation could be due to chronological differences was never seriously considered or even explicitly refuted (see above). As we have shown, there is in fact a directed shift in orientation over time. However, this shift is so small that it seems very unlikely that the inhabitants of the houses and settlements would realistically have been aware of it. When we consider the maximum life-span of an LBK house of 25–50 years (although there are scholars who maintain that these houses can last up to 100 years) [45]), the average difference of house orientations in adjacent phases would be 3–5°. This is barely perceptible when looking at a ground plan from above and would be virtually impossible to detect from the ground. It seems very unlikely that contemporary inhabitants of the settlements would have any chance to notice the difference. As a corollary, we highly suspect that the change in orientation happened unconsciously and therefore not deliberately. We do not see any celestial body that could be held accountable for this phenomenon, as the starting orientations in the different areas of the LBK were very different. Moreover, similar processes were also observed in completely different archaeological contexts, e. g. in Iron Age houses ([46], 14–17) or Iron Age burials ([47]; here–perhaps erroneously–explained with the precession of the stars in the sky, though). Therefore, it seems most probable that a certain inclination in human perception lead to such a shift in the long-term. Pseudoneglect could be the source of such an inclination. This term refers to the fact that neurologically healthy individuals typically privilege the left side of space (they „neglect”the right side) and hence bisect a horizontal line to the left of its veridical center (see [48] for an extensive meta-study). Accepting this explanation, it can be argued that humans faced with the task of erecting a new house at a certain distance from other houses and with the firm determination to align it exactly with these older houses, would, in the absence of devices for exact measurements, most certainly misperceive the intended orientation. Pseudoneglect would lead to a non-random deviation of the aimed-at orientation; the accomplished orientation would on average lie somewhat to the left of the true orientation which in the long run would translate into a counter-clockwise rotation of houses. Differing from the original formulation by Sangmeister [11], we do not claim that the change in orientation of houses is due to a complete abandonment and resettling of a certain settlement with a new orientation, but that the change happened on a continuous and constant basis, where individual house wards rebuilt their houses in a slightly and barely perceptible progressively counter-clockwise altered orientation due to pseudoneglect. Caveats: Close proximity of houses For the settlement Langweiler 8, it was considered that not contemporaneity, but the spatial proximity of houses was the primary reason for a similar orientation ([30], 925). However, Mattheußer ([31], 16) could show that the orientation of a specific house is not tied to that of the Nearest Neighbor (see also above). On the other hand, in those cases where groups of similar alignments exist, she speculates that sometimes new houses were built so close to older houses that they were forced to follow their orientations, causing alignment. As a result, the temporal differences would be blurred by spatial proximity. Exactly such a case was encountered in Vráble in the 2016 excavation area. There, the magnetic picture seemed to imply three houses standing very close to each other with the same orientation (houses 131, 132, 133). As working hypothesis this situation was interpreted as a quarter and as perhaps a particularly well preserved example of a row-like arrangement of houses. However, during excavation it turned out that the houses were not contemporaneous, and that parts of their long pits stratigraphically intersect [23]. Not surprisingly, the raw and modeled 14C-dates mirror this time-depth [21]. Therefore, some of the houses from the 2016 excavation area are not in concordance with the orientation = dating hypothesis (Fig 6). However, such cases should be conceived as cautionary tales rather than grounds on which to abandon the hypothesis altogether. Müller-Scheeßel N, Müller J, Cheben I, Mainusch W, Rassmann K, Rabbel W, et al. (2020) A new approach to the temporal significance of house orientations in European Early Neolithic settlements. PLoS ONE 15(1): e0226082. |
|
|
|
Post by Admin on Jan 12, 2020 21:08:47 GMT
It is well established that farming was introduced to Europe from Anatolia, but the extent to which its spread was mediated by demic expansion of Anatolian farmers, or by the transmission of farming technologies and lifeways to indigenous hunter-gatherers without a major concomitant migration of people, has been the subject of considerable debate. Paleogenetic studies (1⇓⇓–4) of late hunter-gatherers (HG) and early farmers indicate a dominant role for migration in the transition to farming in central and northern Europe, with evidence of only limited hunter-gatherer admixture into early Neolithic populations, but increasing toward the late Neolithic. However, the exact origin of central and western Europe’s early farmers in the Balkans, Greece, or Anatolia remains an open question. Recent radiocarbon dating indicates that by 6,600–6,500 calibrated (cal) BCE sedentary farming communities were established in northwestern Anatolia at sites such as Barcın, Menteşe, and Aktopraklık C and in coastal western Anatolia at sites such as Çukuriçi and Ulucak, but did not expand north or west of the Aegean for another several hundred years (5). All these sites show material culture affinities with the central and southwestern Anatolian Neolithic (6).
Table 1.
Neolithic and Mesolithic samples analyzed

Site	Culture	Sample	Age (cal BCE, 95.4% calibrated range)	Genomic coverage (mean ± SD)	Contamination estimate (mt)	Sex	mtDNA haplogroup	Y haplogroup
Theopetra	Mesolithic	Theo5	7,605–7,529	—	1.84–6.71	—	K1c	—
Theopetra	Mesolithic	Theo1	7,288–6,771	—	0.05–3.8	—	K1c	—
Revenia	Early Neolithic	Rev5	6,438–6,264	1.16 ± 0.73	0.006–0.628	XX	X2b	*
Barcın	Early Neolithic	Bar31	6,419–6,238	3.66 ± 2.04	0.006–0.628	XY	X2m	G2a2b
Barcın	Early Neolithic	Bar8	6,212–6,030	7.13 ± 4.56	0.744–1.619	XX	K1a2	*
Paliambela	Late Neolithic	Pal7	4,452–4,350	1.28 ± 1.01	0.006–0.772	XX	J1c1	*
Kleitos	Final Neolithic	Klei10	4,230–3,995	2.01 ± 2.2	0.363–1.772	XY	K1a2	G2a2a1b
Dates calibrated using Oxcal v4.2.2 and the Intcal13 calibration curve. For details on 14C dating and location of the sites (Fig. 1), see SI Appendix, SI1. Archaeological Background. Contamination was estimated on mitochondrial (mt) DNA. —, indicates no genomic data available; *, indicates not applicable.
Early Greek Neolithic sites, such as the Franchthi Cave in the Peloponnese, Knossos in Crete, and Mauropigi, Paliambela, and Revenia in northern Greece date to a similar period (7⇓–9). The distribution of obsidian from the Cycladic islands, as well as similarities in material culture, suggest extensive interactions since the Mesolithic and a coeval Neolithic on both sides of the Aegean (8). Although it has been argued that in situ Aegean Mesolithic hunter-gatherers played a major role in the “Neolithization” of Greece (7), the presence of domesticated forms of plants and animals indicates nonlocal Neolithic dispersals into the area. We present five ancient genomes from both, the European and Asian sides of the northern Aegean (Fig. 1); despite their origin from nontemperate regions, three of them were sequenced to relatively high coverage (∼2–7×), enabling diploid calls using a novel SNP calling method that accurately accounts for postmortem damage (SI Appendix, SI5. Genotype Calling for Ancient DNA). Two of the higher-coverage genomes are from Barcın, south of the Marmara Sea in Turkey, one of the earliest Neolithic sites in northwestern Anatolia (individuals Bar8 and Bar31). On the European side of the Aegean, one genome is from the early Neolithic site of Revenia (Rev5), and the remaining two are from the late and final Neolithic sites of Paliambela (Pal7) and Kleitos (Klei10), dating to ∼2,000 y later (Table 1). Estimates of mitochondrial contamination were low (0.006–1.772% for shotgun data) (Table 1; SI Appendix, SI4. Analysis of Uniparental Markers and X Chromosome Contamination Estimates.). We found unprecedented deamination rates of up to 56% in petrous bone samples, indicating a prehistoric origin for our sequence data from nontemperate environments (SI Appendix, Table S5).  Fig. 1. North Aegean archaeological sites investigated in Turkey and Greece. Uniparental Genetic Systems The mtDNA haplogroups of all five Neolithic individuals are typical of those found in central European Neolithic farmers and modern Europeans, but not in European Mesolithic hunter-gatherers (1). Likewise, the Y-chromosomes of the two male individuals belong to haplogroup G2a2, which has been observed in European Neolithic farmers (3, 10); in Ötzi, the Tyrolean Iceman (11); and in modern western and southwestern Eurasian populations, but not in any pre-Neolithic European hunter-gatherers (12). The mitochondrial haplogroups of two additional less well-preserved Greek Mesolithic individuals (Theo1, Theo5; SI Appendix, Table S6) belong to lineages observed in Neolithic farmers from across Europe; consistent with Aegean Neolithic populations, unlike central European Neolithic populations, being the direct descendants of the preceding Mesolithic peoples who inhabited broadly the same region. However, we caution against over-interpretation of the Aegean Mesolithic mtDNA data; additional genome-level data will be required to identify the Mesolithic source population(s) of the early Aegean farmers. Functional Variation Sequences in and around genes underlying the phenotypes hypothesized to have undergone positive selection in Europeans indicate that the Neolithic Aegeans were unlikely to have been lactase persistent but carried derived SLC24A5 rs1426654 and SLC45A2 rs16891982 alleles associated with reduced skin pigmentation. Because our Aegean samples predate the period when the rs4988235 T-allele associated with lactase persistence in Eurasia reached an appreciable frequency in Europe, around 4 kya (12⇓–14), and because this allele remains at relatively low frequencies (<0.15) in modern Greek, Turkish, and Sardinian populations (15), this observation is unsurprising. However, despite their relatively low latitude, four of the Aegean individuals are homozygous for the derived rs1426654 T-allele in the SLC24A5 gene, and four carry at least one copy of the derived rs16891982 G-allele in the SLC45A2 gene. This suggests that these reduced-pigmentation–associated alleles were at appreciable frequency in Neolithic Aegeans and that skin depigmentation was not solely a high-latitude phenomenon (SI Appendix, SI12. Functional Markers). The derived rs12913832 G-allele in the HERC2 domain of the OCA2 gene was heterozygous in one individual (Klei10), but all other Aegeans for whom the allelic state at this locus could be determined were homozygous for the ancestral allele, indicating a lack of iris depigmentation in these individuals. Examination of several SNPs in the TCF7L2 gene region indicates that the two Neolithic Anatolian individuals, Bar8 and Bar31, are likely to have carried at least one copy of a haplotype conferring reduced susceptibility to type 2 diabetes (T2D); the Klei10 and Rev5 individuals also carry a tag allele associated with this haplotype. Consistent with these observations, it has been previously estimated that this T2D-protective haplotype, which shows evidence for selection in Europeans, East Asians, and West Africans, originated ∼11,900 y ago in Europe (16). A number of loci associated with inflammatory disease displayed the derived alleles, including rs2188962 C > T in the SLC22A5/IRF1 region, associated with Crohn’s disease; rs3184504 C > T in the SH2B3/ATXN2 region, associated with rheumatoid arthritis, celiac disease, and type 1 diabetes; and rs6822844 G > T in the IL2/IL21 region, associated with rheumatoid arthritis, celiac disease, and ulcerative colitis. Interestingly, we observe derived states for six of eight loci in a protein–protein interaction network inferred to have undergone concerted positive selection 2.6–1.2 kya in Europeans (17), suggesting that any recent selection on these loci acted on standing variation present at already appreciable frequency (SI Appendix, SI12. Functional Markers). |
|

