|
|
Post by Admin on Jun 27, 2020 21:39:19 GMT
Massim genetic population substructure and the Kula Genetic distances between the Massim groups calculated from NRY and mtDNA haplogroup/haplotype data (Supplementary Table S6) were visualized in MDS plots (Figure 3). Wanigela appears as a strong outlier in both NRY-based plots, which can be explained by its exceptionally high frequency of haplogroup M-P34* and the complete lack of AS NRY haplogroups. Airara takes an outlier position only in the Y-STR-based plot, but not in the NRY-haplogroup-based plot, which can be explained by the fact that Airara's K-M9* Y-STR haplotypes are quite distinct from the K-M9* haplotypes in other Massim groups (Supplementary Figure S1). In contrast, neither Wanigela nor Airara are outliers in the mtDNA-based plots. Both groups come from the coast of mainland PNG (Collingwood Bay), on the border with the Massim area, and were included in this study because Goodenough, one of the islands in the western Massim, is visible from Collingwood Bay, and therefore people from Wanigela and Airara may be involved in admixture processes with the Massim. Moreover, archeology has revealed the presence of prehistoric pottery in the Trobriand Islands that originated from the Collingwood Bay61, 62 (modern pottery in the Trobriands comes mostly from the Amphlett Islands). Nearly all NO haplogroups found in the Massim are also found in the Collingwood Bay, hence our results do not exclude the possibility that the Massim have ancestral ties in the Collingwood Bay, in line with the archeological evidence. However, a pairwise haplotype-sharing analysis (Table 4) did not reveal increased haplotype sharing between the Collingwood groups and the nearest sampled group of Fergusson, nor the Trobriand Islanders, suggesting that genetic exchange between these groups was rather limited. The other genetic outlier particularly for Y-STR and mtDNA haplotypes (less so for NRY/mtDNA haplogroups) is Rossel (Figure 3) (for further details on Rossel see below). Figure 3 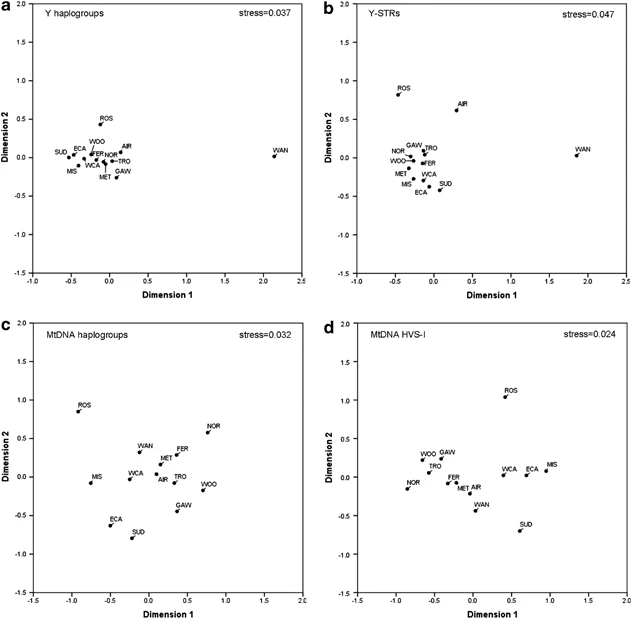 Apart from the outliers, the positioning of the sampled groups is in good agreement with geography. When we repeated the MDS analysis without the Airara, Wanigela and Rossel groups (Supplementary Figure S2), a strong north-south correlation with geography along the first dimension was seen in all four plots. Notably, Seligmann21 and Malinowksi33 had provisionally subdivided the Massim—on ethnographic grounds—into a northern and a southern portion. We considered and tested several alternative subdivisions by means of AMOVA, while leaving out Wanigela and Airara for the reason explained above (Supplementary Table S7). The grouping that explained the largest proportion of among-group variation for both NRY and mtDNA data was a division into three groups: (1) the western plus northern Massim, (2) the southeastern Massim excluding Rossel and (3) Rossel. This grouping explained 15.98% (P<0.001) of the among-group variation for mtDNA haplotypes, 14.78% (P<0.001) for mtDNA haplogroups, 10.18% (P<0.001) for Y-STR haplotypes and 7.91% (P<0.001) for NRY haplogroups. When performing an AMOVA with the whole Massim as one group (again excluding Wanigela and Airara), the among-populations percentage was 6.47% (P<0.001) for NRY haplogroups and 7.37% (P<0.001) for Y-STR haplotypes, whereas for mtDNA haplogroups and haplotypes this was 17.99% (P<0.001) and 18.33% (P<0.001), respectively. Although the Massim Y-STR value (7.37%) is lower than that obtained for the Admiralties (10.31%) and Solomons (ex-Polynesian outliers) (11.09%), the Massim mtDNA haplotype value (18.33%) is high compared with that of the Admiralties (12.3%) and Solomons (ex-Polynesian outliers) (13.1%) (Supplementary Table S8). This comparative result suggests that the Massim are more structured mtDNA-wise than NRY-wise, and more so than other regions of NO studied so far. We furthermore investigated the putative effect of the Kula trading system on genetic population substructure of the Massim. As the Kula trade occurs between islands in a circular manner in both clockwise and counter-clockwise direction depending on the objects traded, we modeled the Kula system as a ring of participating trading partners that can exchange goods with adjacent partners (Figure 1). Notably, however, not all Massim islands participate in the Kula. From the populations included in this study, the Calvados chain islands, Sudest and Rossel as well as the PNG mainland populations of Airara and Wanigela are not known to be involved in the Kula33 and were therefore excluded from the model. Furthermore, the Laughlan Islanders, who may be only marginally involved in the Kula,37 were excluded because of small sample size. Genetic distances appropriate for the marker type (Supplementary Table S6) were compared via Mantel testing with circular trading distances. For NRY (both at the haplogroup level and at the haplotype level) no statistically significant correlation was observed, whereas for mtDNA a significant correlation was observed both for haplotype data (0.42; P=0.029) and for haplogroup data (0.47; P=0.019). This result can be explained by predominantly male-mediated gene flow between islands involved in the Kula, having a homogenizing effect on the Y-chromosome diversity but not on the mtDNA pool. As only men traditionally participate in the Kula voyages, this finding may indicate a genetic signature of the Kula Ring. However, the mtDNA-based correlation decreased and became nonsignificant when excluding Misima, which is reported to be less intensively involved in the Kula.35, 38  Genetic characterization of Rossel Islanders Rossel Islanders, who live on the easternmost and most remote island of the entire Massim, occupy a unique position within the Massim because they are its only Papuan-speaking people. Their outlier position as noted above, despite their geographic proximity to Austronesian-speaking neighboring islanders from the southeastern Massim, is therefore intriguing. It is also remarkable that Rossel Islanders are characterized by a larger proportion of haplogroups of AS origin than all other groups from the southeastern Massim (Table 3), although all these other groups speak Austronesian languages. Haplotype network analyses for the major NRY (O-M110 and S-M254*) and mtDNA haplogroups (P1 and E*) found in Rossel (Supplementary Figure S3) revealed some degree of haplotype sharing between Rossel Islanders and other groups of the southeastern Massim, in particular for the NO haplogroups S-M254* and P1, suggesting a shared southeastern Massim ancestry for at least the NO component. When and from where the strong AS ancestry component was contributed to Rossel's gene pool cannot be answered precisely, but it is noteworthy that while all AS NRY haplogroups found on Rossel also occur on other southeastern Massim islands, this is not the case for AS mtDNA haplogroups found on Rossel, which therefore were most likely contributed from elsewhere, perhaps from the northern Massim. Although this finding may indicate that Rossel Islanders have sex-biased local ancestry differences within the Massim, our genetic data do not reveal the exceptional outlier position of Rossel that is expected from linguistic data. |
|
|
|
Post by Admin on Jun 28, 2020 5:13:38 GMT
The Massim relationships to other populations A comparison of the Massim data with reference data from other populations of Asia/Oceania (Figure 2) highlights the Admiralty Islands of Northern Melanesia and the PNG Coast as the most similar reference populations to the Massim in terms of overall haplogroup composition. Interestingly, the Massim appear to be quite different from the geographically closer Solomon Islanders. Concerning NRY, the Solomon Islanders harbor more diverse NRY lineages than the Massim; for example, several C, K, M and O lineages present in the Solomon Islanders18 are absent from our Massim sample, but are also found in the Bismarck Archipelago.14 Similarly for mtDNA, the Northern Melanesian lineages M27 and M28 are found in the Solomons18 and in the Bismarcks,15 but not in our Massim sample. Thus, it is likely that there were direct links between the Bismarcks and the Solomons that bypassed the Massim region. To further investigate the relationships of the Massim people in the wider context of East and Southeast Asia and Near- and Remote Oceania, MDS plots were constructed based on NRY and mtDNA haplogroup frequencies using all regional population data available (Figure 4). In both plots, the positioning of the populations is in agreement with geography. In the NRY plot, the Massim groups appear close to the Austronesian-speaking Admiralty Island groups, in line with the hypothesis that Austronesian ancestors from East/Southeast Asia came to NO via the Bismarck Archipelago and from there occupied other parts of NO such as the Massim, as well as Remote Oceania.16 Wanigela, however, is distinct (consistent with Figure 3), being closest to the Western New Guinea highlands population to which it is very similar in NRY haplogroup composition. For mtDNA, the Massim groups appear much more dispersed, consistent with the observation that the Massim are more structured with respect to mtDNA than to NRY. Figure 4 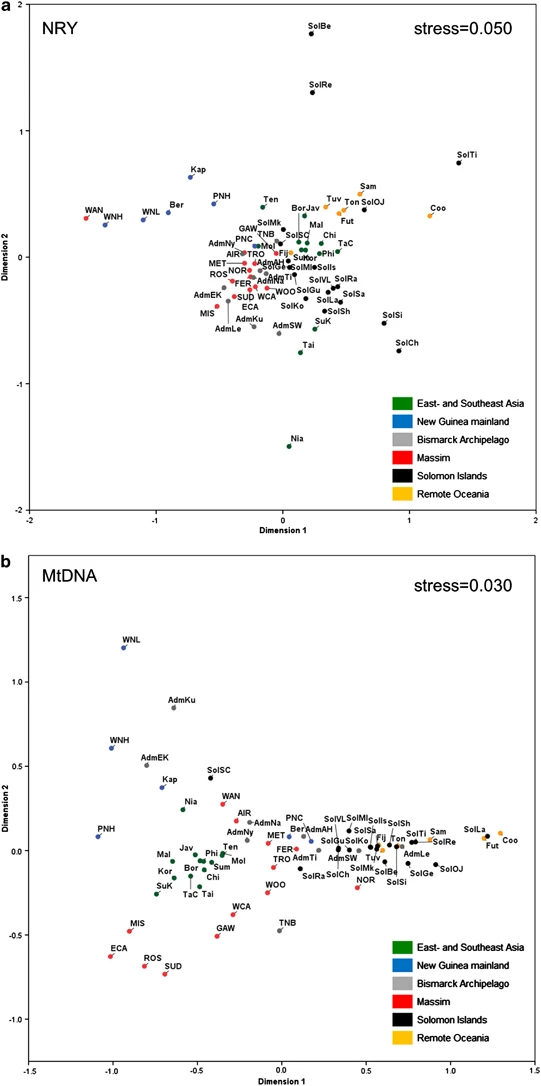 MDS plots of regional populations based on (a) FST values derived from NRY haplogroups and (b) FST values derived from mtDNA haplogroups. Only populations with a sample size of 10 or larger (for both NRY and mtDNA) were included. Population abbreviations are as in Supplementary Table S1. The Admiralty16 and Solomon Islands18 populations are indicated by Adm and Sol, respectively, followed by another abbreviation indicating the sub-population, as follows for the Admiralty Islands: AH, Andra-Hus; EK, Ere Kele; Ku, Kurti; Le, Lele; Mo, Mokerang; Na, Nali; Ni, Nyindrou; SW, Seimat-Wuvulu; Ti, Titan; and for the Solomon Islands: Be, Bellona; Ch, Choiseul; Ge, Gela; Gu, Guadalcanal; Is, Isabel; Ko, Kolombangara; La, Lavukaleve; Mk, Makira; Ml, Malaita, OJ, Ontong Java; Ra, Ranongga; Re, Rennell; Sa, Savo; SC,  Cruz; Sh, Shortlands; Si, Simbo; Ti, Tikopia; VL, Vella Lavella. Conclusions We genetically characterized, for the first time, the people of the Massim, thereby filling another gap in the complex human genetic history of NO. We found that the nearly exclusively Austronesian-speaking Massim harbor components of both AS (Austronesian) and NO (Papuan) origin with proportionally more NO Y-chromosomes and more AS mtDNAs, similar to previous observations in Austronesian-speaking groups from the Admiralty Islands north of mainland PNG,16 the Solomon Islands18 and Polynesia,7 and in line with the Slow Boat from Asia hypothesis on Austronesian dispersal.4 MtDNA-wise, the Massim appear more structured than populations from nearby regions such as the Admiralty Islands16 and the Solomon Islands.18 Both NRY and mtDNA data best support a broad three-way division of the Massim into a northwestern group, a southeastern group (excluding Rossel) and Rossel, with larger differentiation in mtDNA than in NRY. The Rossel Islanders, the only non-Austronesian (ie, Papuan) speaking people within the Massim, occupy an outlier position when compared with the other Massim groups studied, probably as a result of isolation and genetic drift. Surprisingly, however, Rossel Islanders exhibited a lower NO and higher AS (Austronesian) contribution for both NRY and mtDNA than their geographic neighbors from the southeastern Massim who speak Austronesian languages. Considering those Massim populations that participate in the Kula traditional trading system, a correlation between inter-island trading distances and genetic distances was detected for mtDNA but not for the Y-chromosome, which can be explained by male-mediated but not female-mediated gene flow throughout the Kula region. As only men participate in Kula trading, this may be a genetic signature of the Kula in contemporary inhabitants of the region. Our study thus provides insights into how a social trading system can impact on human genetic diversity, representing another example of the interplay between culture and genes, in addition to residence pattern (patrilocality versus matrilocality)39 and social stratification.40 Finally, we would like to emphasize the particular suitability of studying the uni-parentally inherited genetic systems NRY and mtDNA for investigating those parts of human genetic history that are influenced by males and females differently, such as sex-biased migrations as studied here with the Kula, and for which bi-parentally inherited genetic diversity as obtained via genome-wide SNP data is much less useful. |
|
|
|
Post by Admin on Jul 7, 2020 7:12:26 GMT
The Peopling of the Pacific from a Bacterial Perspective Yoshan Moodley,1,*† Bodo Linz,1,*‡ Yoshio Yamaoka,2,* Helen M. Windsor,3 Sebastien Breurec,4,5 Jeng-Yih Wu,6 Ayas Maady,7 Steffie Bernhöft,1 Jean-Michel Thiberge,8 Suparat Phuanukoonnon,9 Gangolf Jobb,10 Peter Siba,9 David Y. Graham,2 Barry J. Marshall,3 and Mark Achtman1,11,§ Abstract Two prehistoric migrations peopled the Pacific. One reached New Guinea and Australia, and a second, more recent, migration extended through Melanesia and from there to the Polynesian islands. These migrations were accompanied by two distinct populations of the specific human pathogen Helicobacter pylori, called hpSahul and hspMaori, respectively. hpSahul split from Asian populations of H. pylori 31,000 to 37,000 years ago, in concordance with archaeological history. The hpSahul populations in New Guinea and Australia have diverged sufficiently to indicate that they have remained isolated for the past 23,000 to 32,000 years. The second human expansion from Taiwan 5000 years ago dispersed one of several subgroups of the Austronesian language family along with one of several hspMaori clades into Melanesia and Polynesia, where both language and parasite have continued to diverge. After modern humans dispersed “out of Africa” about 60,000 years ago (60 ka) (1), they reached Asia via a southern coastal route (2). That route extended along the Pleistocene landmass, known as Sundaland (i.e., the Malay peninsula, Sumatra, Java, Borneo, and Bali), that was joined to the Asian mainland as a result of low sea levels during the last ice age (12 to 43 ka) (3). Low sea levels also meant that Australia, New Guinea, and Tasmania were connected in a continent called Sahul, separated from Sundaland by a few narrow deep-sea channels. It seems Sahul was colonized only once, ~40 to 50 ka (3, 4), although backed-blade stone tool technology and the dingo appear to have been introduced from India at a later date (5, 6). Human genetic data are compatible with these interpretations, but have not provided the details. Redd and Stoneking identified multiple mitochondrial DNA (mtDNA) lineages among New Guinea peoples with coalescence times of 80,000 to 122,000 years (80 to 122 ky), predating the out-of-Africa migrations (5). In subsequent analyses, Australian aboriginals and Melanesians fell into multiple, distinct mtDNA haplogroups inter-dispersed among lineages from East Asia and India (4), with one exception: haplogroup Q, which had a coalescent estimate of 32 ka and contained both Australian and Melanesian lineages. Y-chromosome markers yielded one lineage for Australians and a second one for Melanesians (4). Australia and New Guinea remained connected by a land bridge until sea levels rose ~8 to 12 ka, and it is surprising that the native inhabitants of Sahul are not genetically associated except for haplogroup Q. Subsequent prehistoric migrations to island East Asia and the Pacific have been designated differently depending on whether they were traced by language, archaeological remains, or genetic studies. Most of the native Pacific languages from near the African coast (Madagascar) through to Polynesia are Malayo-Polynesian, a subgroup of the Austronesian language family (7). The nine other subgroups of Austronesian are only spoken in Taiwan, suggesting that Taiwan is the origin of Austronesian (7). In support of this interpretation, agriculturists spread from Taiwan via insular and coastal Melanesia into the Pacific, as marked by the Lapita cultural complex, including red-slipped pottery, Neolithic tools, chickens, pigs, and farming (8). A human genetic marker of this route of spread is the “Polynesian” mtDNA HV1 motif of lineage B4a1a, which is found at high frequency among native Taiwanese (9), Melanesians, and Polynesians (10, 11). We attempted to trace human prehistory in the Pacific by analyzing the distribution of a bacterial parasite of humans, Helicobacter pylori. H. pylori accompanied modern humans during their migrations out of Africa (12). Subsequent founder effects, plus geographic separation, have resulted in populations of bacterial strains specific for large continental areas. Thus, Africans are infected by the H. pylori populations hpAfrica1 and hpAfrica2, Asians are infected by hpAsia2 and hpEastAsia, and Europeans are infected by hpEurope (12, 13). It seemed possible that the distribution of H. pylori genotypes among native inhabitants might provide insights into migrations throughout the Pacific. We cultivated 212 bacterial isolates from gastric biopsies or mucus obtained from aboriginals in Taiwan and Australia, highlanders in New Guinea, as well as Melanesians and Polynesians in New Caledonia (table S1). Concatenated sequences of seven gene fragments (3406 base pairs, of which half are polymorphic) from these isolates yielded 196 unique haplotypes. These were compared with 99 unique haplotypes from 100 Europeans in Australia and 222 other unique haplotypes from Asia and the Pacific, including 15 haplotypes from Chinese inhabitants of Taiwan, as well as ~1700 haplotypes from other sources. According to Bayesian assignment analysis, our samples from native inhabitants yielded 50 unique haplotypes that formed a distinct bio-geographic group called hpSahul (14). Twenty-eight percent (26 of 92) of the haplotypes from aboriginals in Australia and 89% (24 of 27) of the haplotypes from highlanders in New Guinea were hpSahul (Fig. 1A). One hpSahul haplotype was found among 99 haplotypes from Europeans in Australia and none among the other haplotypes from elsewhere.  Fig. 1 (A) The distribution of H. pylori populations in Asia and the Pacific. The proportions of haplotypes at each sampling location (red numbers; table S1) that were assigned to different bacterial populations are displayed as pie charts whose sizes indicate the numbers of haplotypes. The geographic location of Melanesia and Polynesia is depicted. The term “Austronesia” refers to the entire region inhabited by Austronesian-speaking people from Madagascar through to the Easter Islands. (Inset) A detailed map of Taiwan showing the distribution of aboriginal tribes. The names of the tribes plus the proportion of hspMaori haplotypes among all haplotypes are shown in black at the right. The language-family designations are the same as the tribal names except where indicated by parentheses (EF, East Formosan; MP, Malayo-Polynesian). (B) Phylogenetic relationships among hspMaori strains (80% consensus of 100 ClonalFrame analyses). One haplotype each of hpAsia2 and hspEAsia was used to root the tree. Strains are color-coded according to Austronesian language family in (A). Two black circles within the Pacific clade indicate haplotypes isolated from the Torres Strait islands, and a black triangle among indigenous Taiwanese indicates an hspMaori haplotype from Yami. hspMaori is a subpopulation of hpEastAsia, isolated from Polynesians (Maoris, Tongans, and Samoans) in New Zealand (13) and three individuals in the Philippines and Japan. hspMaori isolates have not previously been isolated from other individuals, including the 15 Chinese inhabitants of Taiwan (12). Fifty-four of the 196 unique haplotypes from native inhabitants were hspMaori (14), and all came from Austronesian sources. These included native Taiwanese (43 of 59, 73%), Melanesians (6 of 13, 46%), and Polynesians (3 of 5, 60%) in New Caledonia, and two inhabitants of the Torres Straits islands that lie between Australia and New Guinea and which have been visited extensively by Polynesians (Fig. 1A and table S1). These observations suggest that hspMaori is a marker for the entire Austronesian expansions rather than only for Polynesians. The remaining unique haplotypes from native inhabitants were hpEurope, hspEAsia, and hpAfrica1, which can be attributed to very recent human travels. If Taiwan were the source of the Austronesian expansions, hspMaori haplotypes would be expected to be widespread among aboriginal Taiwanese tribes. Indeed, hspMaori was isolated frequently (44 to 100%) from five of the six tribes sampled (Fig. 1A). Taiwan should also harbor the greatest diversity, and the branching order within a phylogenetic tree should reflect the direction of subsequent migrations. The phylogenetic analyses showed that genetic diversity was significantly higher in Taiwanese hspMaori (Π95 = 1.79 to 1.82%) than in non-Taiwanese hspMaori (Π95 = 1.58 to 1.62%). All non-Taiwanese hspMaori haplotypes form a single clade, the Pacific clade, which originates from one of several clades among indigenous Taiwanese haplotypes (Fig. 1B). The sequence of branching events within the Pacific clade is consistent with sequential migrations from Taiwan via the Philippines and island Melanesia to Polynesia (Fig. 1B). These results also support an association between language and haplotype group. The indigenous Taiwanese haplotypes were isolated from tribes that speak 5 of the 10 subgroups of the Austronesian family of languages, whereas the Pacific clade was isolated from individuals that speak variants of Malayo-Polynesian. The sole exception to these generalizations was one haplotype from the Yami of Lanyu, a small island off the coast of Taiwan, where the language is a variant of Malayo-Polynesian but the haplotype clustered with the indigenous Taiwanese haplotypes. Together, these observations provide support for a Taiwanese source of the Austronesian expansions. Using the isolation with migration model (IMa), we calculated the magnitude of migrations in both directions after the initial split between the Taiwan and Pacific clades of hspMaori (15). IMa uses sequence data within a probabilistic framework to simulate a model of initial geographic separation between two populations followed by occasional migration in both directions. Because homologous recombination is frequent within H. pylori (13, 16), we excluded blocks of sequences that had a high likelihood of recombination (14). The calculations indicated that migrations subsequent to the initial split were unidirectional, from Taiwan to the Pacific (Fig. 2A).  Fig. 2 Global patterns of migration between eight pairs of H. pylori populations as calculated by the isolation with migration model (IMa). (A) Map. The magnitudes of migration are denoted by numbers and arrow thickness and their direction is indicated in blue or red. (B) Graph showing a linear relation between the calibration time (table S2) of six events (filled blue circles) that are dated by archaeological estimates and the estimated time (t). (C) Population tree reconstructed from a consensus of 1000 bootstrap samples from the range of calculated t values to determine the ages of nodes (thousands of years, kyr) associated with the peopling of the Sahul (unfilled circles). Ages (in light blue) are the 95% confidence limits of estimated coalescence times obtained by applying global rate minimum deformation (GRMD) rate-smoothing, as implemented in Treefinder, to the range of t values within the limits of calibration dates. Other splits between pairs of H. pylori populations were also unidirectional: for example, the Amerind colonization over the Bering Strait and the subsequent colonization of South America from North America. However, migrations out of Africa, from Central to East Asia, and from East Asia to Taiwan were followed by appreciable levels of return migration (Fig. 2A). Molecular mutation rates are unknown for most bacteria, so we cannot directly use IMa data to calculate the dates of initial splits. Instead, we calibrated against known dates for splits among human populations. The archaeologically attributed split between Taiwan and the Pacific Clade is 5 ka (8). Five other calibration dates are presented in table S2. The time when populations split (t) calculated by IMa varied linearly with the calibration dates (Fig. 2B). We used random values within the range of five t values that were calculated for each split between all pairs of populations (table S2) to construct 1000 bootstrap trees using Treefinder (17). These trees were then used to calculate the age of the Sahulian migration by rate-smoothing within the limits of the six calibration dates (14). The dates and numbers of migrations to the Sahul are controversial. According to our IMa calculations, the population split leading to hpSahul postdated the out-of-Africa migrations but predated the splits that resulted in hpAsia2 (found in Central Asia) and hpEastAsia [East Asia (hspEAsia); the Pacific (hspMaori); the Americas (hspAmerind)]. The 95% confidence limits of the date of the split between hpSahul and the Asian populations were estimated as 31 to 37 ka and the split between hpSahul in New Guinea and Australia as 23 to 32 ka. The combined data presented here indicate that hpSahul migrated only once from Asia toward Sahul, and once between New Guinea and Australia, and subsequent migration did not occur from Australia to New Guinea (Fig. 2A). |
|
|
|
Post by Admin on Jul 7, 2020 21:07:29 GMT
To verify the use of IMa for dating of population splits in a bacterial species like H. pylori, we also used a haplotype-based coalescent approach, which accounts for recombination with unrelated sources of DNA, as implemented in the program ClonalFrame (18). ClonalFrame generated a haplotype tree whose branch order agreed with the population tree generated by IMa (Fig. 3A). It also assigned individual haplotypes to clades that are congruent with the population assignments, including the separation between hpSahul and other populations. The observation that all hpSahul strains clustered in a monophyletic clade verifies a single colonization event and confirms that modern Asians and the inhabitants of the Sahul have undergone independent evolutionary trajectories since they first split. The two hpSahul clades in New Guinea and Australia are also distinct, confirming a lack of migration between the two areas.  Fig. 3 Global phylogeny of H. pylori as calculated by a haplotype approach based on the 80% consensus of 100 ClonalFrame analyses. (A) Phylogenetic tree of divergence time, as indicated by node height versus geographic sources (bottom line) and population assignments (second line). Detailed sources of clades within populations are indicated in the third line from the bottom. Node heights were used to date the two hpSahul nodes (unfilled circles) based on six calibration times (filled blue circles, table S2). Age ranges (light blue numbers) are the 95% confidence limits of estimated coalescence times obtained with GRMD rate-smoothing over the range of node height values and calibration time limits. hpAFR2, hpAfrica2; hpAFR1, hpAfrica1; AM, America. (B) Graph showing a linear relation of calibration time with the range of heights for each node. Similarly to the IMa analyses, we observed a linear relation between the calibration dates and time of splitting calculated by ClonalFrame as node heights (Fig. 3B). Applying the same rate-smoothing calibration method as above, we estimated that hpSahul split from the Asian population 32 to 33 ka. Subsequently, hpSahul from New Guinea and Australia split 23 to 25 ka. Both estimates overlap with the range of IMa estimates (31 to 37 ka and 23 to 32 ka, respectively). The date of origin of hpSahul is comparable to the estimated age of 32 ka for the Q mtDNA haplogroup (4), but less than the 40 to 50 ky associated with the oldest archaeological finding of human artefacts in Australia (3). Our results lend support for two distinct waves of migrations into the Pacific. First, early migrations to New Guinea and Australia accompanied by hpSahul and second, a much later dispersal of hspMaori from Taiwan through the Pacific by the Malayo-Polynesian–speaking Lapita culture. Each sampling area yielded either hpSahul or hspMaori haplotypes, but not both. The lack of overlap between these populations may reflect differential fitness of the parasite, as has been inferred for the modern replacement of hspAmerind haplotypes by European and African H. pylori in South America (19, 20). Alternatively, hpSahul and hspMaori may still coexist in unsampled islands of East Asia, Melanesia, and coastal New Guinea, where their identification might help to unravel the details of human history in those areas. Supplementary Material www.ncbi.nlm.nih.gov/pmc/articles/PMC2827536/bin/NIHMS178138-supplement-Suppl__Data.pdf |
|
|
|
Post by Admin on Apr 23, 2021 20:49:59 GMT
Complete mitochondrial DNA genome sequences from the first New Zealanders Michael Knapp, K. Ann Horsburgh, Stefan Prost, Jo-Ann Stanton, Hallie R. Buckley, Richard K. Walter, and Elizabeth A. Matisoo-Smith Abstract The dispersal of modern humans across the globe began ∼65,000 y ago when people first left Africa and culminated with the settlement of East Polynesia, which occurred in the last 1,000 y. With the arrival of Polynesian canoes only 750 y ago, Aotearoa/New Zealand became the last major landmass to be permanently settled by humans. We present here complete mitochondrial genome sequences of the likely founding population of Aotearoa/New Zealand recovered from the archaeological site of Wairau Bar. These data represent complete mitochondrial genome sequences from ancient Polynesian voyagers and provide insights into the genetic diversity of human populations in the Pacific at the time of the settlement of East Polynesia. The arrival of Polynesian colonists in Aotearoa/New Zealand only 750 y ago represents the end of the last major human migration event: the settlement of East Polynesia (1). The question of Polynesian origins has been debated since Europeans first arrived in the Pacific, and the genetic evidence for their origins and migration pathway continues to be debated today (2⇓⇓⇓–6). Identification of a combination of mitochondrial DNA (mtDNA) mutations initially referred to as the “Polynesian motif” found at high frequency in Polynesian populations (7) has provided a marker for tracking the origins of this last major human expansion. Despite the interest in identifying Polynesian origins, there has been little research on mtDNA variation within Polynesia. Studies focusing in the hypervariable region (HVR) of the mitochondrial genome have reported a near-ubiquitous distribution of the so-called Polynesian motif, now recognized as defining haplogroup B4a1a1a, within the Polynesian Triangle (3, 8). The lack of genetic diversity generally, including in the HVR, of modern Polynesians (ref. 9 and references cited therein) is typically hypothesized to be a reflection of a general lack of diversity in the founding population. This limited diversity has been explained as the combined result of multiple successive population bottlenecks that occurred during colonizing voyages and of the speed and recency of colonization (9). It is well known, however, that Polynesian populations—and East Polynesian populations in particular—were decimated by the introduction of European diseases at the time of, and following, initial European contact (10, 11). Thus, the lack of modern genetic variation in Polynesia may not necessarily reflect that of the colonizing populations. Recent analyses of complete mitochondrial genomes have identified numerous new variants within the B4a1a1a haplogroup (2, 12), including a “Malagasy” motif. Madagascar, like East Polynesia, was settled within the last millennium or so by peoples speaking Austronesian languages (13). Significant mtDNA variation was also indicated in a recent study of both ancient and modern mtDNA in the Gambier Islands, in French Polynesia, where new variants of the B4a1a1a haplotype were reported as well as several ancient and modern individuals with the Q1 haplotype (14). Although a recent study by Benton et al. (15) found reduced mtDNA variation in a sample of 20 modern Maori compared with other worldwide populations, they still identified 11 individual haplotypes, including three previously unidentified lineages within the B4a1a1 haplotype. Furthermore they identified what they suggest are three unique Maori mutations (1185T, 4769G, and 16126C; sequence data not available from GenBank at the time of submission). These combined results suggest that we may be underestimating the mtDNA variation in the founding populations of Polynesia. Such variation could be critical for reconstructing the process of settlement of the Polynesian Triangle, for better understanding the genetic history of the region including the impact of infectious disease and other aspects of natural selection and ultimately for identifying the origins of the Polynesians. It might also provide key information regarding social organization and kinship structure in the founding populations of East Polynesia. Here we present complete mitochondrial genome sequences from Polynesian voyagers that lived at the time of the settlement of East Polynesia. The ancient DNA (aDNA) evidence was obtained from the human remains excavated from the Wairau Bar archaeological site. The Wairau Bar site, located on the northeast coast of the South Island of New Zealand, is one of the earliest and best-dated sites in New Zealand and contains the earliest known burial grounds (Fig. S1). Excavations of the site undertaken from the 1940s through the 1960s identified three distinct burial groups, from which 42 individual burials were identified. These human remains and many of the artifacts recovered from the site were held at the Canterbury Museum as part of its permanent collection until 2009, when they were repatriated to Wairau Bar and Te Runanga a Rangitane o Wairau (Rangitane), the tribal group who have ancestral ties to and guardianship status over Wairau Bar (16, 17). The Wairau Bar site is a large village site securely dated to A.D. 1285–1300 (17, 18). The rich artifactual assemblages of distinctive Archaic East Polynesian form are directly associated with several of the burials, particularly those in burial group 1, and are typical of the early colonization phase of Aotearoa/New Zealand (19). A large number of moa bones and eggs were also associated with some of these burials. It has been argued that moa (Aves: Dinornithiformes), the large, flightless birds endemic to New Zealand, became extinct within about a century of human arrival (20). Therefore, their presence in the burials also strongly suggests that these burials represent either a founding population or are at most one that was only a few generations removed from the founding population of Aotearoa/New Zealand. Similarly, a recently excavated oven at Wairau Bar contained the remains of moa, sea lion, fur seal, elephant seal, and bones of the extinct Haast’s Eagle (17), which were all consistent with the very early prehistoric/founding period occupation of the site. The aDNA recovered from the Wairau Bar individuals is therefore likely to represent that of the founding colonists of Aotearoa/New Zealand and also provides key evidence regarding the minimum variation present in the immediate ancestral population in central East Polynesia. PNAS November 6, 2012 109 (45) 18350-18354; doi.org/10.1073/pnas.1209896109 |
|


 Cruz; Sh, Shortlands; Si, Simbo; Ti, Tikopia; VL, Vella Lavella.