|
|
Post by Admin on Nov 1, 2013 1:37:51 GMT
 Fig. 1. Accuracy on the Raven’s matrices and the cognitive control tasks in the hard and easy conditions, for the poor and the rich participants in experiment 1. (Left) Performance on the Raven’s Matrices task. (Right) Performance on the cognitive control task. Error bars reflect T1 SEM. Top horizontal bars show two-way interaction (poor versus rich × hard versus easy). The poor often behave in less capable ways, which can further perpetuate poverty. We hypothesize that poverty directly impedes cognitive function and present two studies that test this hypothesis. First, we experimentally induced thoughts about finances and found that this reduces cognitive performance among poor but not in well-off participants. Second, we examined the cognitive function of farmers over the planting cycle. We found that the same farmer shows diminished cognitive performance before harvest, when poor, as compared with after harvest, when rich. This cannot be explained by differences in time available, nutrition, or work effort. Nor can it be explained with stress: Although farmers do show more stress before harvest, that does not account for diminished cognitive performance. Instead, it appears that poverty itself reduces cognitive capacity. We suggest that this is because poverty-related concerns consume mental resources, leaving less for other tasks. These data provide a previously unexamined perspective and help explain a spectrum of behaviors among the poor. We discuss some implications for poverty policy. The Raven’s test involves a sequence of shapes with one shape missing (27). Participants must choose which of several alternatives best fits in the missing space. Raven’s test is a common component in IQ tests and is used to measure “fluid intelligence,” the capacity to think logically and solve problems in novel situations, independent of acquired knowledge (28, 29). The spatial incompatibility task requires participants to respond quickly and often contrary to their initial impulse. Presented with figures on the screen, they must press the same side in response to some stimuli but press the opposite side in response to others. The speed and accuracy of response measures cognitive control (30), the ability to guide thought and action in accordance with internal goals (31). Both are nonverbal tasks, intended to minimize the potential impact of literacy skills. Upon completion of these tasks, participants responded to the original scenario by typing their answers on the computer or speaking to a tape recorder and then moved on to the next scenario (an analysis of participants’ responses to the scenarios is available in table S1).We also collected participants’ income information at the end of the experiment.  Fig. 4. Accuracy on the Raven’s matrices and the cognitive control tasks for pre-harvest and post-harvest farmers in the field study. (Left) Performance on Raven’s matrices task. (Middle and Right) Stroop task (measuring cognitive control) response times (RT) and error rates, respectively; error bars reflect T1 SEM. Top horizontal bars show test for main effect of pre- versus post-harvest (***P < 0.001). We have argued that the attentional demands created by poverty are a plausible mechanism (29). But there could be other mediating factors. Nutrition is one candidate—in the harvest findings, if not in the mall study; farmers may eat less when poor. In 2009, we ran a pilot study with the same design in the districts of Thanjavur, Thiruvarur, Perambalur, and Pudokottai in Tamil Nadu, in which we surveyed 188 farmers and also asked about food consumption. We found similar effects on Stroop (1.47 errors post-harvest versus 2.12 errors pre-harvest; P = 0.006 via t test, n = 111 participants). Pre-harvest farmers were not eating less; they spent 2663 rupees a month on food pre-harvest and 2592 rupees postharvest (roughly $53 and $52, respectively, not accounting for purchasing power parity). Additionally, the Stroop results persist even in regressions in which food consumption is included as a control variable. A potential explanation of these findings is stress. Financial concerns could reasonably induce stress in pre-harvest farmers. Indeed, we examined biological stress. In the 2009 study, we collected two biomarkers of stress: heart rate and blood pressure. Both measures showed that the farmers were more stressed before the harvest; heart rate was higher pre-harvest than postharvest (78.42 versus 76.38; P = 0.088 via t test, n = 188 participants), and so were diastolic blood pressure (78.70 versus 74.26, P < 0.001 via t test, n = 188) and systolic blood pressure (128.64 versus 121.56, P < 0.001 via t test, n = 188). The data reported here suggest a different perspective on poverty: Being poor means coping not just with a shortfall of money, but also with a concurrent shortfall of cognitive resources. The poor, in this view, are less capable not because of inherent traits, but because the very context of poverty imposes load and impedes cognitive capacity. The findings, in other words, are not about poor people, but about any people who find themselves poor. How large are these effects? Sleep researchers have examined the cognitive impact (on Raven’s) of losing a full night of sleep through experimental manipulations (38 ). In standard deviation terms, the laboratory study findings are of the same size, and the field findings are three quarters that size. Put simply, evoking financial concerns has a cognitive impact comparable with losing a full night of sleep. In addition, similar effect sizes have been observed in the performance on Raven’s matrices of chronic alcoholics versus normal adults (39) and of 60- versus 45-year-olds (40). By way of calibration, according to a common approximation used by intelligence researchers, with a mean of 100 and a standard deviation of 15 the effects we observed correspond to ~13 IQ points. These sizable magnitudes suggest the cognitive impact of poverty could have large real consequences. web.natur.cuni.cz/~houdek3/papers/Mani%20et%20al%202013.pdf |
|
|
|
Post by Admin on Nov 21, 2013 6:37:57 GMT
The controversial study on African IQ levels conducted by psychologist Richard Lynn is deeply flawed. This conclusion is the outcome of studies by Jelte Wicherts, Conor Dolan, Denny Borsboom and Han van der Maas of the University of Amsterdam (UvA) and Jerry Carlson of the University of California (Riverside). Their findings are set to be published in Intelligence, Personality and Individual Differences, and Learning and Individual Differences.  Wicherts and his colleagues examined over 100 published studies, concluding that there is no evidence to back up Lynn's claims. Amongst other flaws, Lynn used selective data by systematically ignoring Africans with high IQ scores. The researchers also claim that African IQ test scores cannot be interpreted in terms of lower intelligence levels, as these scores have different psychometric characteristics than western IQ test scores. Until now, the incomparability of Western and African IQ scores had never been systematically proven. The scientists point out that the average African IQ is currently comparable to the average level in the Netherlands around 1950. However, IQ scores in Western countries have risen sharply over the course of the 20th century. In view of this trend, Wicherts and his colleagues claim there are no reasonable grounds to conclude that sub-Saharan countries are poor due to the lower IQ scores of their populations. As it turns out, the average IQ of African adults is seeing a similar rising trend, which is expected to continue if living conditions in Africa improve in future.  On the basis of several reviews of the literature, Lynn [Lynn, R., (2006). Race differences in intelligence: An evolutionary analysis. Augusta, GA:Washington Summit Publishers.] and Lynn and Vanhanen [Lynn, R., & Vanhanen, T., (2006). IQ and global inequality. Augusta, GA: Washington Summit Publishers.] concluded that the average IQ of the Black population of sub-Saharan Africa lies below 70. In this paper, the authors systematically review published empirical data on the performance of Africans on the following IQ tests: Draw-A-Man (DAM) test, Kaufman-Assessment Battery for Children (K-ABC), the Wechsler scales (WAIS & WISC), and several other IQ tests (but not the Raven's tests). Inclusion and exclusion criteria are explicitly discussed. Results show that average IQ of Africans on these tests is approximately 82 when compared to UK norms. We provide estimates of the average IQ per country and estimates on the basis of alternative inclusion criteria. Our estimate of average IQ converges with the finding that national IQs of sub-Saharan African countries as predicted from several international studies of student achievement are around 82. It is suggested that this estimate should be considered in light of the Flynn Effect. It is concluded that more psychometric studies are needed to address the issue of measurement bias of western IQ tests for Africans. There can be little doubt that Africans average lower IQs than do westerners. Several factors may cause this. Lynn (2006), Rushton (2000), and Kanazawa (2004) have proposed evolutionary theories to explain the relatively low scores of Africans on IQ tests. However, the fact is that African countries are developing countries, and we view this as highly relevant in the explanation of the low IQ test performance of Africans. Specifically, Flynn (1987, 2007) has shown that IQ levels have increased considerably in the developed world over the course of the twentieth century. African countries below the Sahara have not experienced the improvements in the variables that have been proposed to have caused the Flynn Effect in the developed world. These include improvements in nutrition and health (care), increases educational attainment, improvements in educational practices, urbanization, large-scale dissemination of visual–spatial toys, etc. Although it cannot be precluded that genetic effects play a role in the low IQ performance of Africans, we view environmental circumstances as potentially more relevant to the present-day difference in mean. The average IQ level of 81 for Africans in terms of western norms may appear to be low, but from a historical perspective it is not. For instance, due to the Flynn Effect, the average IQ of the Dutch population in the 1950s, compared to contemporary norms, would also be around 80 (Flynn, 1987, 2007). Note that in terms of societal development, contemporary African countries are more similar to developed countries in the first half of the twentieth century than to present-day developed countries. wicherts.socsci.uva.nl/wicherts2009.pdf |
|
|
|
Post by Admin on Nov 15, 2015 11:48:16 GMT
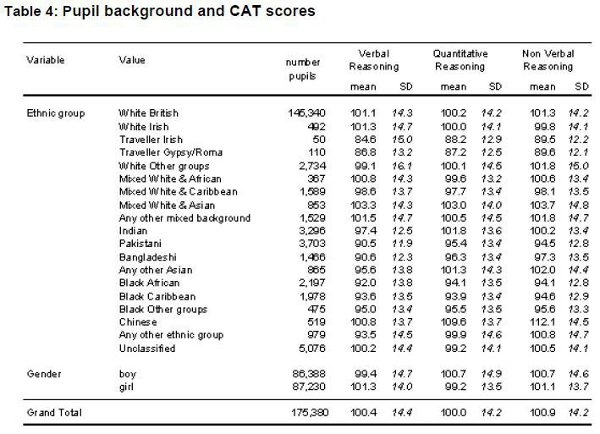 (1) The sample is very large. Verbal IQ has the highest correlation with academic performance in most subjects, followed by Quantitative IQ, and then Non-Verbal Reasoning (recognizing patterns and such, I imagine). (2) Indians do almost as well as Whites, although the structure of their cognitive abilities are a bit different: About 4 points lower than Whites in Verbal, but almost 2 points better in Quantitative. As rec1man said, “The Patels and Sikhs are Upper-Shudra / Vaishya and this is 80% of the diaspora in UK.” So this is highly encouraging for India’s eventual prospects; in indicates that the broad middle can in principle build a reasonably wealthy, middle-class society. (3) The Pakistanis and Bangladeshis also don’t do too badly – certainly better than I would have expected (I visited a Pakistani school once in the UK and it was horrific).  (4) This might imply we are actually looking at the following average-IQ groups in India: Lower 40% – 93; Middle 40% – 99; Top 20% – 105, for an overall average of 98 (once Flynn Effect is done with them). That’s better than Greece today and certainly good enough to have a developed society. But there’s tons of challenges: Malnutrition, slums, poor education, widespread vegetarianism (both voluntary and involuntary – due to poverty) that have to be sorted out for India to perform to its potential. (5) As with most IQ tests, the Chinese do as well as Whites in Verbal, but massively better in Quantitative and Non-Verbal Reasoning. (6) Blacks do surprisingly well, lagging Whites by less than 0.5 S.D., which is VERY encouraging considering that according to US data where they are almost always 0.8-1 S.D. behind Whites. Two issues to consider (and bear in mind) here:  To what extent are Caribbean Blacks admixed with Whites? As regards African Blacks, they simultaneously benefit from the Flynn Effect (much better fed than parents) but also suffer from regression to the mean (African immigrants to the US are the most credentialed immigrant group and thus have IQ’s well above the African norm, and I assume to a certain extent this is the case in the UK also; logically, their children who take the CAT will have have lower genetic IQ’s). Which of these forces is stronger? (7) Another curiosity is that British Blacks do better on Quantitative than on Verbal. In the US it the other way round. (8) As is typically the case, boys do slightly better on Quantitative and girls do slightly better on Verbal; and girls have lower S.D.’s (i.e. have fewer morons and geniuses). (9) Incidentally, as a matter of curiosity, I note that in this – what I take to be a fairly representative sample of Britain’s school-age population – the proportion of British Whites is 82%, and the share of overall Whites is slightly less than 85%; mixed people are about 3%. For comparison, British Whites constituted 86% of the population (in 2001), while only 64% of children born in 2005 where recorded as British Whites. Seems like a very fast rate of population replacement. |
|

