|
|
Post by Admin on Nov 25, 2016 20:43:35 GMT
 Figure 1. Map of samples and population structure of North Africa and neighboring populations. Out of Africa and Back Again? By sampling multiple populations along an approximate transect across North Africa, we were able to identify gradients in ancestry along an east-west axis (Figure 1 and Figure 2). Notably, even northwestern populations with very high proportions of Maghrebi ancestry, such as the Tunisians and Saharawi, still cluster with Out-of-Africa populations in the population structure analyses (Figure 1 (k = 2), Figure 2). This observation of clustering formed the basis for further analyses to distinguish between two alternative demographic models. First, North Africans could be closer to OOA populations due to extensive gene flow, likely from the Near East, over the past ∼50 Kya. Second, North Africans could be closer to OOA populations if the two groups had diverged more recently than either had split with sub-Saharan Africans. We can reject a simple model of long-term continuous gene flow between the Near East and North Africa, as evidenced by clear geographic structure and non-zero Fst estimates. Fst estimates between the inferred Maghrebi cluster and sub-Saharan Africans are two to three-times greater than Fst between the Maghrebi and Europeans/Near Easterners ancestral clusters (Table S3). We then address whether this population structure was recent or ancient. Although Fst estimates from ascertained data may be biased, as rare alleles are under-represented in the site frequency spectrum, comparison of African-European Fst from resequencing data and the Affymetrix 500 K platform showed only a negligible difference [31]. Assuming reasonable effective population sizes for North African Maghrebi and neighboring populations [17], we first showed that all North African populations are estimated to have diverged from OOA groups more than 12,000 ya (Figure 3). After accounting for putative recent admixture (Figure 1), the indigenous Maghrebi component (k-based) is estimated to have diverged from Near Eastern/Europeans between 18–38 Kya (Figure 3), under a range of Ne and k values. We hence suggest that the ancestral Maghrebi population separated from Near Eastern/Europeans prior to the Holocene, and that the Maghrebi populations do not represent a large-scale demic diffusion of agropastoralists from the Near East.  Figure 2. Multidimensional scaling components discriminating genetic clusters in Africa. With model parameters for divergence approximately estimated, we then ask whether North African ancestral populations were part of the initial OOA exit and then returned to Africa [8], or if an in situ model of population persistence for the past 50 Kya is more likely (with variable episodes of migration from the Near East)? We can address this question only indirectly with contemporary samples; however, several auxiliary observations point toward the former hypothesis. Substantially elevated linkage disequilibrium in all of these North African population samples, compared to sub-Saharan populations [32], is consistent with a population bottleneck. Hellenthal et al. [30] also observed that the reduction in the number of haplotype founders required to reconstruct the Mozabite population, as compared to other African populations, could be explained by a population bottleneck. If North African ancestral populations persisted in situ, then we need to invoke two population bottlenecks, one in the ancestors of North Africans (including the Berbers) and one for OOA groups. Alternatively, the “OOA” bottleneck would need to occur in North Africa, rather than when groups moved out of the continent [33]. The second possibility appears at odds with most published models of the movement of modern humans outside of Africa. A scenario where North African Maghrebi ancestry is the result of in situ population absorbing Near Eastern migrants would likely need the following premises to explain the results here and elsewhere: a) an Out-of-Africa migration [concurrent with bottleneck] occurs 50–60 Kya, geographically dividing North African and Near Eastern populations; b) North Africans experience a separate bottleneck; c) gene flow maintains similarity between the two geographically distinct populations; d) the gene flow then ceases or slows roughly between 12–40 Kya in order to allow sufficiently distinct allele frequency distributions to form. In contrast, we find it more parsimonious to describe model where: a) an OOA migration occurs [concurrent with a bottleneck]; b) OOA populations and North Africans diverge between 12–40 Kya when a migration back-to-Africa occurs. These models should be further tested with genomic sequence data, which have better power to detect magnitude and timing of bottlenecks, and to estimate the true joint allele frequency spectrum.  Figure 3. Divergence time estimates among European, Maghrebi, and Near Eastern ancestral populations. More recently, the substantial, east-to-west decline of Near Eastern ancestry (Figure 1A) could represent a defined migration associated with Arab conquest 1,400 ya or merely gene flow occurring gradually among neighboring populations along a North African | Arabian Peninsula transect. Although we observe a declining amount of Maghrebi ancestry from northwest-to-northeast, it is possible that other geographically North African samples (e.g. Egyptians further south than the sampled Siwa Oasis) do not conform to this geographic cline. Finally, we also observe European ancestry that is not clearly accounted for by the inclusion of a Near Eastern sample. Additional migration coming from Europe might be plausible, though the origin and the period where it took place cannot be determined with the present data. The less than 25% European ancestry in populations like Algerians and northern Moroccans could trace back to maritime migrations throughout the Mediterranean [34]. Alternatively, the Qatari could represent a poor proxy for an Arabic source population, causing additional diversity to be assigned European (e.g. European ancestry tracts were not reliably assigned as European with PCADMIX). In summary, although paleoanthropological evidence has established the ancient presence of anatomically modern humans in northern Africa prior to 60,000 ya [35], the simplest interpretation of our results is that the majority of ancestry in modern North Africans derives from populations outside of Africa, through at least two episodes of increased gene flow during the past 40,000 years (Figure 1, Figure 2, Figure 3).  Figure 4. Distribution of long segments that are identical by descent (IBD) for pairs of individuals. Reconstructing Multiple Admixed Ancestries Multiple local ancestry assignment methods, including PCADMIX, require thinning genotype datasets to remove alleles in high linkage disequilibrium between populations [29], [36]; this step discards information regarding haplotype patterns that tend to be more informative than genotypes when using data biased by SNP ascertainment [37]. HAPMIX incorporates both LD information and uncertainty in phase inference for haplotypes [18], but the software is currently limited to a two-population model. Our ancestral proportions of European and sub-Saharan ancestry for many North Africans at k = 2 (Figure 1) are similar to those obtained with HAPMIX by Price et al. [18] for the HGDP Algerian Mozabites, assuming a two-population mixture of northern Europeans and Yoruba. However, our results show that increasing the number of possible ancestral populations reveals multiple, diverse ancestries (e.g. Maghrebi, Near Eastern, Nilotic) and that the proportion of sub-Saharan African assignment decreases as these other ancestries are accounted for. This decrease in assigned sub-Saharan ancestry in North African samples, from a k = 2 model, is consistent with an interpretation that Maghrebi or Near Eastern diversity that is not present in the panel populations is more likely to be assigned to the more diverse, Sub-Saharan African ancestry. Using a two-population admixture model, Price et al. [18] estimated the time of migration from sub-Saharan Africa into the Mozabites to have begun about 100 generations ago (or more). Our results suggest that sub-Saharan African and Maghreb admixture is considerably more recent, 24–41 generations ago (and even the upper 95% CI estimate under either model is 55ga, Table 1). The discrepancy between these two estimates may result from our incorporation of multiple source populations, our use of non-linear models to estimate migration timing and the elimination, in Price et al. [18], of individuals with megabase long African segments.  Figure 5. Correlation between ancestry proportions inferred from ADMIXTURE and PCADMIX. Time of Migration Estimation We use a two-population model of migration where we measure the number and length of migrant tracts observed in the admixed population. However, as argued earlier, North African populations have absorbed migrants from multiple episodes of migration. We use three- and four-population admixture deconvolution to identify the tracts from these separate migrations. One complication with this approach is the possibility that source populations that contribute migrants to North Africa are themselves exchanging migrants. For example, Near Eastern populations expanded into European continent during the Neolithic, and even an isolated population like the Spanish Basque may have genomic segments that trace back to the Neolithic expansion [38], [39]. In this case, estimation of the time of migration of Arabic individuals into North Africa would be biased by Basque segments of Arab ancestry that were contributed by Europeans, but are locally assigned to Arabic ancestry. We confine our migration estimates to those from sub-Saharan populations into North Africans because there has likely been relatively little recent gene flow between sub-Saharan Africans and the European/Near Eastern populations. Moorjani et al. [40] present evidence for recent gene flow (<100 generations ago) from Africa to the Near East and Europe. But, they hypothesize it might be due to North African migrations, rather than sub-Saharan Africa.  Migration Implications Assuming a 30-year generation time [41], the proposed migration of sub-Saharans to southern Morocco at about 1,200 years ago coincides with the rise of the Ghana Empire, involved in the trans-Saharan slave trading, and the “Great Berber Uprising” which established Berber kingdoms throughout Morocco. We use a Bantu-speaking population from Kenya as a source population for this migration, as North African individuals with sub-Saharan ancestry appeared to be closer to the Luhya than the Nigerian Yoruba (Figure 1, Figure 2 and Figure S2). However, there are likely other western African populations genetically similar to Kenyan Bantu-speakers. We do not interpret this association as an explicit migration from Kenya to southern Morocco. We also use the length of Nilotic tracts in Egyptians to ask if sub-Saharan ancestry (apparent in Figure 1 and Figure 6) also appears to be a recent introduction. Under a pulse model of migration, a significant increase in gene flow likely occurred ∼700 ya, after the Arabic expansion into North Africa 1,400 ya. Our migration results are in agreement with previous studies based on mtDNA analysis where gene flow into eastern and western North Africa appeared to have different sub-Saharan population sources [10], [16]. Conclusion Our genome-wide dense genotyping data from seven North African populations allow us to address outstanding questions regarding the origin and migration history of North Africa. We propose that present-day ancestry in North Africa is the result of at least three distinct episodes: ancient “back-to-Africa” gene flow prior to the Holocene, more recent gene flow from the Near East resulting in a longitudinal gradient, and limited but very recent migrations from sub-Saharan Africa. Population structure in North Africa is particularly complex, and future disease or phenotypic studies should carefully account for local demographic history. However, the rich history of gene flow can also help empower genome-wide association mapping via admixture mapping techniques [42]. For example, the variable but relatively long haplotypes of sub-Saharan ancestry are amenable to admixture mapping approaches developed for African-American samples. In conclusion, North African populations retain a unique signature of early “Maghrebi” ancestry, but North African populations are not a homogenous group and most display varying combinations of five distinct ancestries. |
|
|
|
Post by Admin on Dec 22, 2016 20:47:13 GMT
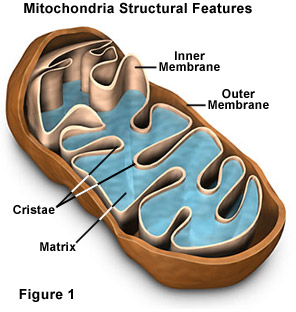 The mitochondrion is an organelle found in all cells of our body and plays a significant role in the energy and heat production. This is the only organelle in animal cells harboring its own genome outside of the nucleus. Mitochondrial DNA (mtDNA) variants have been traditionally used as neutral markers to trace ancient population migrations. As a result, the functional impact of human mtDNA population variants on gene regulation is poorly understood. To address this question, we analyzed available data of mtDNA gene expression pattern in a large group of individuals (454) from diverse human populations. Here, we show for the first time that the ancient migration of humans out of Africa correlated with differences in mitochondrial gene expression patterns, and could be explained by the activity of certain RNA-binding proteins. These findings suggest a major mitochondrial regulatory transition, as humans left Africa to populate the rest of the world.  Fig 1. Study design. Levels of gene expression can vary among individuals, tissues and species [27]. As such, we utilized RNA-seq experiments to assess differential mitochondrial gene expression patterns among individuals and ethnicities (Fig 1). To this end, we sought RNA-seq studies addressing a variety of human populations. As a first step, we attempted to compile available RNA-seq datasets from various populations [26, 28–31] to generate the largest and most diverse studied cohort. However, expression pattern clustering analysis grouped RNA-seq samples according to the study of origin, even when considering the same samples that were separately sequenced and analyzed independently by different groups (S1 Fig), thus arguing against co-analysis of RNA-seq data generated by different protocols. Hence, although Sudmant et al. [27] recently showed that differences in gene expression patterns between tissues are greater than are differences between studies, our results reveal that while focusing on a single tissue, differences in gene expression patterns between studies exceeds differences among individuals. Therefore, to avoid such artifacts, we focused our analysis on the largest of the relevant studies, encompassing 462 publicly available RNA-seq samples from Caucasians and sub-Saharan Africans [26], all part of the 1000 Genomes Project [32]. This dataset included results from mRNAs and rRNAs sequencing libraries, here referred as the ‘long RNA’ dataset, as well as short-reads sequencing libraries that includes mtDNA-encoded tRNAs (i.e. the tRNA dataset). In that study, all samples were randomly distributed to seven laboratories and RNA-seq data was generated following an identical shared protocol. In considering the 462 RNA-seq samples, eight of the long RNA dataset did not successfully map to human nDNA and mtDNA reference genomes. Our analysis indicated that this problem stems from uneven numbers of paired reads (STAR mapping criterion), which may reflect lower data quality. To avoid possible technical biases we excluded the mentioned 8 samples from further analysis. The number of reads per base that mapped to mtDNA in the remaining 454 long RNA samples ranged from several hundred in the case of tRNA genes, to nearly half a million for some protein-coding genes (S2A Fig). Sequencing reads corresponding to tRNAs were under-represented in the long RNA dataset likely due to the library preparation protocols used, which involved a size selection step. We partially overcame this limitation by analyzing the tRNA dataset. Here, 16 of the 22 tRNA genes were represented in the tRNA dataset with sufficient numbers of mapped reads for analysis in at least 90% of the samples. For the sake of consistency, we included only those individuals who were represented in the long RNA dataset when considering the tRNA dataset, thereby retaining 440 samples with coverage of up to tens of thousands mapped reads per mtDNA base (S2B Fig).  Fig 2. mtDNA gene expression is lower in L-haplogroup individuals. The African L-haplogroup shows lower expression of mtDNA-encoded genes than non-Africans We asked whether certain mtDNA SNPs associate with differential expression levels of mtDNA-encoded genes. Since we analyzed multiple mtDNA SNPs (including both singletons and lineage-defining SNPs), Bonferroni correction for multiple testing was applied. As mentioned above, initial analysis was performed while randomly dividing the samples into two groups while retaining the proportions of gender and ethnicity. Such analysis, using the personalized mapped samples, revealed correlation between certain SNPs and a distinct expression pattern. Close inspection revealed that all these SNPs corresponded to mtDNA haplogroup L (Fig 2, S1 Table, S2 Table). It is worth noting that analysis based on either the personalized- or rCRS-mapped samples led to comparable expression patterns (S4 Fig). This was despite the fact that the personalized mapping exhibited with excess of mapped reads in L halogroup samples, i.e. a mean of additional 26,197 reads per sample–a 0.09% increase, in the personalized mapping samples. Similarly, there was a slight increase in the number of reads in personalized mapped Caucasian samples, i.e. a mean of additional 5,279 reads per sample–a 0.02% increase. Taken together, regardless of the mapping approach, we conclude that L haplogroup individuals displayed reduced levels of mtDNA gene expression. For the sake of simplicity further analyses were performed using the personalized mapped samples.  Fig 3. The expression of five mtDNA genes that diverged between L- and non-L-haplogroups in replicated association analyses. To control for possible bias underlying the trend towards lower levels of L-haplogroup mtDNA transcript expression, we considered the expression patterns of nDNA-encoded genes in Africans versus non-Africans. We found 2,380 nDNA-encoded genes that are differentially expressed in Africans (S3 Table), yet unlike the mtDNA genes ~54% showed higher expression, while the rest showed lower expression in the African group (S5 Fig). These findings suggest a lack of bias in the expression pattern of mtDNA-encoded transcripts. To control for possible group assignment bias, we randomly re-divided the samples 500 times, while retaining constant proportions of gender and ethnicities. Following group assignment, we repeated the gene expression normalization process and SNP association analysis. Our results revealed that in more than 60% of the replicated divisions, ten mtDNA-encoded genes (MT-TH, MT-TI, M-TL2, MT-CO2, MT-ND2, MT-ND6, MT-CO1, MT-ATP6, MT-ND3 and MT-ND1) consistently showed significantly reduced expression levels in L-haplogroup samples (Fig 3). These results confirm that African L-haplogroup individuals possess a distinct mtDNA gene expression pattern. |
|
|
|
Post by Admin on Dec 24, 2016 20:32:00 GMT
 Fig 4. mtDNA copy numbers do not differ between L-haplogroup and non-L-haplogroup individuals. Since mtDNA transcription and replication are coupled in human mitochondria [41], we included mtDNA copy number as one of the covariates in all our eQTL analyses. Nevertheless, we tested whether the differences in expression levels associated with variations in mtDNA copy numbers. We found that variations in mtDNA copy numbers did not differ between L- and non L-haplogroup mtDNAs (Fig 4). This suggests that the variation we observed in mtDNA gene expression patterns was independent of mtDNA copy numbers, a finding in agreement with previous results [42].  Fig 5. Differential expression of mtDNA genes in different haplogroups within populations. Specific mtDNA haplogroups exhibit with distinct gene expression patterns We reasoned that the highly significant gene expression differences between Africans and Caucasians may mask intra-population expression variation. To address this possibility we repeated the gene expression analysis separately for Caucasians and Africans. Although this analysis did not reveal any significant intra-population differences while considering the long RNA dataset (S4 Table, S5 Table), our results indicate that in Africans, individuals belonging to haplogroup L3b had significantly higher expression of cysteine tRNA (Fig 5A and S6 Table). While analyzing the Caucasian samples (Fig 5B–5F and S7 Table), we found that tRNA Leucine (2) had higher expression in individuals belonging to haplogroup U5. Secondly, higher expression of tRNA arginine was found in individuals belonging to haplogroup T. Finally, tRNA glycine had higher expression level in individuals sharing SNPs that define haplogroup cluster WI, in individuals harboring a guanine as compared to those having an adenine allele in mtDNA position 10,398 (shared by haplogroups J, K and I), and in individuals with either an adenine or a cytosine in mtDNA position 16,129 as compared to those with a guanine in this position. Hence, our intra-population analysis revealed much significant variation in mtDNA gene expression that was previously masked by the more prominent differential expression between Africans and Caucasians. Such differences may stem, at least in part, from variation in the impact of certain alleles on gene expression, depending on their linked haplotypes (Fig 6). This is best exemplified by the relatively high expression of tRNA glycine in Caucasian haplogroup cluster WI individuals (with the 12,705T allele) as compared to individuals with the 12,705C allele (see also Fig 5D); all Africans harbor the 12,705T allele, which exhibits even lower tRNA glycine expression than the Caucasian 12,705C allele. The latter caused lack of significance while calculating the impact of 12,705 SNPs on gene expression considering Africans and Caucasians together (Fig 6B). Taken together, the impact of mtDNA SNPs on gene expression differences is modified, at least in part, by their linked genetic background.  Fig 6. Masking of mtDNA expression differences within populations. A recent study of mitochondrial activity in six cell lines sharing the same nDNA but diverging in their mtDNAs (i.e., cybrids), revealed differences in activity and transcript abundance among three L-haplogroup and three H-haplogroup cybrids [23]. Similarly, Gomez-Duran and colleagues identified expression pattern differences between haplogroup H cybrids when compared with those of the haplogroup Uk, 5 cell lines each [22]. Since we studied a much larger sample size from highly diverse individuals, we argue that our study better represents the natural population rather than focusing on specific haplogroups. This further underlines the future need to expand our study to include Asians so as to shed further light on mitochondrial regulatory differences from a world-wide perspective. Once cybrid technology has been adapted for high throughput analysis, it would be of interest to apply our genomic analysis to a large collection of cybrids with diverse mitochondrial genomes. Since the distinct L-haplogroup mtDNA expression pattern was shared between tRNAs and long RNAs that are encoded by both mtDNA strands, it is plausible that the observed differences stem either from early stage transcription or from polycistron stability. Alternatively, since expression pattern differences were limited to certain mtDNA-encoded genes, the underlying mechanism could involve differences in the RNA stability of the mature transcripts or during transcript maturation, as previously suggested [50]. With this in mind, both analysis of co-expressed nDNA-encoded genes and our eQTL association study revealed that RNA-binding proteins with mitochondrial function (i.e., PTCD1 and MRPS7) best explain the distinct mtDNA gene expression patterns of L-haplogroup individuals. Although a lack of association with SNPs in the vicinity of known mtDNA transcription regulators was observed, one cannot exclude future detection of such association when more mtDNA transcription regulators are identified. Cohen T, Levin L, Mishmar D (2016) Ancient Out-of-Africa Mitochondrial DNA Variants Associate with Distinct Mitochondrial Gene Expression Patterns. PLoS Genet 12(11): e1006407. |
|
|
|
Post by Admin on Dec 30, 2016 20:27:20 GMT
 West Eurasian haplogroups such as J and R1b can be found in East Africa at low to moderate frequencies as a result of ancient migrations from the Arabian Peninsula to the region. The haplogroup chart shows J1 and J2 make up 21.6% in Cushitic speakers in Ethiopia and the combined frequency of J haplotypes increases to 26.6% in Ethiopian Semitic speakers. The West Eurasian backflow mostly affected East Africa and Llorente et al. (2015) estimated that the proportion of West Eurasian ancestry is up to 50% in Amhara and Tygray peoples in Ethiopia. Moreover, 4-5% of Ethiopians also belong to Y-DNA haplogroup T, which has been found in two 7,500–6,800 ybp individuals from Karsdorf, Sachsen-Anhalt, Germany. T1a constitutes 22.2% of all ancient samples between 7,500 and 6,800 ybp in Germany and the Eurasian backflow into Africa came from a population closely related to Early Neolithic farmers, who had colonized Europe 4,000 years earlier. We compared Mota to contemporary human populations (6). Both Principal Component Analysis (Fig. 1A) and outgroup f3 analysis using Ju|’hoansi (Khoisan) from Southern Africa as the outgroup (Fig. 1B,C) place this ancient individual close to contemporary Ethiopian populations, and more specifically to the Ari, a group of Omotic speakers from southern Ethiopia, to the West of the highland region where Mota lived. Our ancient genome confirms the view that the divergence of this language family results from the relative isolation of its speakers (8), and indicates population continuity over the last ~4,500 years in this region of Eastern Africa.  Fig. 1. Mota shows a very high degree of similarity with the highland Ethiopian Ari populations. The age of Mota means that he should predate the West Eurasian backflow, which has been dated to ~3,000 years ago (3, 4). We formally tested this by using an f4 ratio estimating the West Eurasian component (6), following the approach adopted by Pickrell et al. (3). As expected, we failed to find any West Eurasian component in Mota (Table S5), thus providing support for previous dating of that event (3, 4). Given that Mota predates the backflow, we searched for its most likely source by modelling the Ari, the contemporary population closest to our ancient genome, as a mixture of Mota and another West Eurasian population (6). We investigated both contemporary sources (3) as well as other Eurasian ancient genomes (5, 9). In this analysis, contemporary Sardinians and the early Neolithic LBK (Stuttgart) genome stand out (Fig. 2A). Previous analyses have shown Sardinians to be the closest modern representatives of early Neolithic farmers (10, 11), implying that the backflow came from the same genetic source that fuelled the Neolithic expansion into Europe from the Near East/Anatolia, before recent historic events changed the genetic makeup of populations living in that region. An analysis with haplotype sharing also identified a connection between contemporary Ethiopians and Anatolia (4, 12). Interestingly, archaeological evidence dates the arrival of Near Eastern domesticates (such as wheat, barley and lentils) to the same time period (circa 3,000 years ago) (13, 14), suggesting that the direct descendants of the farmers that earlier brought agriculture into Europe may have also played a role in the development of new forms of food production in the Horn of Africa.  Fig. 2. Quantifying the geographic extent and origin of the West Eurasian component in Africa. Using Mota as an unadmixed African reference and the early farmer LBK as the source of the West Eurasian component, it is possible to reassess the magnitude and geographic extent of historical migrations, avoiding the complications of using admixed contemporary populations (6). We estimated a substantially higher Eurasian backflow admixture than previously detected (3), with an additional 4-7% of the genome of most African populations tracing back to a Eurasian source, and, more importantly, we detected a much broader geographical impact of the backflow, going all the way to West and Southern Africa (Fig. 2B). Even though the West Eurasian component in these regions is smaller than in Eastern Africa, it is still sizeable, with Yoruba and Mbuti, who are often used as African references (15, 16), showing 7% and 6%, respectively, of their genomes to be of Eurasian origin (Table S5). Since Mota predates recent demographic events, his genome can act as an ideal African reference to understand episodes during the out-of-Africa expansion. We used him as the African reference to quantify Neanderthal introgression in a number of contemporary genomes (6). Both Yoruba and Mbuti, which are routinely used as African references for this type of analysis (15, 16), show a marginally closer affinity with Neanderthal than Mota based on D statistics, and an f4 ratio analysis detected a small Neanderthal component in these genomes at around 0.2-0.7%; greater than previously suggested (16), and consistent with our estimates of the magnitude of their Western Eurasian ancestry (6). While the magnitude of Neanderthal ancestry in these contemporary African populations is not enough to change conclusions qualitatively (estimates of Neanderthal ancestry in French and Han only increased marginally when tested with Mota as a reference), it should be accounted for when looking for specific introgressed haplotypes (17) or searching for unknown ancient hominins who might have hybridized with African populations (18). Science 13 Nov 2015: Vol. 350, Issue 6262, pp. 820-822 |
|
|
|
Post by Admin on Feb 26, 2017 20:19:24 GMT
 Paternal lineage composition in North African populations The paternal lineage distribution in North African populations was compared to neighboring European and Levantine groups (Figure 1A) using 302 new North African samples from Libya and Morocco (Figure S2, Table S4). As previously reported [28]–[30], [39], the two specific North African haplogroups, E1b1b1a-M78 and E1b1b1b-M81, are predominant in North African populations. The second most frequent haplogroup was J, which has been postulated to have a Middle Eastern origin [33]. Both J sub-branches, J-M267 and J-M172, were observed in North Africans. Contour maps of haplogroup frequencies show that haplogroup E-M81 is frequent in Northwest Africa but declines towards Egypt and the Levant (Figure 1B). On the other hand, E-M78 and E-M123 are frequent in the Levant and Egypt and decline towards Northwest Africa (Figure 1C and D, respectively). The Middle Eastern haplogroups J-M267 and J-M172 were observed in all samples, although with different distributions. J-M267 (Figure 1E) is prevalent in all North African and Levantine groups, whereas J-M172 is primarily distributed in the Levant and sporadically detected in North Africa and Iberia (Figure 1F).  Figure 1. Frequency of the major Y-chromosome haplogroups in North Africa and surrounding regions. Intensity of the colors reflects the frequency of a haplogroup in the studied populations. A) Location of the analyzed populations. B–F) Frequency distribution of haplogroups E-M81, E-M78, E-M123, J-M267, and J-M172 respectively. E-M78 network (Figure S3B) reveals high diversity within the haplogroup. This clade is mostly found in Middle Eastern populations and Northeastern Africans (27% in Libya and 33% in Egypt). Diversity values within haplogroup E-M78 are higher than for E-M81 (0.9903 ± 0.0017 and 4.1361 ± 2.0666, for HD and MPD respectively). Network analysis of the J-M267 included 448 haplotypes, mostly from Middle Eastern populations (Figure S3D). J-M267 was found in all North Africans except the Tuareg. All North Africans also shared the modal haplotype with the Levantines. Diversity estimates within haplogroup J-M267 were 0.9524 ± 0.0067 and 2.9387 ± 1.5428 for HD and MPD, respectively. Haplogroup J-M172 was frequent in Middle Eastern groups (73.9%), and less in Europeans (18.5%) and North Africans (7%) (Figure S3C). J-M172 network shows that clusters are shared mostly between Middle Easterners and Europeans and that most North African lineages stem out from Middle Eastern clusters. North African paternal population structure Comparison of the studied populations was first carried out using principal component analysis (PCA) on haplogroup frequencies shown in Table S2. The first two components account for 55.35% of the variation and reveal a strong geographical clustering of the populations analyzed (Figure 2A). The first component separates sub-Saharan Africans which have higher frequencies of B-M60 A-M91, E-M2, and E*-M96 haplogroups. The first component also shows clustering of the Europeans characterized by R*-M207 and I-M170 and Middle Easterners which have higher frequencies of E-M78, E-M123, J-M267, and J-M172. The second component separates all North African populations except Egyptians from all other populations and shows that E-M81 plays a major role in this structure. The Tuareg appear to be drawn towards sub-Saharans while Egyptians clustered with Middle Easterners close to Palestinians  Figure 2. Y-chromosome population structure. A) Principal component analysis of haplogroups frequencies. B) Multidimensional scaling plot based on RST distances between populations derived from Y-STR data. Genetic affinity between the studied groups was further investigated by calculating pairwise genetic distances (RST) using Y-STR haplotypes. The MDS (Figure 2B) shows a geographical clustering similar to the PCA. The first dimension splits the sub-Saharan Africans from all other populations. The North Africans cluster close to Middle Easterners with Tuareg drawn towards sub-Saharans and Egypt close to Palestinians. We have further investigated the genetic structure found in North Africa by implementing AMOVA on different geographical clusters (Table S3). A significant genetic heterogeneity was found when all populations were considered as a single group (15.17% for haplogroups and 11.15% for haplotypes). For comparisons with the mtDNA results from Fadhlaoui-Zid et al [45], two groups were considered in each analysis taking into consideration current geopolitical boundaries. Results show significant variance among groups when Morocco, Algeria and Tunisia were pooled in one group and Libya, Tuareg, Egypt and the Middle East pooled in the second group. Variance among groups decreases but remains significant when Libyans and Tuareg are added to the first group. Conversely, significant differences between groups are lost when Egyptians are added to the North African group (Table S3). This result is also reflected in the PCA and MDS and shows Egypt's strong affinity to the Middle East rather than to North Africa.  Figure 3. BATWING population splitting tree. Numbers on branches show partition posterior probability. To examine population relations and the time depth in which the North African structures have emerged, we employed BATWING to create hypotheses on historical population splitting and coalescent events. BATWING results show that North Africans form their own branch, which is close to Middle Easterners (Figure 3). Egypt appears on the Middle East branch rather than with other North Africans, again in agreement with previous analyses. Our results show that most North Africans emerged around 15,000 ya during the post Last Glacial Maxima warming period (Table S5). Tunisians (Chenini-Douiret Berbers) show older dates and appear to have Paleolithic common ancestors with other North Africans. Population structure within North Africa starts with the splitting of Egypt around 2,800 ya. Tuareg split next from North Africans around 1,900 ya, followed by the remaining North Africans splitting around 1,000-1,300 ya. |
|

