|
|
Post by Admin on Feb 10, 2017 20:22:04 GMT
Global Patterns of Variation in Pigmentation Genes To confirm and investigate further the patterns we observed in our original samples, we typed the 5 SNPs showing elevated FST values relative to empirical distributions in 53 additional populations from the CEPH-Diversity Panel (Cann et al. 2002). Allele frequencies for each of these can be found in supplementary table 2 (Supplementary Material online), whereas figure 3A–E illustrates their global allele frequency distributions. 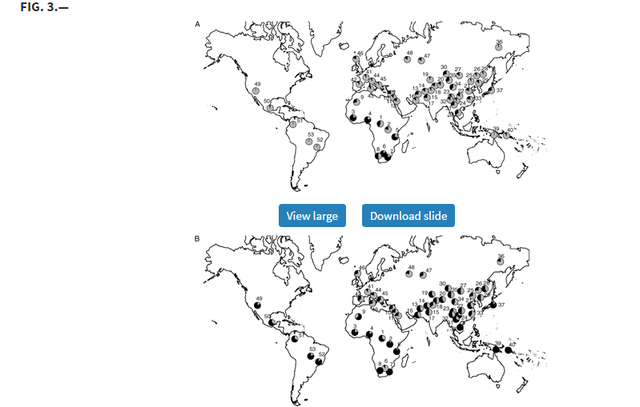 Distribution of allele frequencies in the CEPH-Diversity Panel for the 5 SNP showing elevated pairwise FST values for at least one population pair in our original population screen: (A) ASIP A8818G, (B) OCA2 A355G, (C) TYR A192C, (D) MATP C374G, and (E) SLC24A5 A111G. On all maps, gray shading corresponds to the frequency of the allele associated with lighter pigmentation. The numbered populations correspond to the following: 1) Biaka pygmies, 2) Mbuti pygmies, 3) Mandenka, 4) Yoruba, 5) Bantu N.E., 6) San, 7) Bantu S.E., 8) Bantu S.W., 9) Mozabite, 10) Bedouin, 11) Druze, 12) Palestinian, 13) Brahui, 14) Balochi, 15) Hazara, 16) Makrani, 17) Sindhi, 18) Pathan, 19) Kalesh, 20) Burusho, 21) Han, 22) Tujia, 23) Yizu, 24) Miaozu, 25) Orogen, 26) Daur, 27) Mongola, 28) Hezhen, 29) Xibo, 30) Uygur, 31) Dai, 32) Lahu, 33) She, 34) Naxi, 35) Tu, 36) Yakut, 37) Japanese, 38) Cambodian, 39) Papuan, 40) NAN Melanesian, 41) French, 42) French Basque, 43) Sardinian, 44) Northern Italian, 45) Tuscan, 46) Orcadian, 47) Adygei, 48) Russian, 49) Pima, 50) Maya, 51) Columbian, 52) Karitiana, 53) Surui. The pattern of diversity at ASIP 8818*G allele (the ancestral allele associated with darker pigmentation) indicates a role primarily in African/non-African divergence (sub-Saharan African frequency: 66%, all other populations: 14%) rather than between darkly and lightly pigmented populations. At OCA2 355, the derived allele (linked with lighter pigmentation) occurs at its highest frequencies across Europe and Asia but is also relatively common among Native American populations (18–34%) and is present at much lower frequencies (0–10%) among Bantu-speaking African groups. In contrast, the ancestral allele associated with dark pigmentation has a shared high frequency in sub-Saharan African and Island Melanesians. A notable exception is the relatively lightly pigmented San population of Southern Africa where the derived allele predominates (93%), although this may be simply due to small sample size (n = 14). 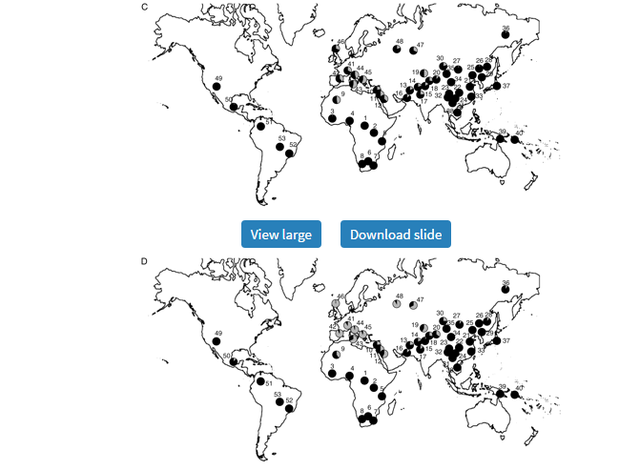 The distributions of the derived and ancestral alleles at TYR A192C, MATP C374G, and SLC24A5 A111G are consistent with the FST results suggesting strong European-specific divergence at these loci. The derived allele at TYR, 192*A (previously linked with lighter pigmentation [Shriver et al. 2003]), has a frequency of 38% among European populations but a frequency of only 14% among non-Europeans. The differences between Europeans and non-Europeans for the MATP 374*G and SLC24A5 111*A alleles (both derived alleles associated with lighter pigmentation) were even more striking (MATPEuropean = 87%; MATPnon-European = 17%; SLC24A5European = 100%; SLC24A5non-European = 46%). The frequency of the SLC24A5 111*A allele outside of Europe is largely accounted for by high frequencies in geographically proximate populations in northern Africa, the Middle East, and Pakistan (ranging from 62% to 100%). 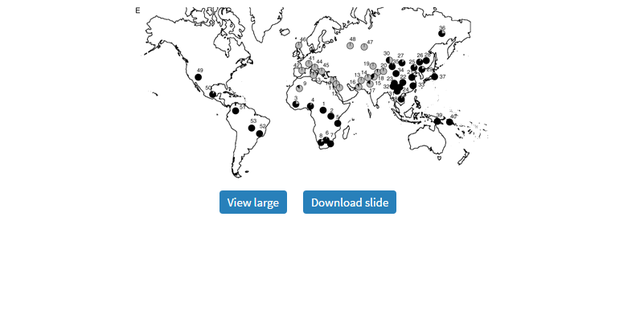 SLC24A5 A111G |
|
|
|
Post by Admin on Apr 8, 2017 19:57:35 GMT
 Pigmentation of human skin is highly diverse between and within human populations; it varies in color, due to differences in type, amount and distribution of melanin pigment present in skin melanocytes, and it varies in skin type determined by its UV sensitivity (1). Many genes have been assigned to this highly complex and polygenic human trait (2). With the latest genetic approaches, such as genome-wide association studies (GWASs), many single nucleotide polymorphisms (SNPs) from several genes were identified to be statistically significant when associated with variation in human skin pigmentation (3–7). Among the most well-known and confirmed pigmentation genes are OCA2, HERC2, ASIP, IRF4, MC1R, TYR, TYRP1, SLC45A2 and SLC24A5 (8). Recently, a candidate-gene approach study identified several SNPs that are suggested to be involved in skin pigmentation pathways, most notably rs10756819 located in the BNC2 gene (9). Another SNP in this gene (rs2153271) was previously found to be associated with freckling (10), and more recently BNC2 was also identified to be associated with skin pigmentation in East Asian populations (7). Human skin color is widely assumed to have evolved in humans via adaptation to sunlight as a result of the Out-of-Africa migration of modern humans (11,12). Indeed, signatures of positive selection were successfully identified in several human pigmentation genes (13–15), supporting this hypothesis. The BNC2 gene was most recently highlighted as one of the genes present in regions of the human genome that show increased levels of Neanderthal ancestry (16,17), suggesting that Neanderthals provided modern humans with adaptive variation for skin phenotypes involving BNC2 (17). Basonuclin 2 (BNC2) is one of the most evolutionary-conserved DNA-binding zinc-finger proteins expressed in many human tissues, including epithelial and germ cells. BNC2 consists of three separated pairs of zinc fingers, a nuclear localization signal and a serine-rich region. Due to its very high conservation status, the function of BNC2 is suggested to be essential. BNC2 is most likely involved in mRNA splicing or other forms of mRNA processing (18,19), but it has also been suggested to function as a transcription factor (20). BNC2 has six promoters and at least 23 (alternative) exons, therefore theoretically resulting in a large number of almost 90 000 possible isoforms, encoding for over 2000 different proteins. The main human BNC2 isoform is predicted to encode a 1099 residue protein with a molecular mass of 122 kDa, but depending on the isoform this can vary tremendously (21). BNC2 is detected in all layers of the human epidermis, where it resides in nuclear speckles (22), while its paralog BNC1 is uniformly present in nuclei and was found to be confined to the basal cells of stratified squamous epithelia (22).  Figure 1. Our first aim was to ascertain the involvement of BNC2 in human skin pigmentation by investigating the transcriptional status of BNC2 in relation to the pigmentation phenotype of the skin epidermal samples. RNA and DNA were co-extracted from the epidermal layers, and mRNA levels of BNC2 in the individual skin epidermal samples were measured using quantitative (q) reverse-transcriptase (RT)–PCR. We observed higher expression levels of BNC2 in the dark skin-colored sample group as compared with the BNC2-expression levels in the light skin-colored sample group (Fig. 1A, P < 0.002). However, the basal layer of the human epidermis consists of keratinocytes and melanocytes, in a ratio of 5:1; overall, the keratinocyte percentage in the epidermal layer is even higher (∼95%). Every melanocyte in the basal layer is associated with ∼36 keratinocytes in the epidermis using their dendrites to transport pigment-containing melanosomes to the keratinocytes (33). Previously, it was shown that in zebrafish bnc2 is expressed in hypodermal cells adjacent to the pigment cells, thereby providing an important environment for pigment cell survival (25,26). Extrapolating from these results, it was recently suggested that BNC2 is involved in freckle formation in humans by signaling from keratinocytes to melanocytes (34). In order to investigate whether the observed differential BNC2-expression signal in the skin epidermal sample set originates from either the melanocytic or the keratinocytic content, we measured the mRNA levels of BNC2 in our melanocytic cell line system and, in addition, in human keratinocytic RNA (HEKa, obtained from ScienCell, cat# 2115). This revealed that in humans BNC2 is expressed at least 10 times higher in melanocytes than in keratinocytes (Fig. 1B, P < 0.002). Furthermore, the expression of BNC2 is higher in the dark and moderately pigmented cells, when compared with the expression of BNC2 in the light-pigmented cells (Fig. 1B, P < 0.00004). Expression levels of BNC2 were very low in MCF7 control cells as may be expected (Fig. 1B). From these results, we conclude that the BNC2 gene is expressed in melanocytes, it is differentially expressed between light and dark skin epidermal samples, and this corresponds with the finding that BNC2-expression levels are higher in the dark-pigmented melanocytic cell lines than in the light-pigmented melanocytic cell lines. Furthermore, the expression of BNC2 is at least 10-fold higher in human skin melanocytes when compared with human skin keratinocytes, suggesting that BNC2 has a role in skin pigmentation from within the melanocytic unit of the human epidermis, which is cell autonomous for the melanocytes as opposed to what was suggested previously for zebrafish in which bnc2 acts on the pigment cells from the surrounding hypodermal cells (25,26). We therefore consider our melanocytic system a proper system for the investigation of the variation in transcriptional regulation of BNC2. |
|
|
|
Post by Admin on Apr 9, 2017 20:15:34 GMT
 Figure 2. As rs10756819 was identified as a pigmentation-associated SNP by a candidate-gene approach that only used SNPs located within genes, and not in intergenic regions, we reasoned that rs10756819 might be in linkage disequilibrium with the actual causal DNA variant, which was not previously found due to the applied study design (9). We therefore investigated the SNPs that are in high (R2 > 0.6) linkage disequilibrium with rs10756819 (Supplementary Material, Fig. S4a, LD plot, and LD SNPs are listed in Supplementary Material, Table S3a); these so-called LD SNPs are located within a narrow frame of 70 kb overlapping the 5′ part of BNC2 (Fig. 2A). Notably, this LD region is overlapping the LD region of the freckling-associated SNP rs2153271 (10). Most of the LD SNPs are not associated with any chromatin marks indicative of regulatory potential, although rs2153271 and rs10810650 flank a region of high H3K27Ac enrichment and DNaseI hypersensitivity corresponding to the BNC2 promoter region (Fig. 2A). Interestingly, two LD SNPs, rs10810657 and rs12350739, are located in a region 14 kb upstream of the first and canonical BNC2 promoter (see Fig. 2C), which is characterized by the presence of H3K27Ac peaks that are differential between LP22 and DP74, a melanocyte DNaseI hypersensitive signal and a strong conservation signal. Furthermore, an enhancer element was predicted within this region (41) (Fig. 2C), indicating that this region might be an enhancer with one or two pigmentation-associated SNPs included. The rs12350739-A-derived allele is most common in Europeans (57%), very rare in Sub-Saharan Africans (1%), and absent in East Asians as is evident from the 1000 Genomes project data (43). The rs10810657-A-derived allele, however, is found in all populations; its frequency is highest in Europeans (60%) and lowest in sub-Saharan Africans (13%) (43). Remarkably, rs12350739 is classified as a “regulatory region variant”, whereas rs10810657 is classified as an “intergenic variant” by the Sequence Ontology project (44,45). To study the functional potential of these two identified LD SNPs, we investigated the correlation between their genotypes and the BNC2-expression patterns of the skin epidermal sample set. DNA samples were used for genotyping of the three SNPs (Supplementary Material, Table S4), while expression levels of BNC2 were measured in the skin epidermis samples by quantitative (q) RT–PCR at exon 5–6. We found a strong correlation between the expression levels of BNC2 and the genotypes of rs10810657 and rs12350739 (Fig. 3B and C, P < 0.05). We also tested the pigmentation-associated SNP rs10756819 and found that the expression levels of BNC2 did not significantly correlate with the genotypes of this SNP (Fig. 3A), supporting the observation that rs10756819 does not coincide with a region that contains regulatory potential for BNC2, and is therefore most likely not the causal variant for the variation in BNC2 transcription. Rs10810657 and rs12350739 are in high LD with each other (R2 > 0.8, Supplementary Material, Fig. S4B and S4C and Tables S3B and C); therefore, combinatorial analysis of the rs10810657 and rs12350739 genotypes with the BNC2-expression levels resulted in a slightly higher significant correlation between the genotypes and the BNC2-expression levels (Fig. 3D, P < 0.01).  Figure 3. Taken together, these data point towards the presence of a potential regulatory element 17 kb upstream of BNC2. This region includes two SNPs (rs10810657 and rs12350739) that are in high linkage disequilibrium with the pigmentation-associated SNP rs10756819. The expression levels of BNC2 correlate strongly with the genotypes of rs10810657 and rs12350739, suggesting that the region around these SNPs potentially acts as an enhancer element. We have identified rs12350739 as the causal, i.e. regulatory DNA variant for the BNC2 skin color effect by studying the linkage partners of rs10756819, the particular BNC2 SNP that was previously found to be highly associated with skin pigmentation (9). It can be argued however, that other linkage SNPs are contributing to the variation in transcriptional regulation of BNC2. We have investigated the region containing the LD block in detail, considering the hallmarks of active enhancers, and found that only three SNPs are located in the vicinity of potentially regulatory regions; rs12350739, rs10810657 and rs2153271. Of these three SNPs, only rs12350739 turned out to be regulatory, and we consider it highly unlikely that other SNPs are functionally contributing to the transcriptional regulation of BNC2 in skin melanocytes. Hum Mol Genet (2014) 23 (21): 5750-5762 |
|
|
|
Post by Admin on Apr 13, 2017 20:09:57 GMT
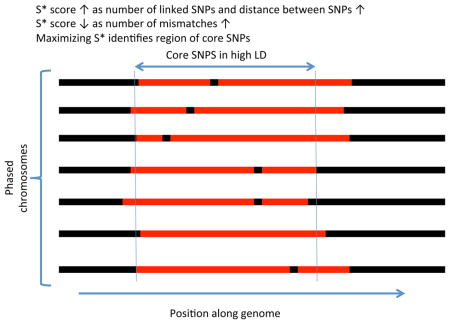 S* is a both a measure of linked disequilibrium in a set of phased chromosomes and a method to discover linked SNPs. We show a region within a sample of phased chromosomes and denote a shared haplotype in red. S* is calculated by optimizing the sum of scores S(i,j) where i and j are two consecutive SNP positions being considered for inclusion in the final haplotype (see Supplementary information S3 (box) for an example). S(i,j) is an heuristic score but it rewards fully linked pairs (no mismatches) and it is higher the further the distance between linked SNPs, thereby rewarding longer haplotypes. Mismatches within the haplotype are noted as black segments internal to the red region, and regions where there is no longer a shared haplotype are noted as black flanking regions. In the process of calculating S* via a dynamic programming method, not only is the optimal score calculated but also the set of SNPs that yield the optimum score, denoted by the two vertical lines defining the boundary of the region determined by S*. Although there is some sharing of haplotypes outside this region, the number of mismatches would make S* suboptimal, and they are therefore excluded. 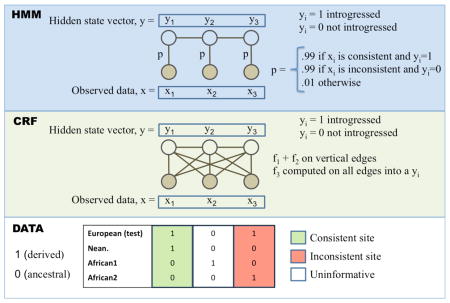 These are two related probabilistic models for estimating the ancestry, yi, of SNPs across a genome sequence. Each yi takes on two possible states, 1 for introgressed (i.e. archaic ancestry) and 0 for not introgressed (i.e. modern human ancestry). The observed data, xi, is a matrix of haplotypes, that in the example consist of whole-genome sequences of individuals from a European test population, an African population (2 haplotypes) and Neanderthals, examined at 3 SNP positions. x1 is a site that is consistent with introgression as the derived allele is seen in the test and Neanderthal sequence but not from Africans. Likewise, x3 is an inconsistent site as the derived allele seems to be of modern human origin, while the site x2 is uninformative. The ancestry states and observed data are connected through the emission probabilities (p) or emission functions (fi) for the HMM or CRF, respectively, denoted by the edges connecting the xi and the yi. The CRF can have more general relationships as denoted by the diagonal edges; in ref. 46, the authors use the sum of three emission functions f1, f2, f3 - f1 scores “consistent” sites 1, f2 scores “inconsistent” sites 1, and f3 evaluates to 1 if the entire test haplotype is relatively closer to the Neanderthal sequences than to the African haplotype. In contrast, the HMM in ref. 4 have fixed emission probabilities, p, for observed states that are either consistent or inconsistent. Edges between the yi and yi+1 states represent transition probabilities (HMM) or more general transition functions (CRF). The transition probabilities and functions model linkage between ancestral states along the genome, and the transition parameters depend on the recombination distance between sites, the admixture proportion and admixture time. Crucially, both of these frameworks have efficient algorithms for inferring the most likely sequence of ancestral states.  Example coalescent genealogy of uniquely shared mutations Several DNA fragments from two modern populations (pink and light-blue chromosomes) are sequenced. A diploid sequence is also obtained from an extinct archaic population (yellow chromosomes) that split from the population tree more anciently than the two modern populations split from each other. Uniquely shared mutations (red stars) occur in the archaic population, but are passed on to the ancestors of the light-blue modern population via admixture (dashed line). These are then are swept to high frequency by selection, producing a shallow local coalescent genealogy. This process results in sites with high-frequency derived alleles in the light-blue samples that are present in the archaic sample but not the pink samples from the other modern population. Mutations in the genealogy that are not uniquely shared are shown as green stars.  Pigmentation In region p21.31 of chromosome 3, there is a 200kb haplotype of Neanderthal origin that has a high frequency (> 49%) in the East Asians sequenced as part of the 1000 Genomes Project7. The introgressed region shows very high LD and significantly high values of the iHS statistic49, which measures extended haplotype homozygosity and is a hallmark of a recent selective sweep. However, as mentioned before, it is unclear how the iHS score would be affected by admixture in the absence of selection. One of the most likely targets of selection is a nonsynonymous SNP in the gene HYAL2, involved in the cellular response to ultraviolet radiation. The SNP is absent in other non- African populations, so it appears to have been lost in the ancestors of Eurasians after migrating out of Africa, but was regained in East Asians via admixture with Neanderthals. The authors performed a bootstrapped phylogenetic analysis to support the shared ancestry of the haplotype with the Neanderthal sequence and obtained a significant p-value for the observed LD value compared to a null model without introgression. Its frequency distribution shows a weak latitudinal gradient, suggesting it was involved in the adaptive response to ultraviolet radiation as modern humans expanded throughout Asia7. A putative signal of adaptive introgression in East Asians in HYAL2 has also been identified using the CRF framework47. BNC2 seems to be a strong candidate for adaptive introgression, as shown in two genome-wide archaic ancestry analyses23, 47. Sankararaman et al.47 applied the CRF model to detect introgressed segments, and then inferred selection based on departures from a null model of neutrally introgressed alleles. Vernot and Akey23 also found the introgressed region using S*, then confirmed its ancestry by matching it with the Neanderthal genome, and finally inferred selection by observing that the region has high differentiation between Europeans and Asians, as measured by FST. A BNC2 SNP is associated with skin pigmentation76 and freckling in Europeans77, and the archaic haplotype is present at 70% frequency in Europeans, while it is absent in Asians. Interestingly both studies also found a strong adaptive introgression signal in a cluster of keratin genes on chromosome 12 in both Asians and Europeans23, 47. Two neighboring genes (POU2F3 and TMEM136) have significant evidence for adaptive introgression in East Asians only, again based on the two genome-wide archaic ancestry analyses23, 47 (see above). POU2F3 is a transcription factor that mediates keratinocyte differentiation and proliferation, and the archaic haplotype is at 66% frequency in East Asians but almost absent in Europeans. TMEM136 codes for a transmembrane protein, but little information is available about its function.47 Ding et al.78 identified an introgressed haplotype of Neanderthal origin in Eurasians carrying a loss-of-function variant (Val92Met) in the gene MC1R, which encodes a melanocyte stimulating hormone receptor. This gene is known to affect hair color in mice79 and is associated with red hair, freckles and type I/II fair skin type in humans80, 81. The region, however, shows no significant departures from neutrality at the introgressed region in Europeans or East Asians, using either Tajima’s D52, Fu and Li’s test82, or iHS49, presumably because the frequency of the archaic haplotype only ranges from 5–22%. In addition, the lossof- function mutation (Val92Met) is not actually seen in the high-coverage Neanderthal genome4, despite being almost exclusively observed within haplotypes inferred to be introgressed from Neanderthals in Eurasian populations. The variant is also present in 3 African HapMap samples83, which weakens the argument for introgression into Eurasians, unless the variant was later introduced into Africans via admixture from Eurasians. Intriguingly, the same variant is found at very high frequencies in Taiwanese aborigines (60–70%), but lack of extensive sequence data at this locus has prevented formal rejection of neutrality at the putatively introgressed haplotype in these populations78. Nat Rev Genet. 2015 Jun; 16(6): 359–371. |
|
|
|
Post by Admin on May 7, 2017 19:32:35 GMT
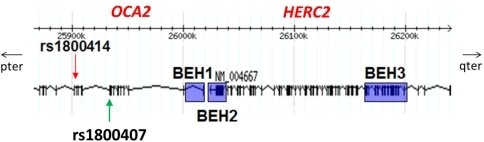 Fig. 1 Schematic of BEHs and rs1800414. This figure shows the approximate locations of the three blue-eye associated haplotypes (blue rectangles) and rs1800414 (red arrow) at OCA2 and HERC2 genes. OCA2 extends farther in the pter direction Mutations in OCA2 are known to cause oculocutaneous albinism type 2. However, the gene is also known to play a role in variation in normal pigmentation. In European populations, it is primarily associated with blue irises. Several sites in and around OCA2 have been reported to be the functional variant or to be tightly linked to the functional variant leading to blue eyes. These sites include a three-SNP haplotype (rs4778138, rs4778241, rs7495174) and four individual SNPs, rs1129038, rs12913832, rs916977, and rs1667394 (Duffy et al. 2007; Sturm et al. 2008; Kayser et al. 2008; Sulem et al. 2007; Mengel-From et al. 2010; Walsh et al. 2010). Four of the SNPs (rs1129038, rs12913832, rs916977, rs1667394) are actually located in introns of the Hect Domain and RCC1-like Domain 2 (HERC2 [MIM 605837]), which are located 10 Kb upstream of OCA2. These are thought either to be located in or near an upstream regulatory region of OCA2 or to be in linkage disequilibrium (LD) with functional elements in HERC2 and affect a possible HERC2 regulation of OCA2. The actual function of HERC2 is unknown but it shows homology to known E3 ubiquitin-protein ligases. One of the HERC2 SNPs (rs1667394) has been associated with blond hair in Europeans (Sulem et al. 2007). Specific polymorphisms and the haplotypes are illustrated in Fig. 1; all 21 SNPs studied are listed in Table 2. The derived allele of another SNP at OCA2, rs1800407, has been associated with green/hazel eyes in Europeans (Branicki et al. 2009). Rs1800407 is an arginine to glutamine missense mutation (Arg419Gln) found in exon 13 of the OCA2 gene. Sturm et al. (2008) concluded that the derived allele of rs1800407 increased the penetrance of the blue eye phenotype associated with the derived allele of rs12913832. The derived allele at a missense SNP (rs1800414, His615Arg) in exon 19 of OCA2 has been reported to be specific to East Asia (Yuasa et al. 2007; Anno et al. 2008). Edwards et al. (2010) showed an association between the derived allele of rs1800414 (C, 615Arg) and lighter skin pigmentation in a sample of individuals of East Asian ancestry from Canada and confirmed their results using an independent sample of Han Chinese. Here we present our results on the global distributions of haplotypes and specific SNPs in the region of OCA2 and HERC2, genes that have been implicated in pigmentation variation in Europeans and East Asians. We also examine the LD between the SNPs and haplotypes of interest. Finally, we use long-range haplotype tests to show that OCA2 is or has been under selection in Europe and the derived allele of rs1800414 is, or has been, under selection in East Asia. Blue-eye associated haplotypes The three haplotype systems we define here are shown in Fig. 1 and Table 3. Duffy et al. (2007) previously identified a three-SNP haplotype system (rs4778138, rs4778241, and rs7495174) associated with blue eyes; for the purpose of this paper, we will refer to this system as BEH1, blue-eye associated haplotype #1. The blue-eye associated allele of BEH1 is ACA, the fully derived haplotype. Sturm et al. (2008) reported that rs12913832 is associated with blue eyes. Since rs1129038 is in nearly complete LD with rs12913832 in all populations, we defined these two SNPs as a haplotype system referred to as BEH2, blue-eye associated haplotype #2. The blue-eye associated allele of BEH2 is TG, both derived alleles. In the HGDP populations, BEH2 will consist of rs12913832 only since rs1129038 is not present in that dataset. We also typed an SNP that occurs between rs12913832 and rs1129038; however, it has not been associated with pigmentation, and is monomorphic on the blue-eye associated allele of BEH2 and was therefore not included in BEH2. Two other SNPs, rs916977 and rs1667394, have previously been associated with blue eyes (Kayser et al. 2008; Sulem et al. 2007). In our data, with the exception of a low frequency haplotype in Africa, rs916977 and rs1667394 are in nearly complete LD. Therefore, we treat them as another haplotype system, BEH3, blue-eye associated haplotype #3. The blue-eye associated allele of BEH3 is CA, again the derived haplotype. In the HGDP populations BEH3 will consist of rs1667394 only since rs916977 is not present in the data set. 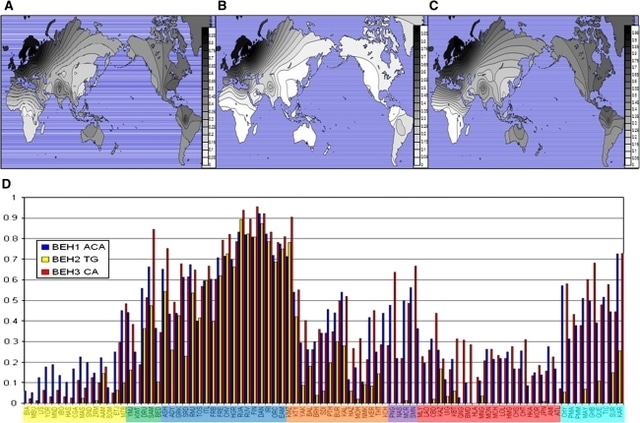 Fig. 2 Global frequencies of blue-eye associated haplotypes. This figure shows the distributions of the blue-eye associated allele/haplotype at the respective BEH1 (a), BEH2 (b), and BEH3 (c) genetic systems graphed on a world map, as well as a comparison of the frequencies in a bar graph (d). In part d, the associated alleles are represented in yellow at BEH1, in blue at BEH2, and in red at BEH3. Here we see that the blue-eye associated allele of BEH2 is mostly limited to Europe, whereas the blue-eye associated alleles of BEH1 and BEH3 are found globally. The populations are divided by regional group on the x-axis as follows: Africa (yellow), Southwest Asia (green), Europe (blue), Central Asia (orange), Pacific Islands (purple), East Asia (red), and Native Americans (teal) |
|

