|
|
Post by Admin on Sept 1, 2017 19:12:13 GMT
 The idea that Africans fail to carry Neanderthal DNA has recently been proven as wrong. Marc Haber, a British geneticist from the Wellcome Trust Sanger Institute in Hinxton, has found that the Touboo in Chad and the Amhara in Ethiopia carry Neanderthal genes. Whereas Eurasians carry ~2% Neanderthal ancestry, Ethiopians carry ~1% Neanderthal ancestry, and Central Africans carried ~0.5% Neanderthal ancestry.  Haber maintains that Africans who carry Neanderthal DNA show gene flow from Eurasians. The detectable Neanderthal DNA in Africans is found among Africans that carry the R1b haplogroup. 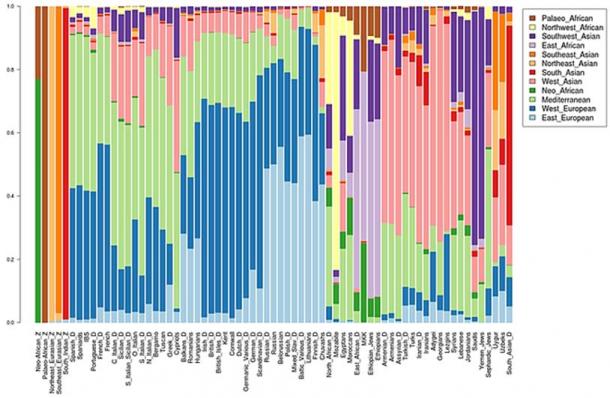 Haber believes that the R1b haplogroup penetrated Central Africa via two migrations. The first migration he believes took place 6000 years ago (6kya), and the second migration around 3kya. The major problem with this theory is that there is no archaeological evidence of a back migration from Eurasia to Africa. |
|
|
|
Post by Admin on Sept 2, 2017 19:18:28 GMT
 The discovery of Eurasian "admixture" among Africans is not a recent discovery. Pickrell et al estimated Eurasian ancestry among Africans from East and South Africa ranged from 2.2-50% and that the Mande people carry 2% Eurasian admixture. This supports the original claim of the authors of the Mota article – i.e. the claim that as much as 6–7% of the ancestry of West and Central African groups was "Eurasian" was not an error.  There are numerous populations in East, South, and West Africa that carry Eurasian admixture. The highest frequency of R1 is found in Western Eurasia. Cruciani et al claim that the pristine form of R1*M173 was found in Africa. The frequency of Y-chromosome R1*-M173 in Africa ranges between 7-95% and Coia et al said that R1-M173 averages 39.5% in Africa. R haplogroups are characterized by R1-M207/M173 genetic background. The Eurasian R haplogroups in Africa include: R1-M269, R-V88, R-L754 (R1b1a) and RL278 (R1b1). 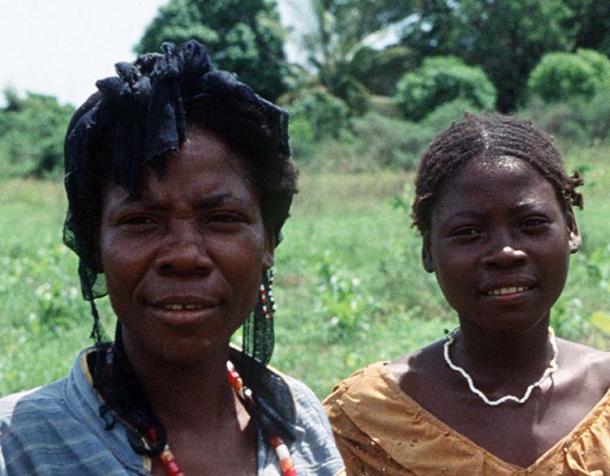 Chadic speakers, while the carriers of V88 among Niger-Congo speakers (predominately Bantu people) range between 2-66% (Cruciani et al, 2010; Bernielle-Lee et al, 2009). Haplogroup V88 includes the mutations M18, V35, and V7. Cruciani et al (2010) revealed that R-V88 is also carried by Eurasians - including the distinctive mutations M18, V35, and V7. |
|
|
|
Post by Admin on Sept 4, 2017 19:00:54 GMT
 Haplogroup R1b1* is found in Africa at various frequencies. Berniell-Lee et al (2009) found in their study that 5.2% carried Rb1* (RL278). The frequency of R1b1* among the Bantu ranged from 2-20%. The bearers of R1b1* among the Pygmy populations ranged from 1-25% (Berniell-Lee et al, 2009). The frequency of RL278 among Guinea-Bissau populations was 12%. The Toubou, Laal, and Sara have frequencies between 20%-34% of RL754 (R1b1a).  The Neanderthal tools found at Jebel Ighoud and Haua Fteah resemble contemporaneous European Neanderthal tools. The presence of Mousterian tools suggest that Neanderthals mixed with Africans because we know that anatomically modern humans were living in the area at the time. 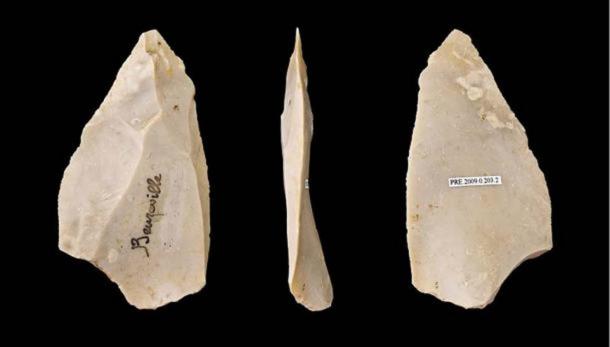 The North African Neanderthal people used the common Levoiso-Mousterian tool kit originally discovered in Europe. Ki-Zerbo said the Neanderthal skeletons came from Djebel Irhoud and El Guettar in Morocco. Later Neanderthal people used the Aterian tool kit. It was probably in Morocco that Neanderthal and Khoisan interacted. |
|
|
|
Post by Admin on Apr 18, 2019 18:20:13 GMT
African genetic diversity is still incompletely understood, and vast regions in Africa remain genetically undocumented. Chad, for example, makes up ∼5% of Africa’s surface area, and its central location, connecting sub-Saharan Africa with North and East Africa, positions it to play an important role as a crossroad or barrier to human migrations. However, Chad has been little studied at a whole-genome level, and its position within African genetic diversity is not well known. With 200 ethnic groups and more than 120 indigenous languages and dialects, Chad has extensive ethnolinguistic diversity.1 It has been suggested that this diversity can be attributed to Lake Chad, which has attracted human populations to its fertile surroundings since prehistoric times, especially after the progressive desiccation of the Sahara starting ∼7,000 years ago (ya).2, 3 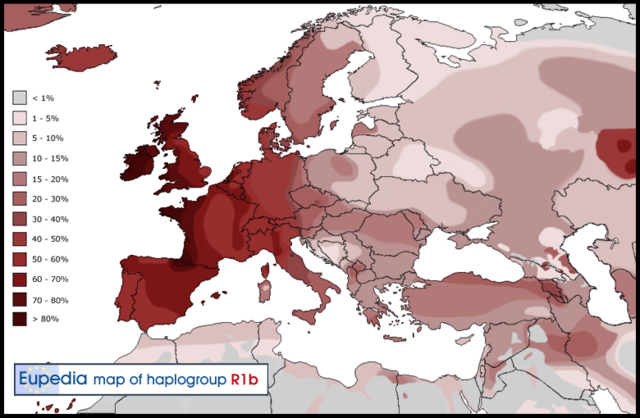 Important questions about Africa’s ethnic diversity are the relationships among the different groups and the relationships between cultural groups and existing genetic structures. In the present study, we analyzed four Chadian populations with different ethnicities, languages, and modes of subsistence. Our samples are likely to capture recent genetic signals of migration and mixing and also have the potential to show ancestral genomic relationships that are shared among Chadians and other populations. An additional major question relates to the prehistoric Eurasian migrations to Africa: what was the extent of these migrations, how have they affected African genetic diversity, and what present-day populations harbor genetic signals from the ancient migrating Eurasians? We have previously reported evidence of gene flow from the Near East to East Africa ∼3,000 ya, as well as subsequent selection in Ethiopians on non-African-derived alleles related to light skin pigmentation.4 A recent attempt to quantify the extent of such backflow into Africa more generally, by using ancient DNA (aDNA), suggested that the impact of the Eurasian migration was mostly limited to East Africa.5 However, previous studies using mitochondrial DNA and the Y chromosome in populations from the Chad Basin found some with an East African6 or Mediterranean and Eurasian influence,7, 8 and analysis based on genome-wide data9 found a non-African component (suggested to be from East Africa) in central Sahelian populations. Thus, studying diverse Chadian populations on a whole-genome level presents an opportunity to shed more light on the history of African-Eurasian mixtures, including whether or not selection after admixture is a widespread phenomenon in Africa and how the historical events in Chad are related to events that have occurred elsewhere in Africa and the Near East. 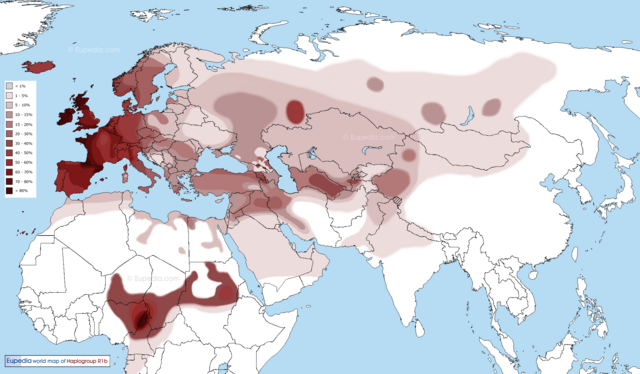 In this work, we present a genetic dataset of 480 Chadian, Near Eastern, and European individuals genotyped at 2.5 million SNPs, in addition to high-coverage whole-genome sequences from 19 of these individuals. From Chad, we studied (1) the Toubou, who are nomads from northern Chad and speak a Nilo-Saharan language; (2) the Sara, who are a sedentary population from southern Chad and also speak a Nilo-Saharan language; (3) the Laal speakers, a population of just ∼750 individuals who speak an unclassified language isolate and live in southern Chad; and (4) an urban population from the capital city of N’Djamena. In addition to the Chadians, we included Greek, Lebanese, and Yemen samples whose location and history suggest that they might be informative about early African-Eurasian migrations. We used this dataset to advance our understanding of human genetic diversity in Africa and neighboring regions by focusing on population migration and mixing and how the admixture process has shaped present-day genetic variation.  Haplogroup R1b-V88 accounts for 20% in Chadic speakers in Cameroon. The genotyping data were merged with data from the African Genome Variation Project,10 the 1000 Genomes Project,11 and Pagani et al.,12 resulting in a combined dataset of ∼1.1 million SNPs in 2,453 samples. Analyses including ancient genomes involved merging the panel described above with the Haak et al. dataset,13 resulting in ∼90,000 SNPs in common. Comparative whole-genome sequences were obtained from Pagani et al.12 and Complete Genomics.14 Genotype data were processed with PLINK:15 the SNP genotype success rate required was set to 99%, whereas SNPs with a minor allele frequency < 0.001 or Hardy-Weinberg p value < 0.000001 were removed. Genotypes from sequence data were called with SAMtools v.1.216 and BCFtools v.1.2 with the command “samtools mpileup -q 20 -Q 20 -C 50 | bcftools call -c -V indels.” Concordance with array genotypes had a rate of 0.999. Phasing was carried out with SHAPEIT17 with 1000 Genomes Project phase 3 haplotypes18 as a reference panel.  Figure 1 Population Locations and Genetic Structure (A) The map shows the location of newly genotyped or sequenced populations. (B) PCA of worldwide populations shows that Near Easterners and East Africans are intermediate to Eurasians and sub-Saharan Africans on PC1. Chad populations are close to sub-Saharan Africans and have some samples drawn toward Ethiopians. (C) Magnification of the African PCA shows different affinities of the Chad populations to other Africans: the Toubou cluster close to Ethiopians, whereas the Sara and Laal speakers are close to the Yoruba. The mixed samples from N’Djamena, the capital, are intermediate to the Toubou, Sara, and Laal speakers. Genetic Structure in Chad Indicates a Complex Admixture History We performed an initial exploration of our dataset by using principal-component analysis (PCA).19 The first component (PC1) captured the genetic differentiation between Africans and Eurasians (Figure 1B). Populations such as the Near Easterners and North and East Africans fell between the Europeans and sub-Saharan Africans. The Chadian groups lay near the sub-Saharan Africans: the Sara and Laal speakers clustered tightly with sub-Saharan Africans, such as the Yoruba, whereas the Toubou were somewhat more distant and appeared drawn toward East Africans, such as the Ethiopians. Samples collected from the capital of Chad, N’Djamena, appeared in a central position between the Toubou cluster and the Sara and Laal cluster (Figure 1C). Many individuals from N’Djamena have not reported their ethnicity or have reported a mixed ethnic origin. Therefore, recent mixture could be responsible for their position on the PCA. We further investigated the genetic variation in Chad by estimating changes in the effective populations size (Ne) over time via the MSMC approach.20 Eurasians and Africans diverged around 60,000–80,000 ya and subsequently had different patterns of population-size changes: in particular, compared with Africans, the Eurasian population experienced a sharp decrease in size ∼60,000 ya.20 We observed this expected pattern in most populations in our dataset (Figure 2), but a few stood out: (1) Egyptians had a population bottleneck that was much more pronounced than that of other Africans but not as sharp as that of Eurasian populations; and (2) the Toubou and Ethiopians shared a very similar pattern during the bottleneck: they were close to other Africans but had a somewhat sharper decrease in population size (Figure 2). We would not expect such different fluctuations in population sizes at 60,000 ya in populations who shared a common origin during this period. For example, all Eurasians trace their origin to a population who exited Africa ∼60,000 ya, and this is reflected in indistinguishable Ne patterns during this period,20, 33 which we also observed in the CEU, Greeks, and Lebanese (Figure 2), as expected. A shared pattern of Ne in ancient times was also observed in the Sara, Laal speakers, and other Africans, such as the Yoruba. We suggest that the deviation from the expected Ne pattern in the Toubou is related to extensive admixture history with Eurasians, like the Eurasian admixture seen in Ethiopians, and we explore this possibility directly with admixture tests below. |
|
|
|
Post by Admin on Apr 18, 2019 18:52:24 GMT
 Figure 2 Population-Size Estimates from Whole-Genome Sequences Population size was inferred by MSMC analysis with four haplotypes from each population. Eurasian populations had a distinctive bottleneck at the time of their exodus from Africa ∼60,000 ya. Compared to other Africans, admixed Africans (from a Eurasian gene flow), such as Egyptians, Ethiopians, and the Toubou, also showed a decline in population size during the same period. Multiple Eurasian Admixtures in Africa after 6,000 ya We have previously reported massive gene flow ∼3,000 ya from Eurasians to Ethiopian populations.4 Here, we reassess the presence of Eurasian ancestry in Africa by using f3 statistics25 in the form of f3(X; Eurasian, Yoruba), where a negative value with a Z score < −4 indicates that X is a mixture of Africans and Eurasians. We found, as expected, that most Ethiopians are a mixture of Africans and Eurasians. An exception is the Gumuz population, where f3(Gumuz; Eurasian, Yoruba) is always positive. The Gumuz language belongs to the Nilo-Saharan family, which could have isolated the Gumuz from the Afro-Asiatic-speaking Ethiopians. However, we found that the Toubou in Chad, who also speak a Nilo-Saharan language, are a mixture of Africans and Eurasians, making f3(Toubou; Eurasian, Yoruba) always significantly negative. This suggests that the impact of Eurasian migrations today extends beyond East Africa and the Afro-Asiatic-speaking populations. We did not detect significant (Z score < −4) Eurasian admixture in the Sara (Nilo-Saharan language family) or the Laal speakers (unclassified language) with the use of f3 statistics (lowest Z score for the Sara was >−2.9; for the Laal speakers, Z scores were all positive). However, this statistic loses sensitivity with small mixture proportions and post-admixture drift,27 so positive values from the f3 statistics do not necessarily reflect a complete absence of admixture. We thus further tested for admixture by using ALDER and MALDER, which assess admixture-induced linkage disequilibrium (LD) and can detect small mixture proportions from a substantially diverged reference possibly missed by the f3 statistic. ALDER detected admixture in the Toubou, Sara, and Laal speakers (Table S2). MALDER, which has the potential to determine whether or not the admixture LD in the population is best represented as the result of one or multiple mixtures, showed that two mixture events had occurred in the Toubou (Figure 3A; Table S3). The first event occurred 2,850–3,500 ya (Z score = 11), a time close to the date of mixture in East Africans 2,500–2,700 ya (Z score = 26). The second mixture event occurred much more recently at 170–260 ya (Z score = 5). In southern Chad, we detected mixture events that were more ancient than those in the north. Mixture occurred 3,900–4,800 ya (Z score = 10) in the Sara and 4,750–7,200 ya (Z score = 5) in the Laal speakers (Figure 3A). These time estimates overlap, and we interpret them as signals from the same admixture event, whose time in the distant past was estimated more reliably in the Laal speakers because they carry more Eurasian ancestry (1.25%–4.5%) than the Sara (0.3%–2%) (see estimates of admixture proportions below), even though the Sara have smaller standard errors because of their larger sample size. In particular, we suggest that the Eurasian mixture event in the Sara and Laal speakers is independent of the mixture event in East Africans and the Toubou for two reasons: (1) admixture LD showed that the events in southern Chad preceded the events in East Africa by 2,000–4,500 years, and (2) we found in Chad a Eurasian Y chromosome lineage (Y haplogroup R1b-V88) that had penetrated all Chadian populations examined but was absent or rare from the Ethiopians examined (Table S4; Figure S1). From whole Y chromosome sequences (Figure S2), we estimate that the Chadian R1b-V88 chromosomes sampled emerged 5,700–7,300 ya (Figure 3B), a time comparable to the Laal speaker admixture dates (4,750–7,200 ya) estimated from genome-wide LD-decay patterns. Figure 3 Timing of the Eurasian Admixture in Africa (A) Crosses represent significant admixture events in the history of the Toubou, Amhara, Sara, and Laal speakers. Time of admixture is estimated from LD by ALDER with all pairs of African-Eurasian populations in our dataset as references. MALDER extends ALDER inference by detecting multiple mixture events, such as in the case of the Toubou population (shown here in green lozenges). (B) A maximum-likelihood tree shows the males belonging to haplogroup R1b in the 1000 Genomes Project and the R1b males in our dataset. The number of samples is shown on each branch tip. We estimate that the Chadian R1b emerged 5,700–7,300 ya, whereas most European R1b haplogroups emerged 7,300–9,400 ya. The African and Eurasian lineages coalesced 17,900–23,000 ya. (C) Putative sources and times of admixture of the Eurasian ancestry in Chad and East Africa. The Sources of Eurasian Backflow into Chad and East Africa Are Correlated Previous studies have suggested that the Eurasian backflow into East Africa came from a population related to early Neolithic farmers.5 We wanted to know whether the Eurasian ancestry we found in the Toubou, which we attribute to a mixture close in time to the date of mixture in East Africans, can be traced to the same source populations that influenced Ethiopia. We performed the tests f3(Toubou; Yoruba, X) and f3(Amhara; Yoruba, X), where X is a present-day non-sub-Saharan African population in our dataset and is related to one that contributed ancestry to the Toubou and Amhara (Z score < −4) (Table S5). We then looked at the correlation of the f3 statistic values between the two tests (Figure 4A). We found that the Eurasian source populations for the Amhara and Toubou were highly correlated (r = 0.98; 95% CI = 0.98–0.99; p value < 2.2 × 10⁻¹⁶) and that the most significant result was for present-day Sardinians. Exceptions to this correlation were the North African populations (Tunisians, Mozabite, Algerians, and Saharawi), who appeared to have contributed more ancestry to the Toubou than to the Amhara. We repeated the tests by using published ancient genomes (Table S6) and also found a high correlation of the Eurasian sources for the Amhara and Toubou (r = 0.98; 95% CI = 0.97–0.99; p value < 2.2 × 10⁻¹⁶); early Neolithic farmers were the most significant contributors, as reported previously5 (Figure 4B). When we substituted the Amhara with other Ethiopians (Wolayta and Oromo), we found similar results (data not shown). In a parallel comparison, we checked whether the sources of the African ancestry in different Near Eastern populations were also correlated. We tested f3(Lebanese; British, X) and f3(Yemeni; British, X) and found a lower correlation of the f3 values (r = 0.62; 95% CI = 0.32–0.80), suggesting a more complicated history of gene flow from genetically different Africans to different populations in the Near East.  Figure 4 Sources of the Eurasian Ancestry in Chad and Ethiopia The plot shows significant Eurasian sources for the Toubou and Amhara according to a three-population test (Z score < −4). An increase in the absolute value of the f3 statistic implies an increase in the genetic affinity of the Eurasian population X to the Toubou and Amhara. (A) With the exception of North Africans, who showed increased affinity to the Toubou, present-day populations showed correlated affinity to both the Toubou and Amhara. Among modern populations, Sardinians showed the highest genetic affinity to both the Toubou and Amhara. (B) Ancient Eurasians also showed correlated affinity to both the Toubou and Amhara; the early Neolithic LBK (Linearbandkeramik, or Linear Pottery) population (∼5,000 BCE) had the highest affinity. We next quantified the proportion of African-Eurasian mixture in the study populations by using two methods: (1) ADMIXTURE26 supervised with K = 2 and the British and Yoruba as ancestral populations and (2) the f4 ratio α = f4(British, chimp; X, Yoruba)/f4(British, chimp; early Neolithic farmer, Yoruba), where X is one of the populations in our dataset (Figure S3). The results from the two tests were highly correlated (r = 0.998; 95% CI = 0.996–0.999; p value < 2.2 × 10⁻¹⁶). Eurasian ancestry was estimated at 26%–30% in the Toubou, 0.3%–2% in the Sara, and 1.2%–4.5% in the Laal speakers. Eurasian ancestry in Ethiopians ranged from 11%–12% in the Gumuz to 53%–57% in the Amhara. African ancestry in the Near East ranged from 7%–14% (Yemen) to 0.7%–5% (Lebanese Christians). |
|
