|
|
Post by Admin on Jul 27, 2023 17:59:33 GMT
Extended Data Fig. 1: Tell settlements and burial sites in Southeastern Europe. a, Aerial view of Tell Măgura Gorgana near Pietrele, Romania (© Konstantin Scheele, German Archaeological Institute, Eurasia Department). b, Detailed view of the 11m stratigraphy at Pietrele (© Svend Hansen, German Archaeological Institute, Eurasia Department). c, Aerial view of Tell Yunatsite, Bulgaria (© Kamen Boyadzhiev). d, Map of the site Orlovka-Kartal, Ukraine. The base map was sourced from Google Earth www.google.com/earth/index.html. e, Characteristic finds from the Eneolithic type-site Usatove. f, Characteristic finds attributed to the Cernavoda I phase. g, Burial in flexed position from grave 10 at Kartal (© Igor Bruyako). h, Infant urn-burial from the Early Bronze Age layer south of tell Yunatsite (© Kamen Boyadzhiev). 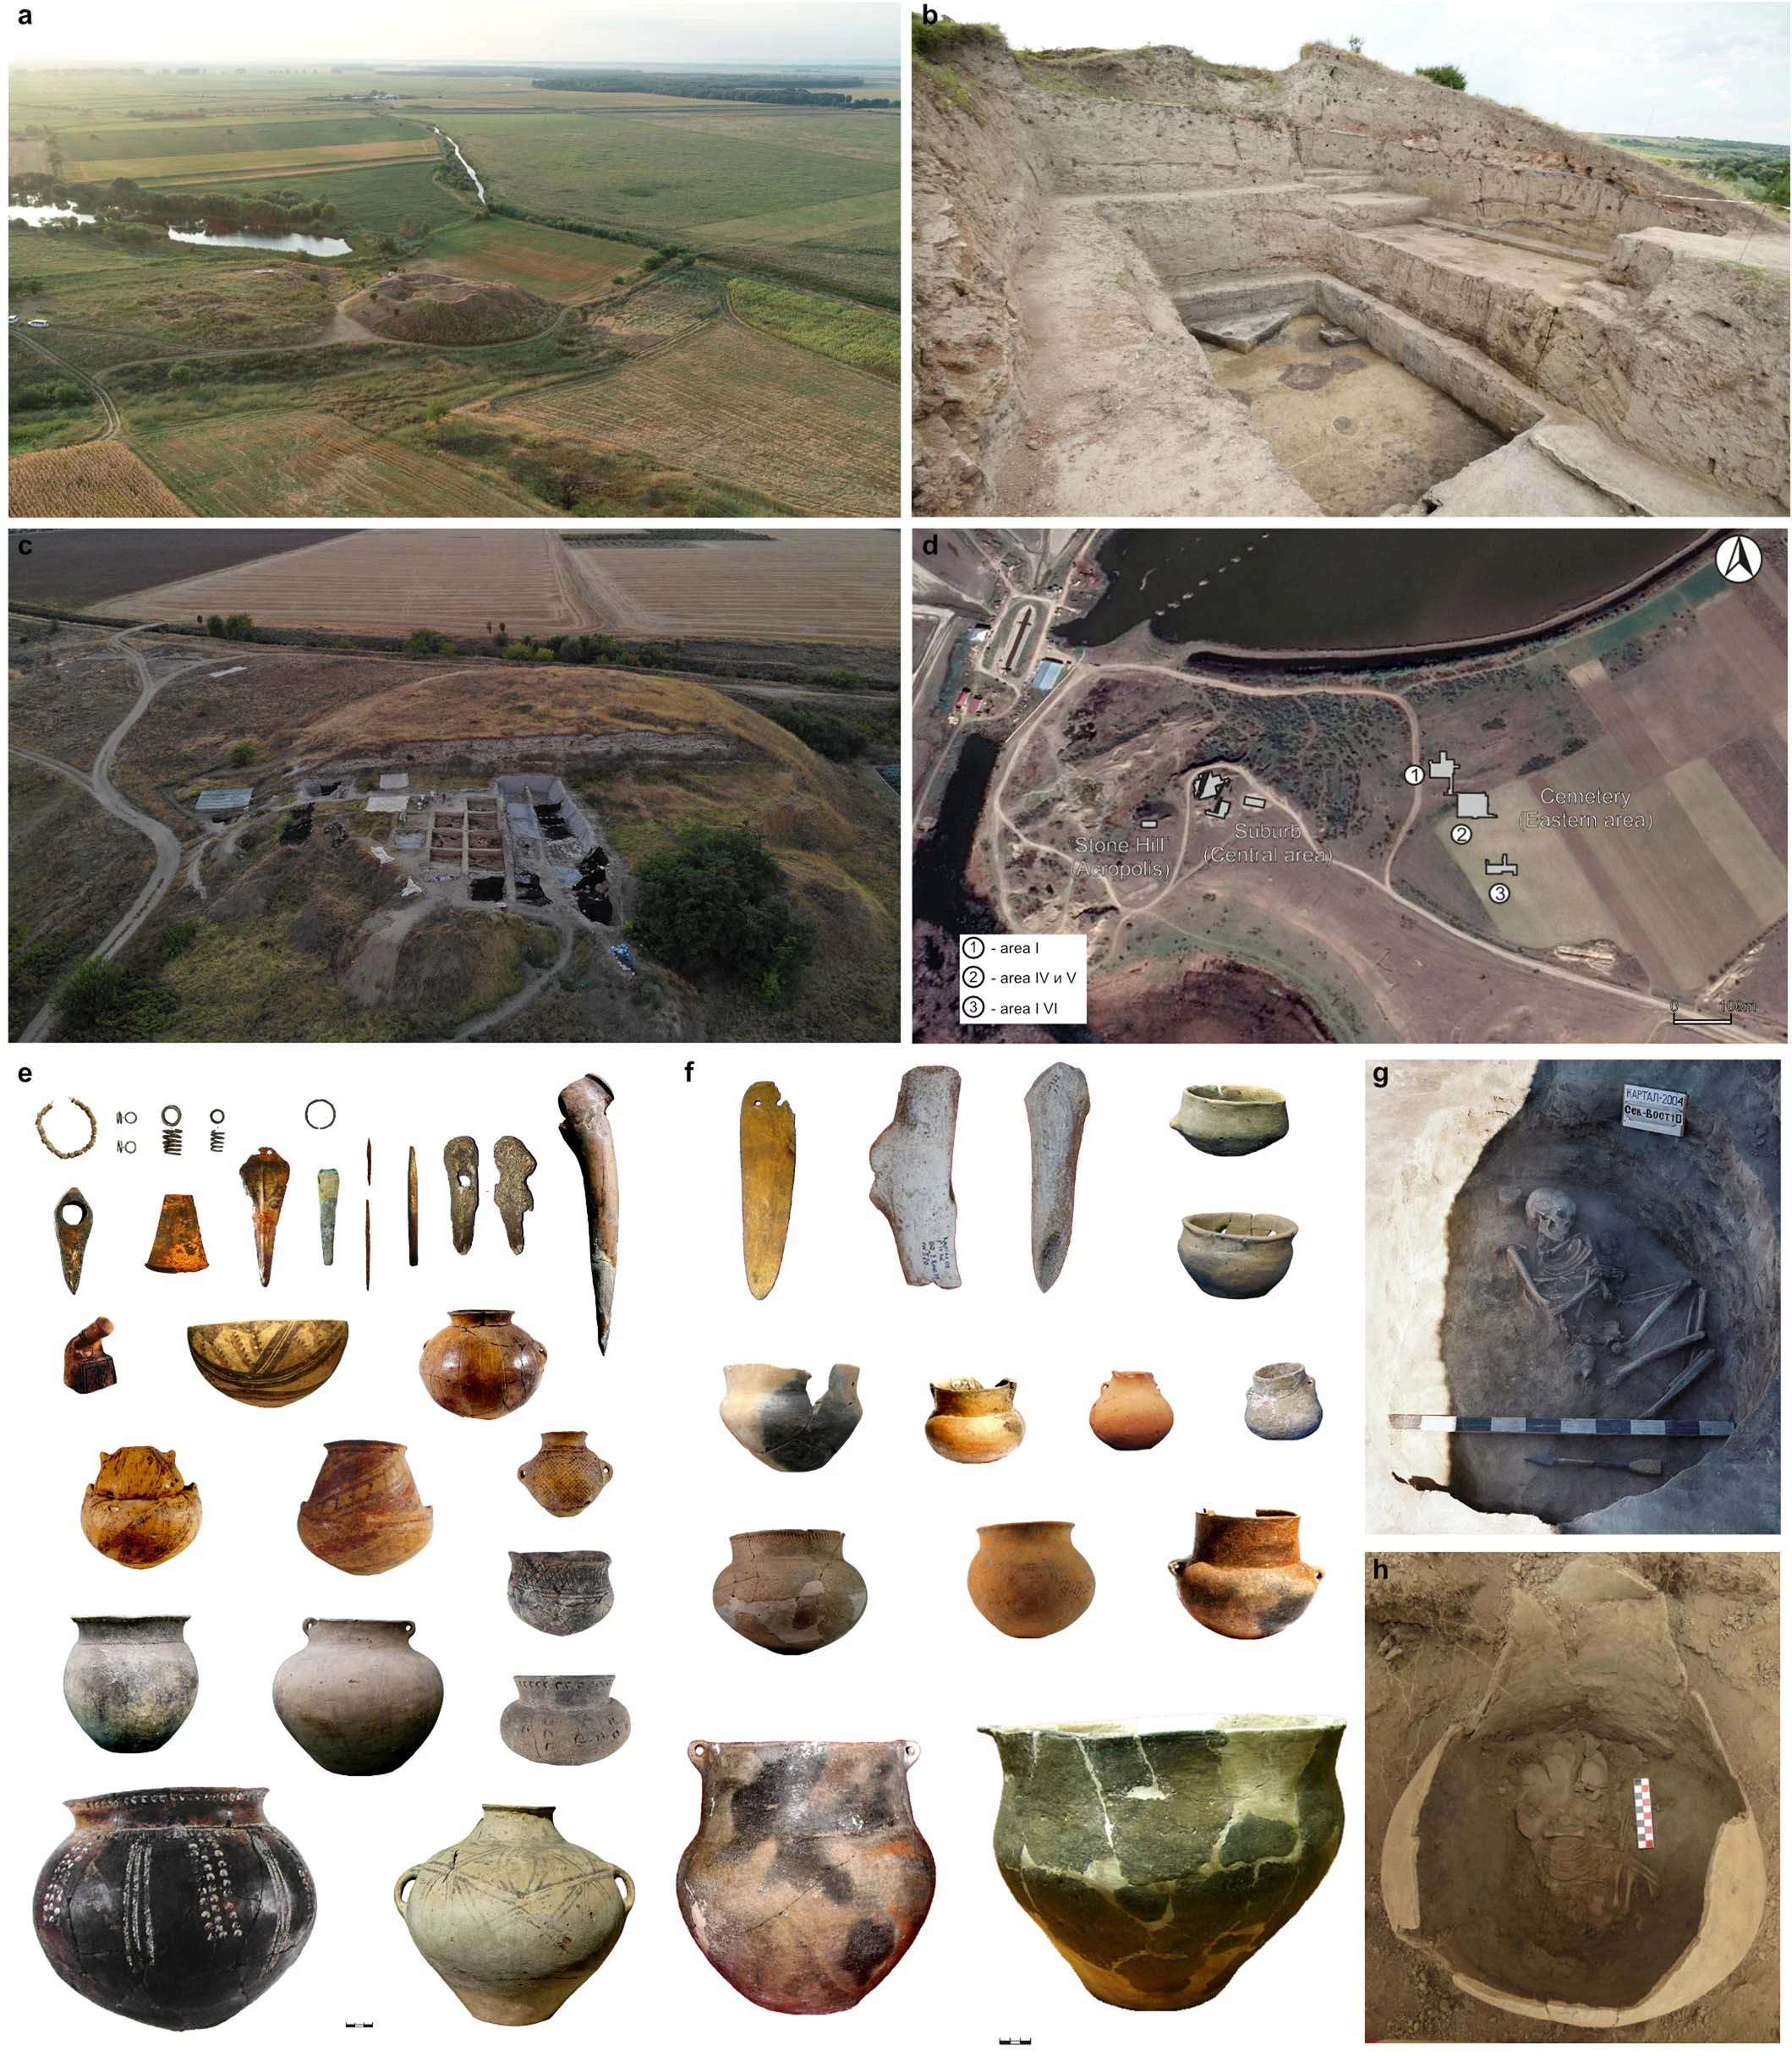 Extended Data Fig. 2 F4-statistics for CA groups to determine Neolithic proxies. F4-statistics show different attraction of the CA to Neolithic groups conditioned on HG groups. Z-scores outside the threshold of (|Z|≥1) are highlighted in orange, f4-values are shown with one standard error. Test populations are given on the y-axis. Standard errors (SE) were computed with the default block jackknife approach. 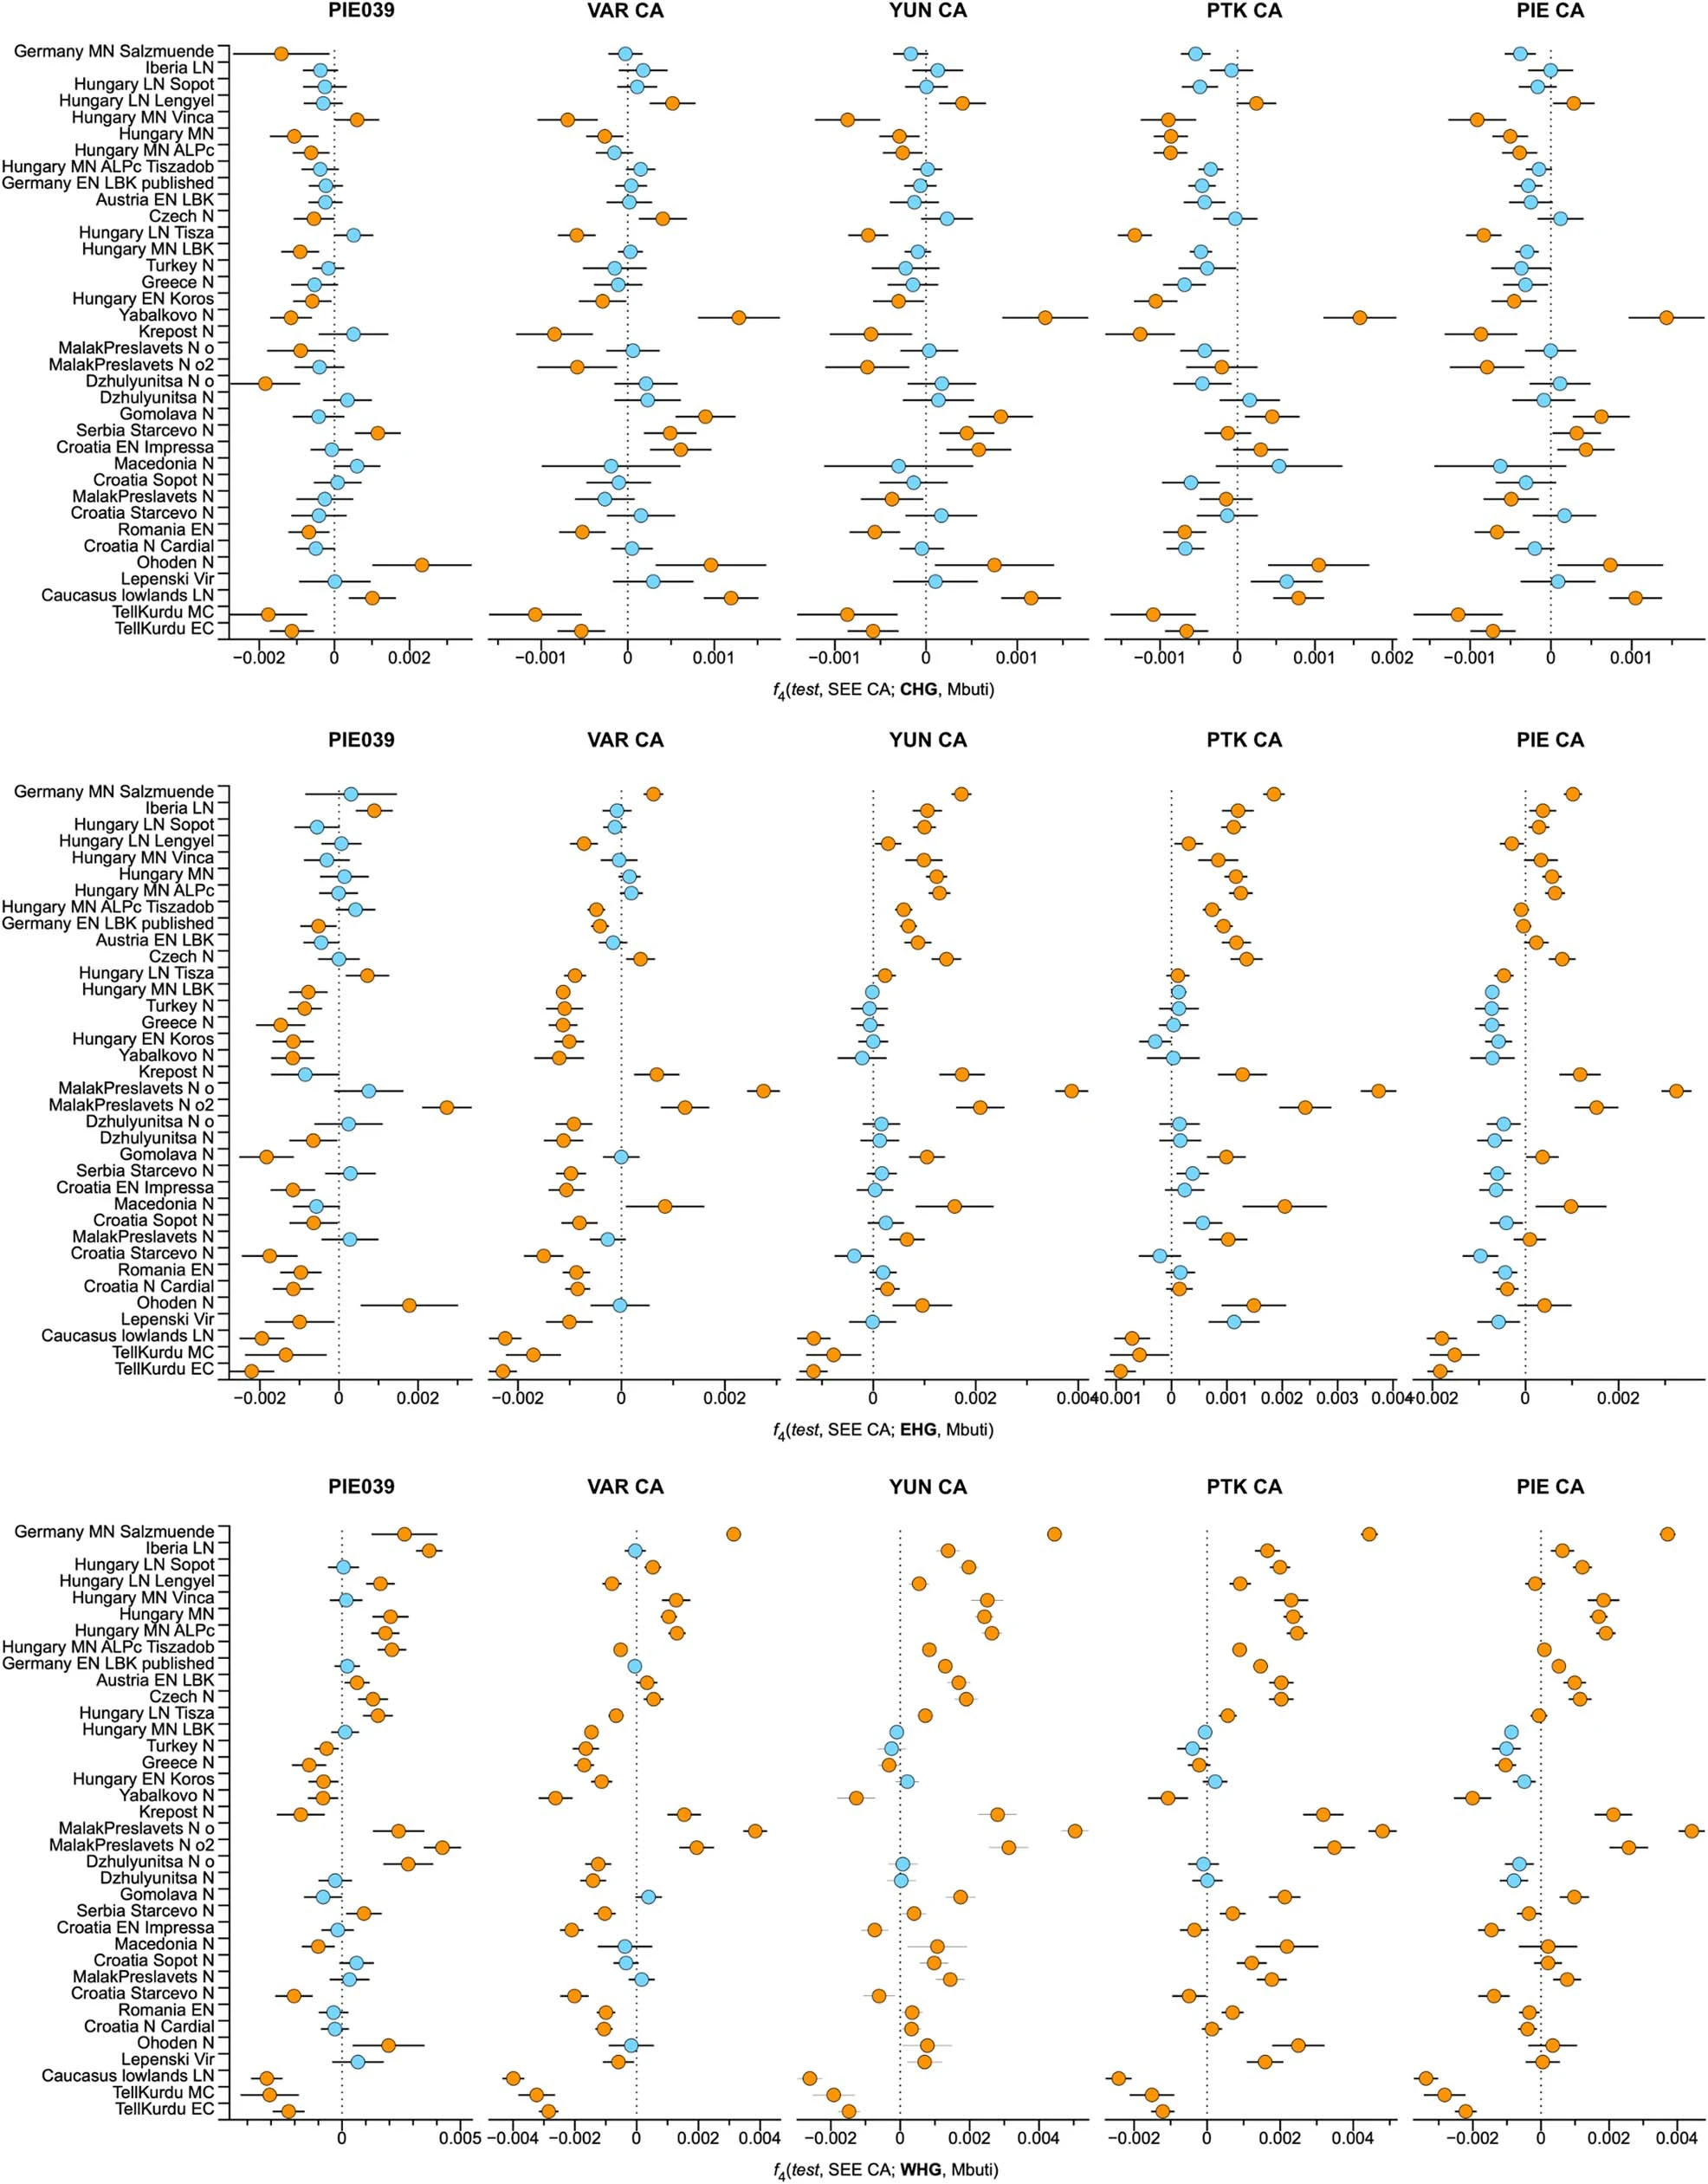 |
|
|
|
Post by Admin on Jul 28, 2023 19:08:28 GMT
Extended Data Fig. 3 DATES and Y-chromosomal haplogroup diversity. a, DATES decay curve for the CA outlier individual PIE060 with SEE N and Iron Gates HGs as source populations. b, Changes of Y-chromosomal haplogroup diversity (colour fills) over time (mean 14C dates cal. BC; x-axis) with respect to changes in autosomal ancestry as reflected in PC2 (y-axis), based on the relative density of female (open circles) and male (colour filled squares) of all newly reported individuals in this study. 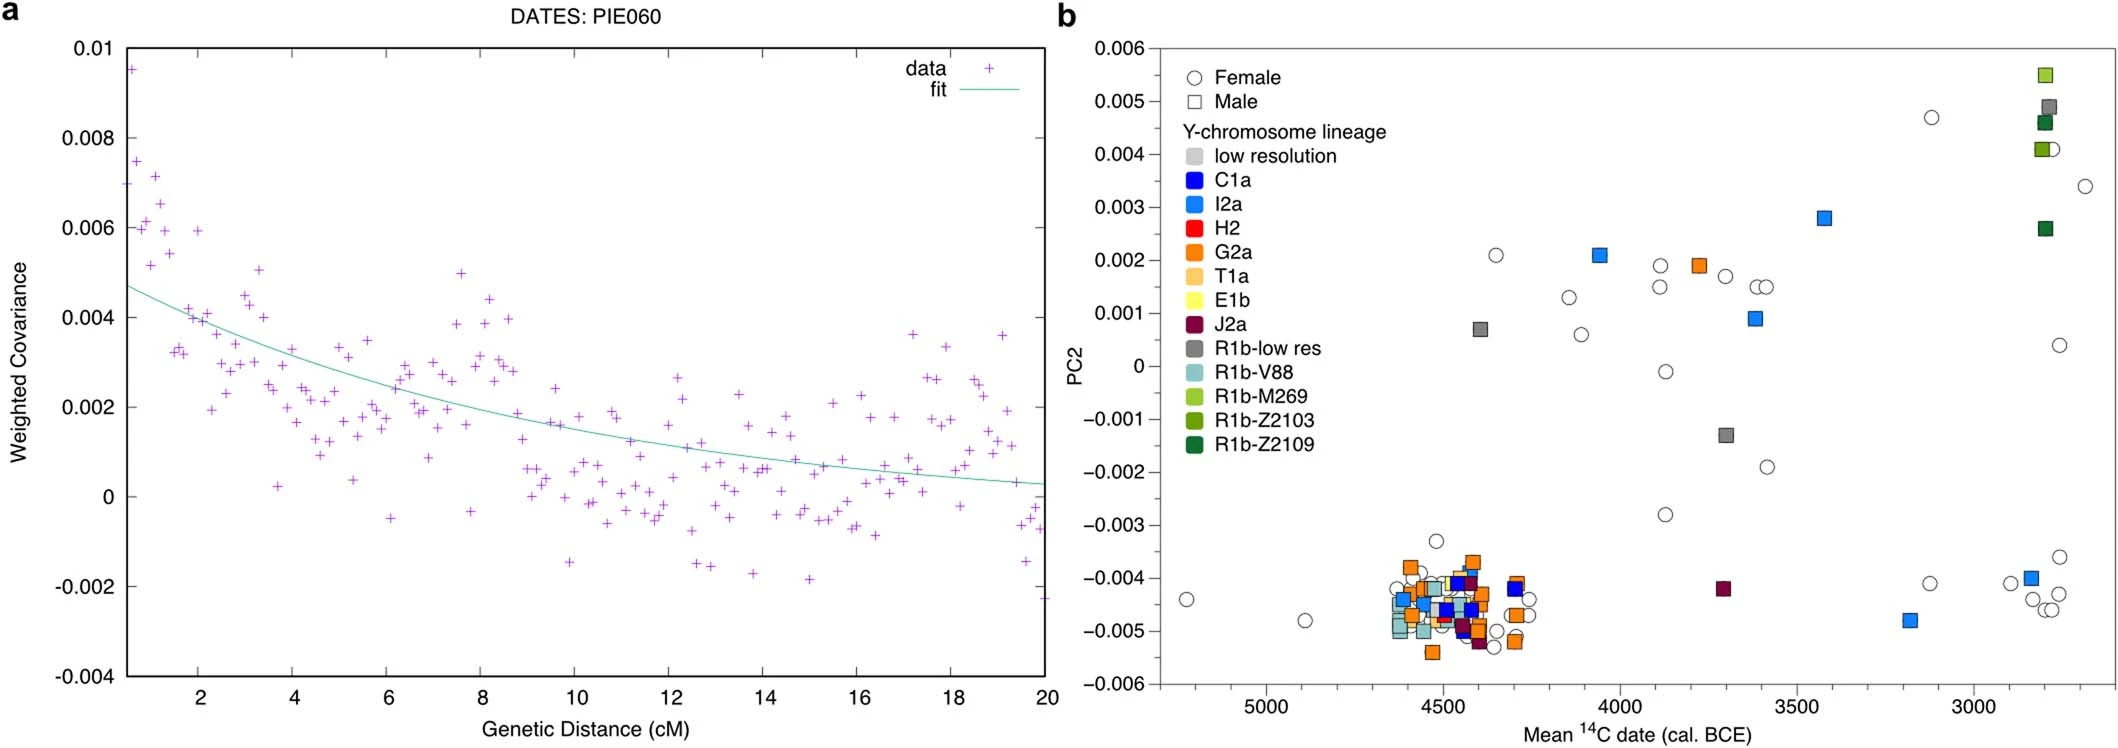 Extended Data Fig. 4 Identity-by-descent within and between sites. a, Results of identity-by-descent (IBD) analysis per pair of individuals. Plotting the sum versus the number of the shared chunks of IBD in window sizes of >12cM resolves degrees of biological relatedness up to the 4-6th degree. Within (left) and between site (right) relationships are highlighted separately. b, Stacked bar plot showing the number (left) and the cumulative distribution of the sum (right) of IBD blocks that are shared between all individuals within and between sites. 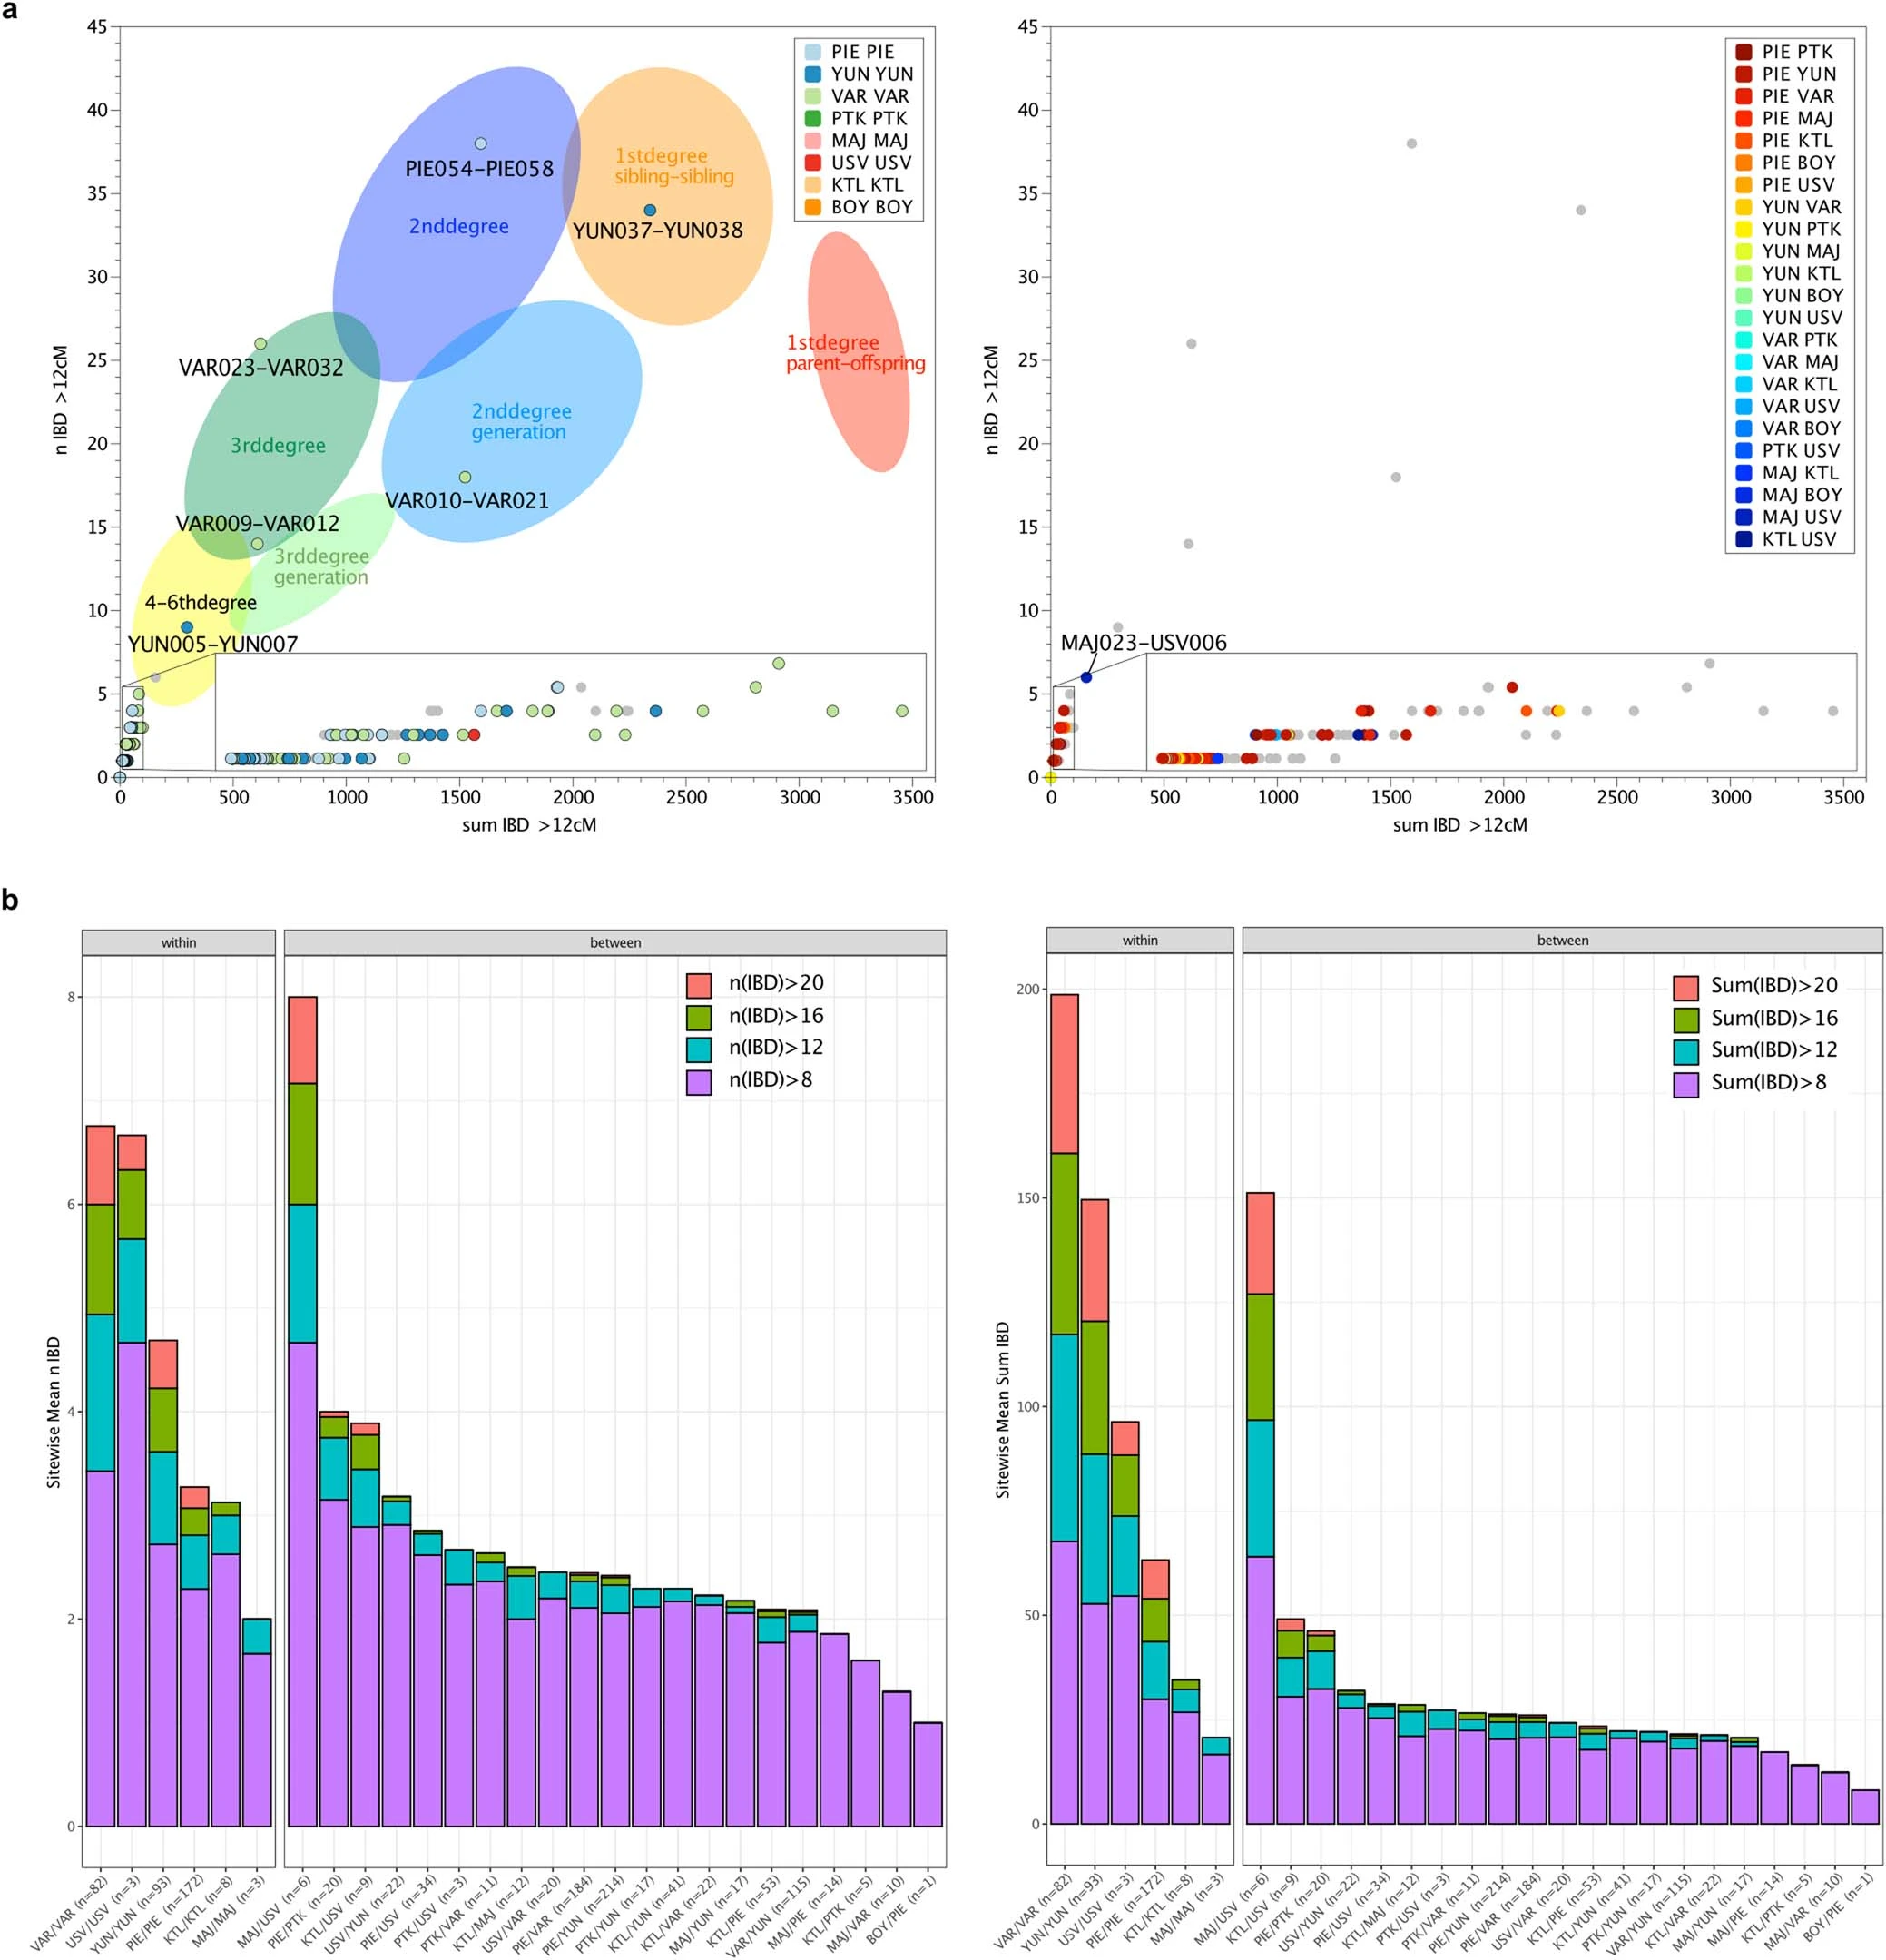 |
|
|
|
Post by Admin on Jul 29, 2023 17:58:18 GMT
Extended Data Fig. 5 Cumulative distribution of the runs of homozygosity tracts of all newly reported individuals. Runs of homozygosity were estimated with hapROH. Individuals are grouped in relative chronological order from right to left. Expected parental relationship and simulated effective populations sizes are given. 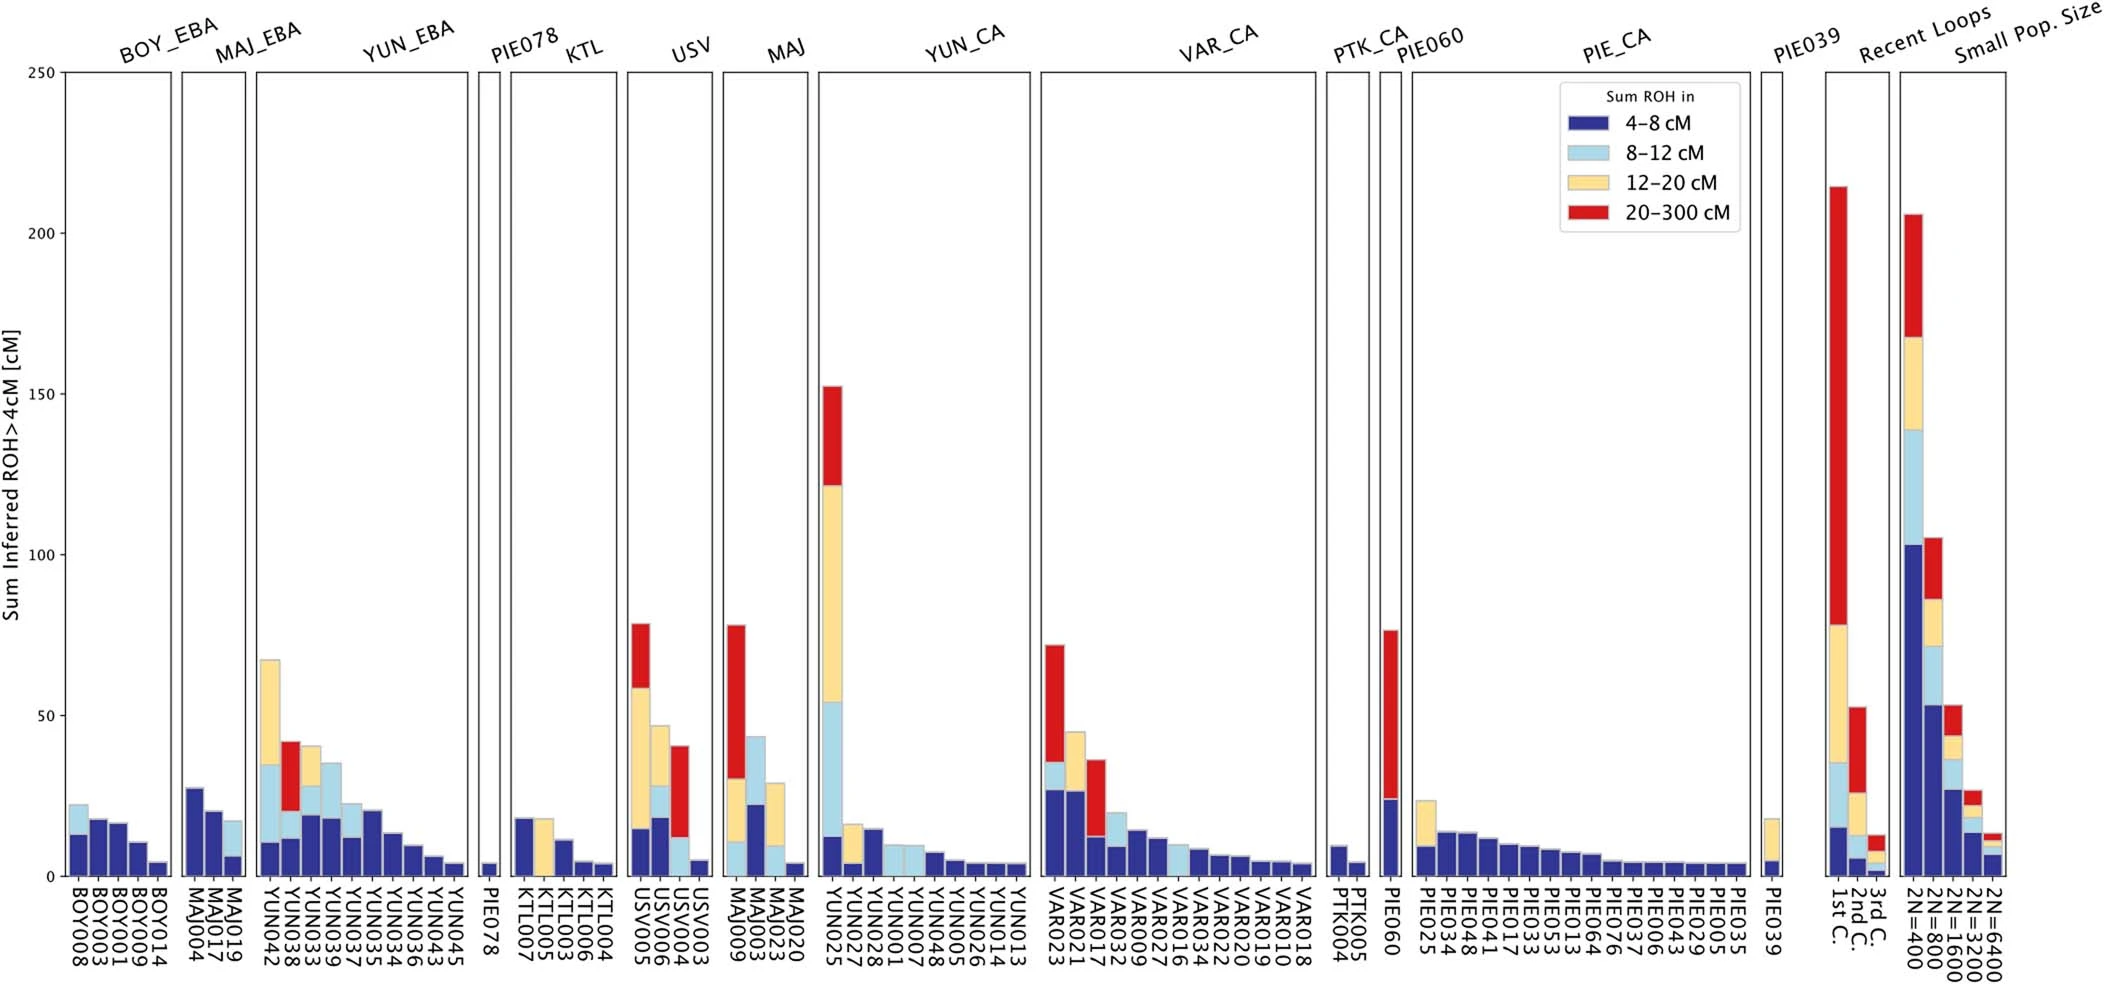 Extended Data Fig. 6 F4 statistics for Ukraine Eneolithic groups to determine attraction to ‘cornerstone’ populations. F4 statistics show different attractions of Ukraine Eneolithic groups to ‘cornerstone’ ancestry groups conditioned on a, Maykop-associated groups, b, Steppe Eneolithic, and c, SEE CA. Significant Z-scores (|Z|≥3) are highlighted in orange, f4 values are shown with three standard errors. Test populations are given on the y-axis. Standard errors (SE) were computed with the default block jackknife approach. 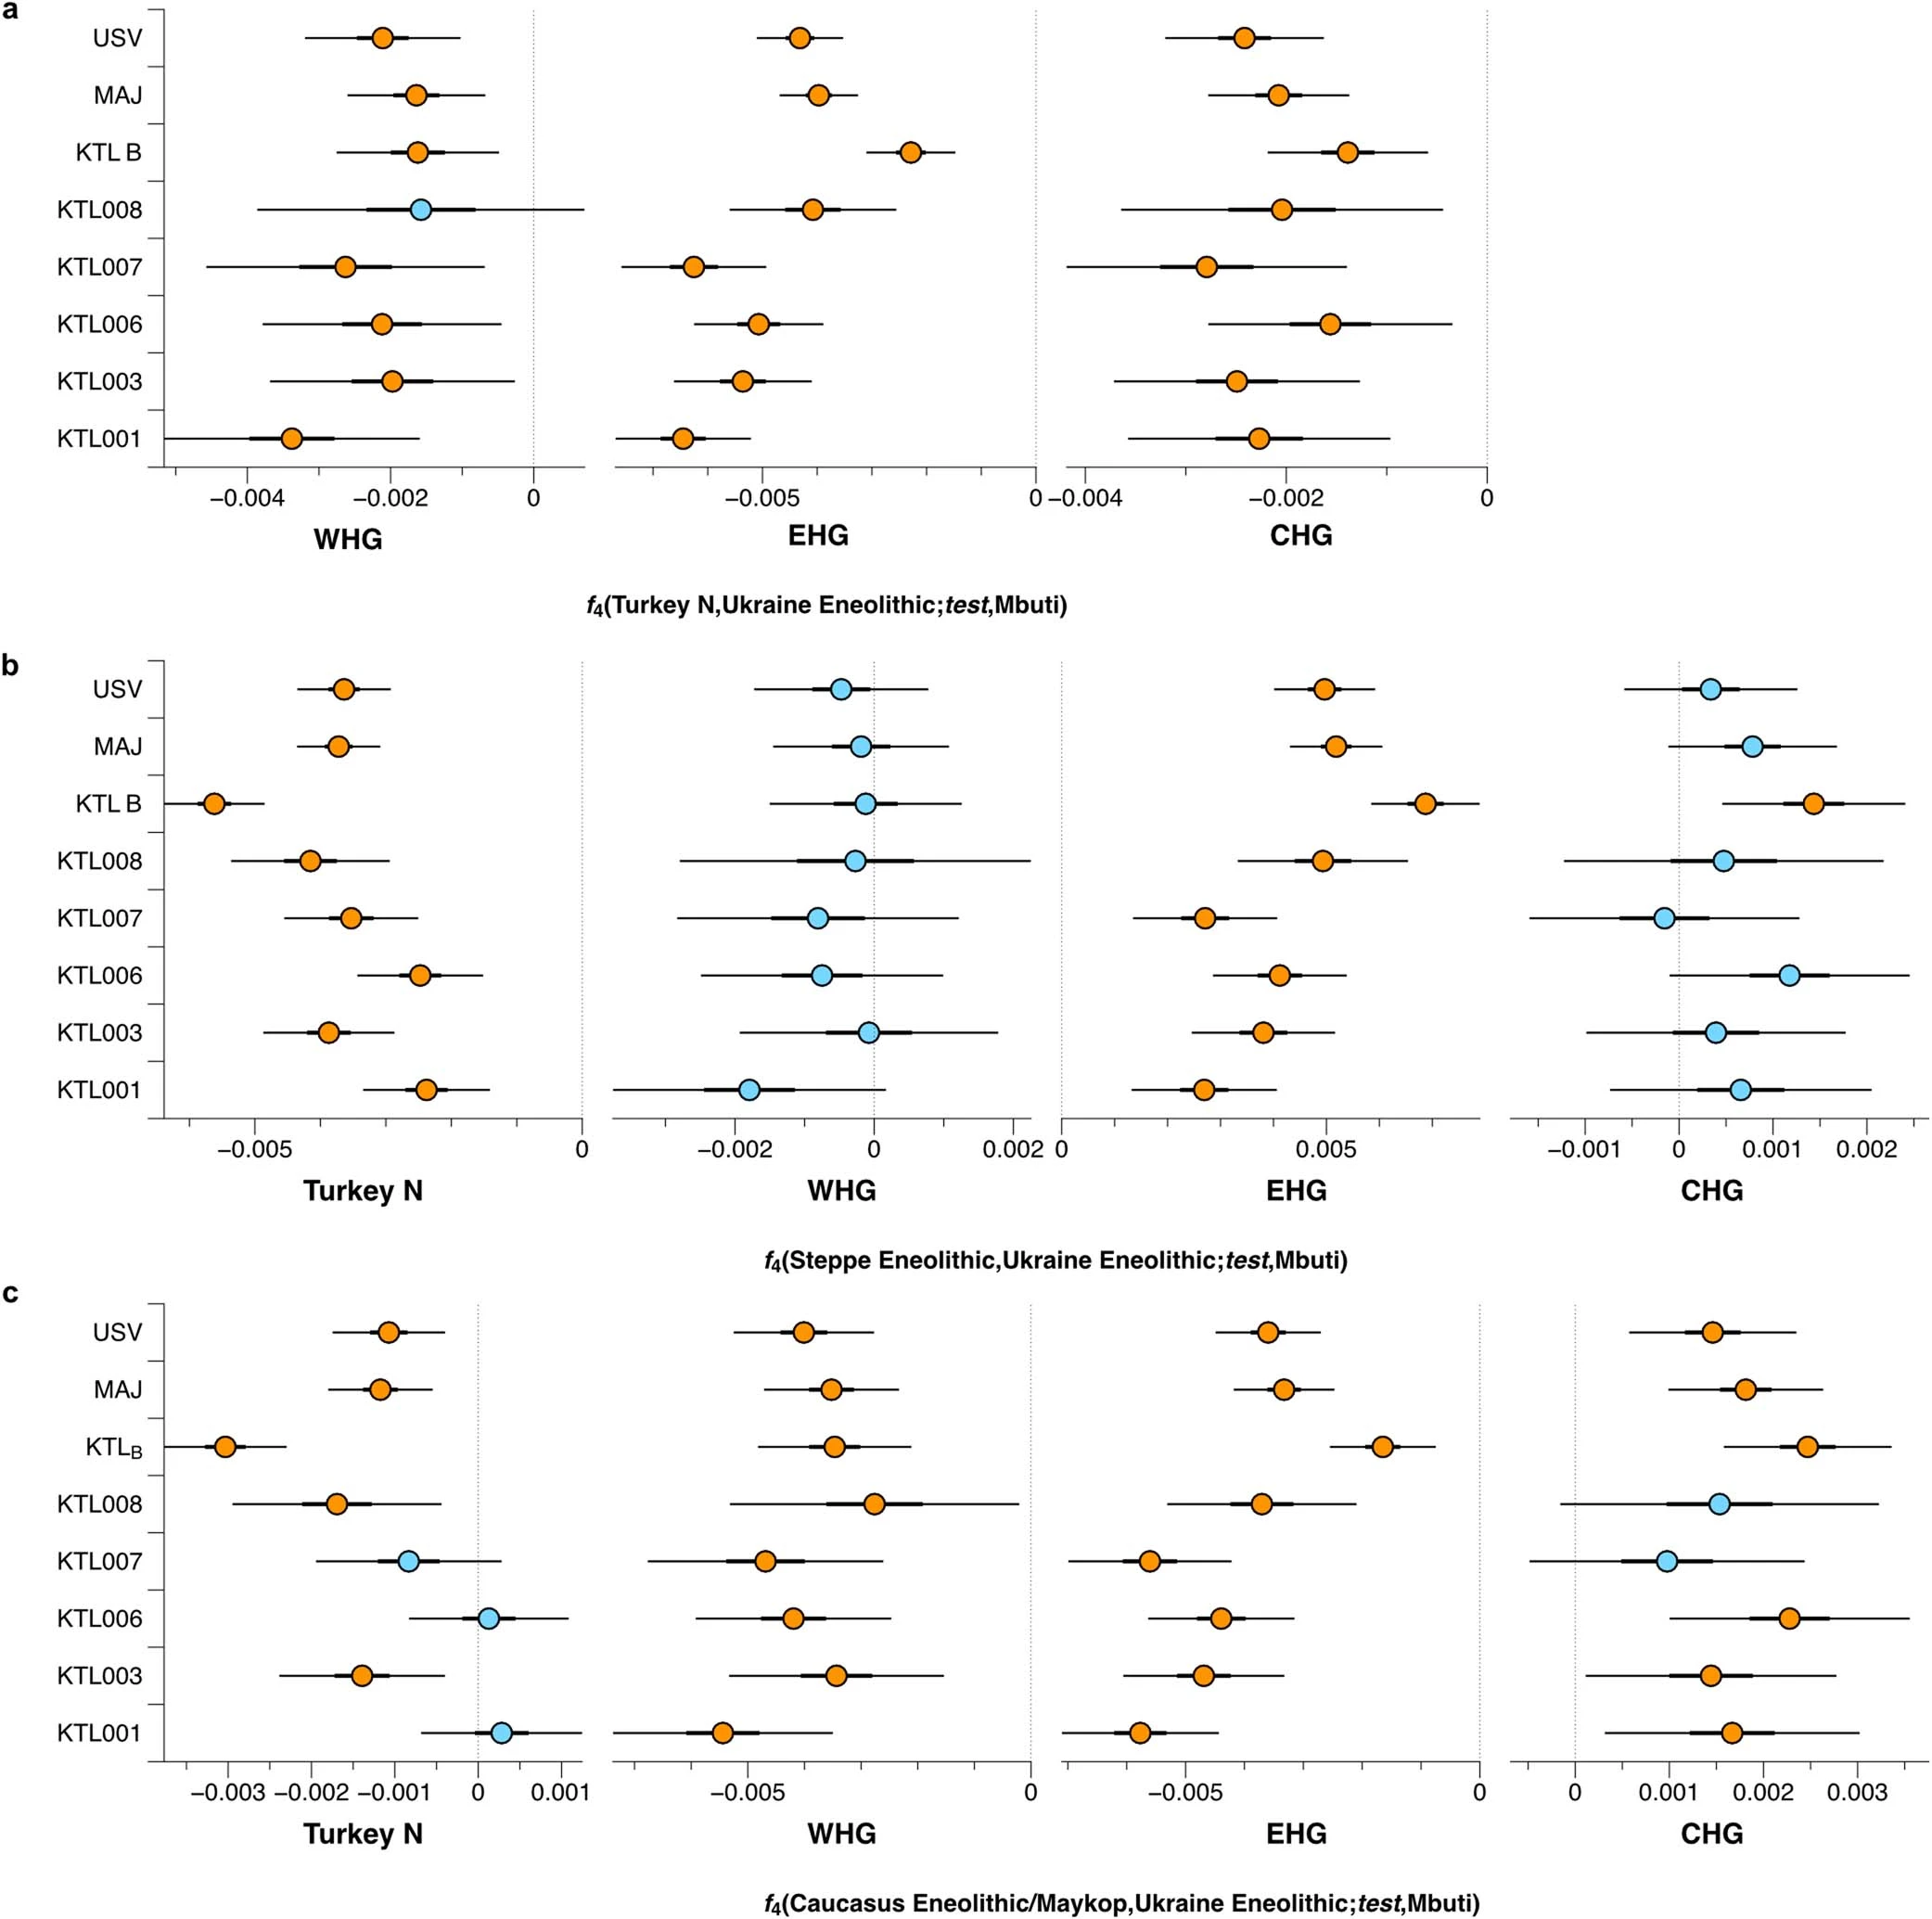 |
|
|
|
Post by Admin on Jul 30, 2023 18:05:35 GMT
Extended Data Fig. 7 F4 statistics for EBA groups to test for excess HG attraction. F4 statistics show different attractions of EBA groups to HG groups conditioned on their respective preceding or contemporaneous group. Significant Z-scores (|Z|≥3) are highlighted in orange, f4 values are shown with three standard errors. Test populations are given on the y-axis. Standard errors (SE) were computed with the default block jackknife approach. 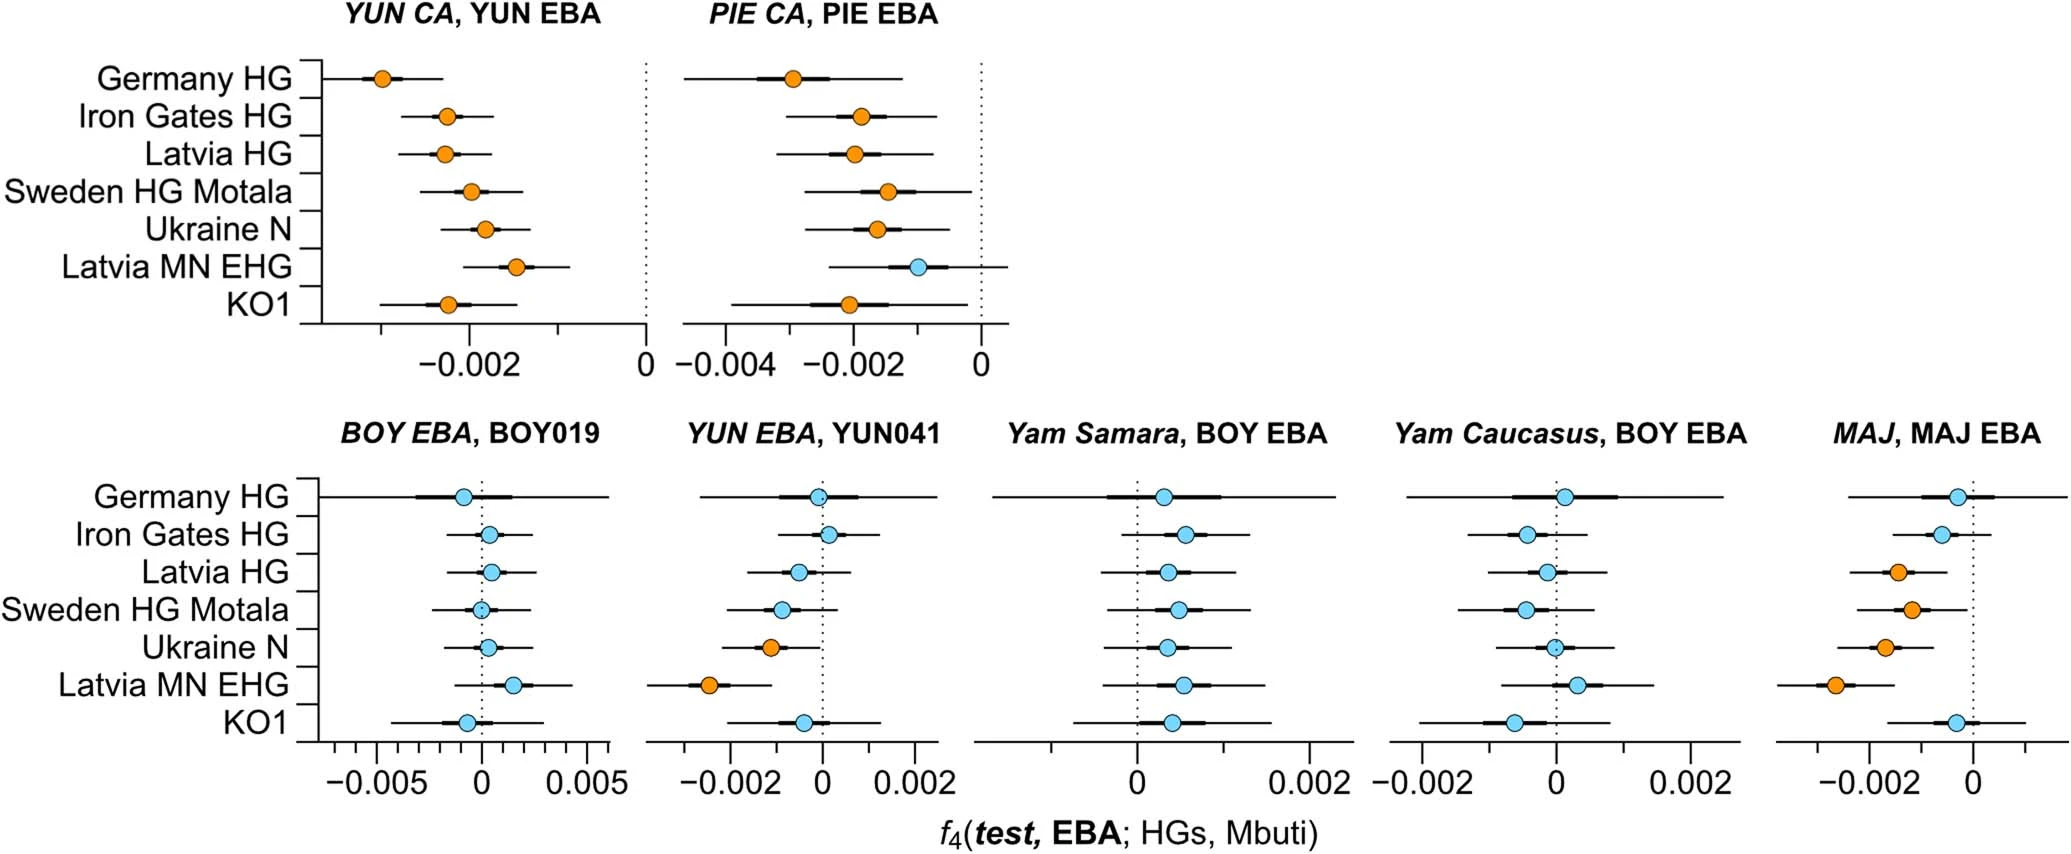 Extended Data Fig. 8 Testing for Anatolian farmer-related affinity in EBA individuals. F4 statistics show different attractions of the EBA groups to VAR_CA conditioned on Yamnaya-associated groups. Significant Z-scores (|Z|≥3) are highlighted in orange, f4 values are shown with three standard errors. Test populations are given on the y-axis. Standard errors (SE) were computed with the default block jackknife approach. 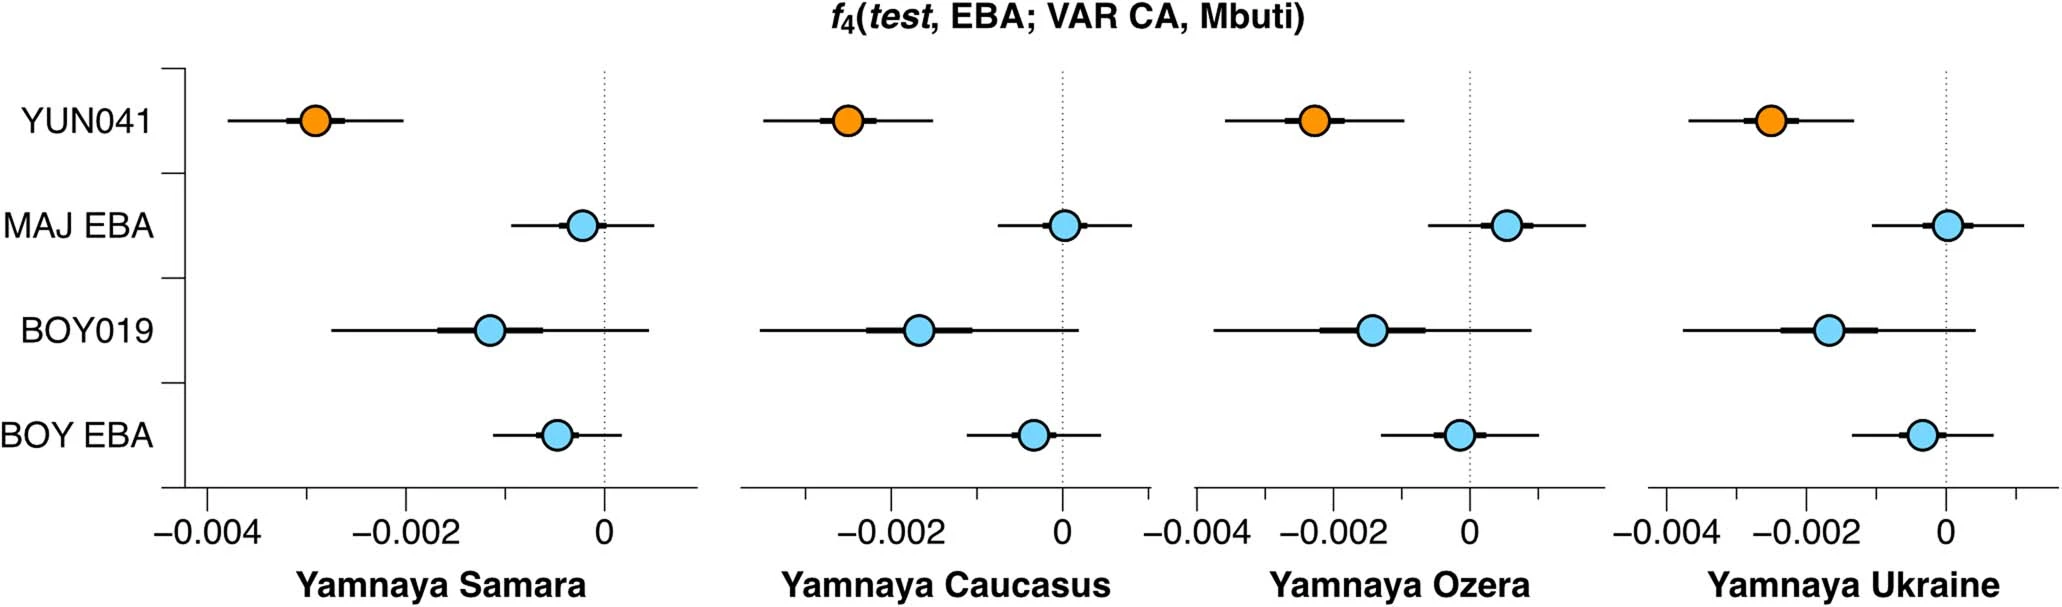 Extended Data Fig. 9 F4 statistics to explore excess affinity of EBA ‘steppe ancestry’ groups conditioned on preceding Eneolithic groups from the steppe and the Caucasus. F4 statistics show different attractions of the EBA groups to ‘cornerstone’ populations conditioned on pre-Yamnaya groups, Steppe Eneolithic and Caucasus Eneolithic/Maykop. Significant Z-scores (|Z|≥3) are highlighted in orange, f4 values are shown with three standard errors. EBA groups are given on the y-axis and test populations are given on the x-axis. Standard errors (SE) were computed with the default block jackknife approach. 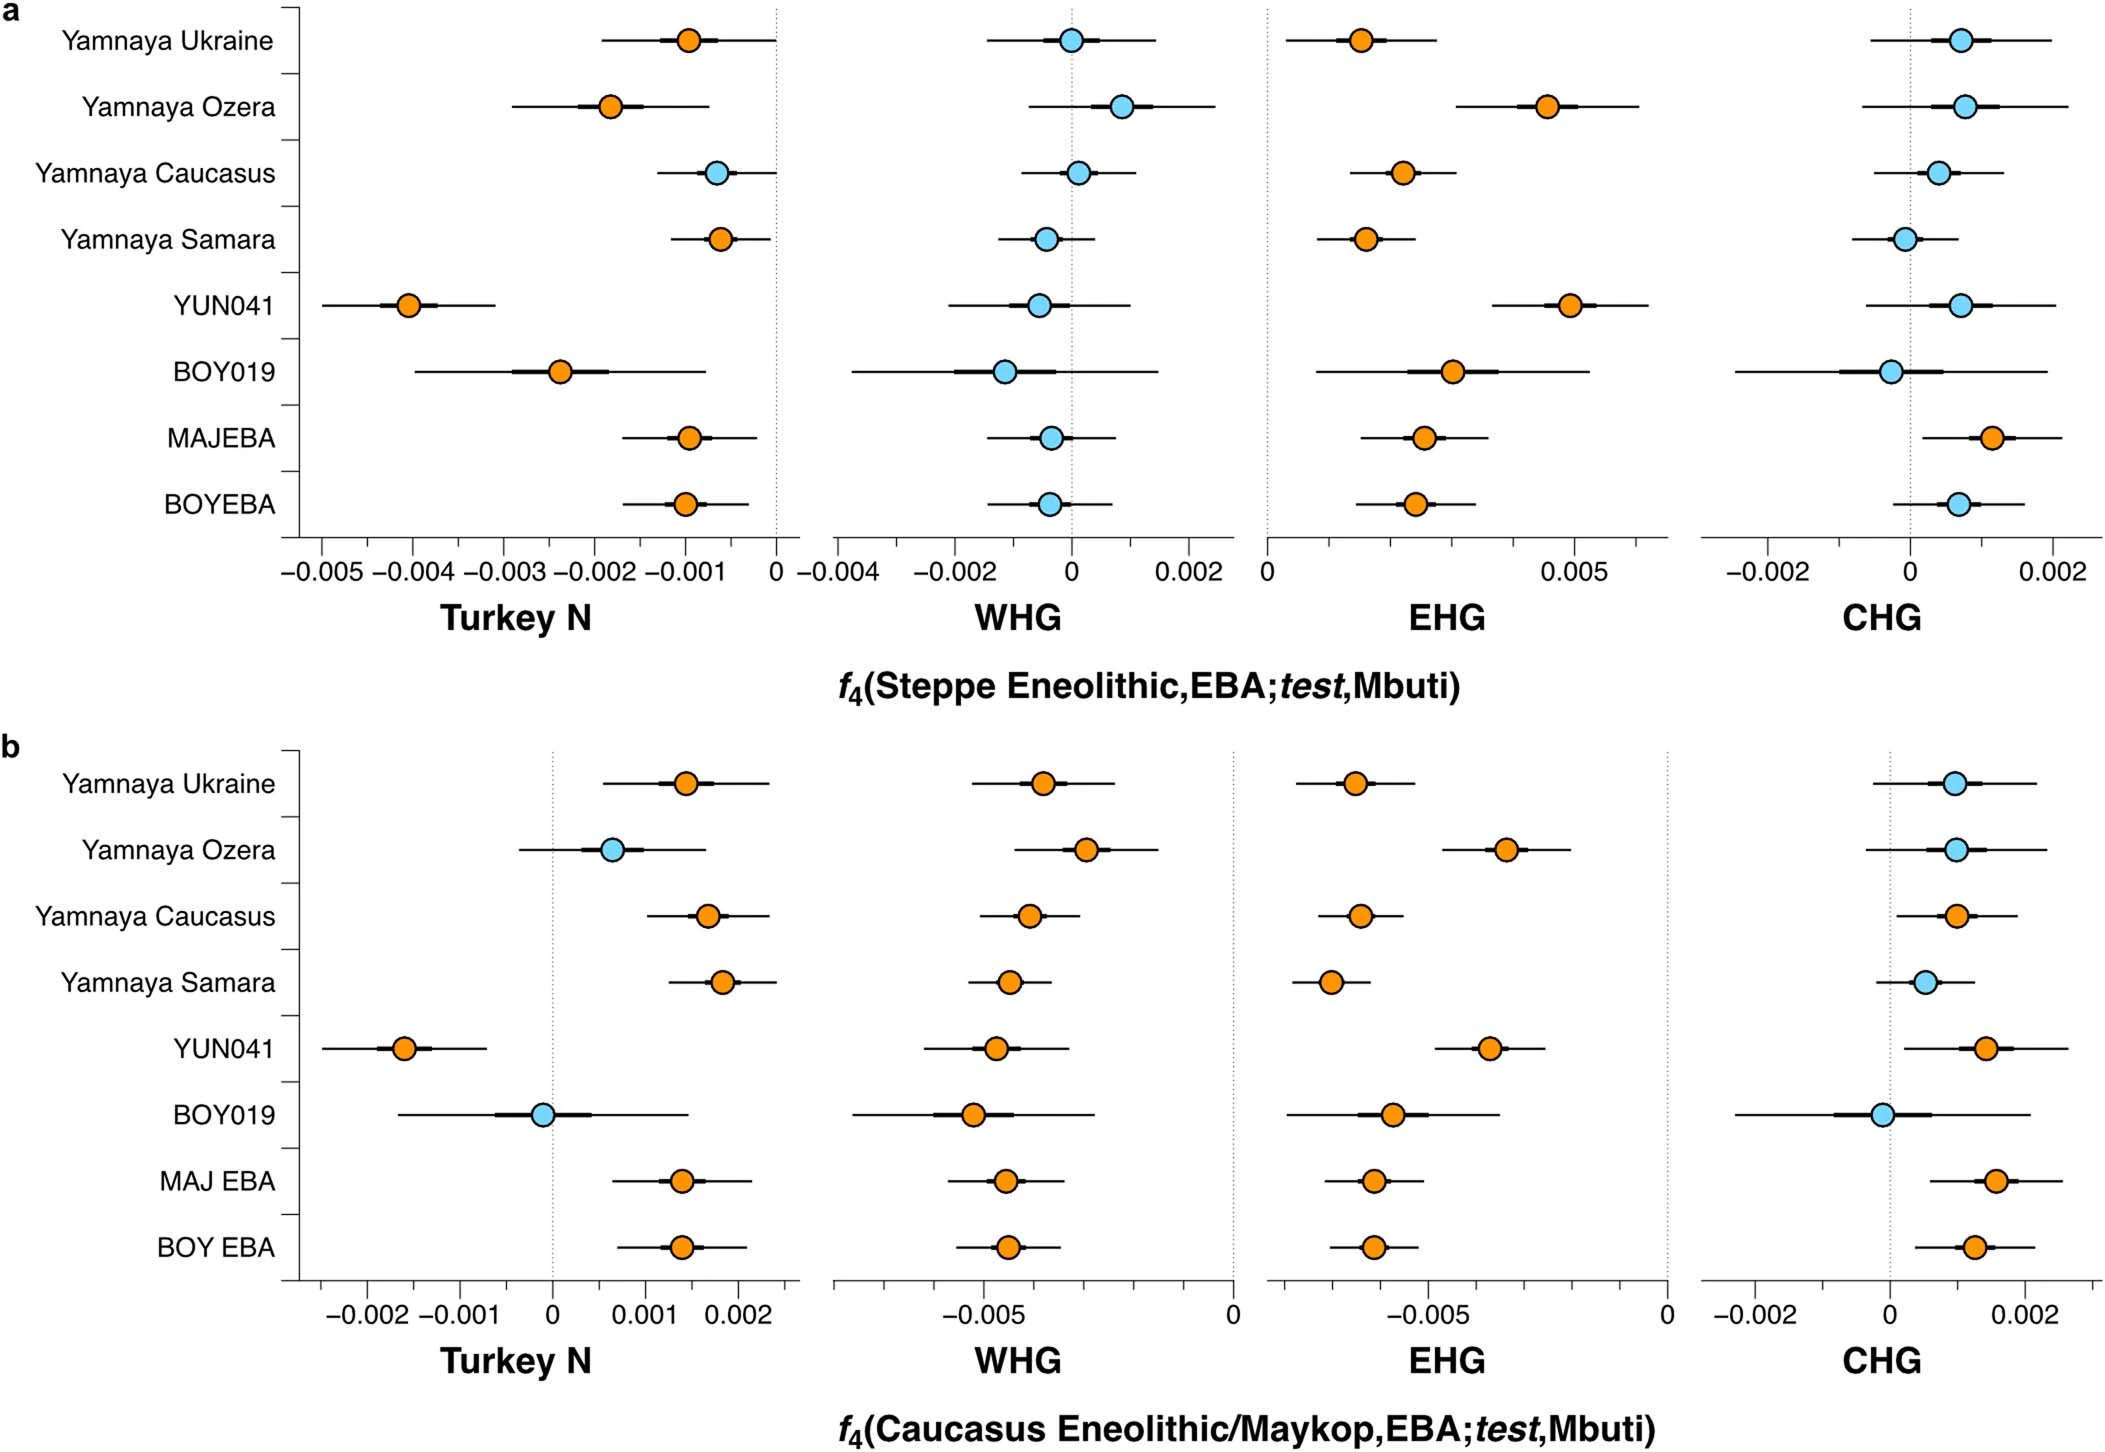 Early contact between late farming and pastoralist societies in southeastern Europe 1. Southeastern Europe 1.1 Ecological background
During the Late Neolithic and the Copper Age, climatically optimal conditions
prevailed. A continental climate with cold dry winters and moist early summers must have been
the norm, which is reflected in the adaptation and choice of cultivated and exploited plants. The
main attested species in the macro-botanical assemblage are einkorn and emmer wheat, barley,
lentils, peas and bitter vetch. Collected fruits included raspberry, cornelian cherry, cherry plum, grapes and blackthorn.
The paleoenvironmental studies at tell Pietrele have provided evidence that the Danube did not
exist in the form of a streamlined river as we know it today13. In addition to many side-arms,
the Danube to the east of the city of Ruse was rather a lake that at times probably reached as
far as the Black Sea.
This meant an almost inexhaustible supply of fish and mollusks for the inhabitants at
this lake. In Pietrele for example, mainly carp and pike were fished, and to a lesser extent also
catfish. While the older layers of this tell are mainly characterized by domesticated animals,
especially pigs, but also cattle and sheep, in the younger layers half of the animals are wild
game, indicating that the hunting of wild boar, red deer, wild horse and aurochs played a
substantial role95. Comparable results of the palaeobotanical and palaeozoological
investigations are also available from other tell settlements.
The end of the tell settlements has been linked, above all by Henrieta Todorova, to a
rise in annual mean temperature that led to long-lasting droughts and forest fires and finally to
a prolonged depopulation over several centuries16.
|
|

