|
|
Post by Admin on Mar 3, 2019 23:21:44 GMT
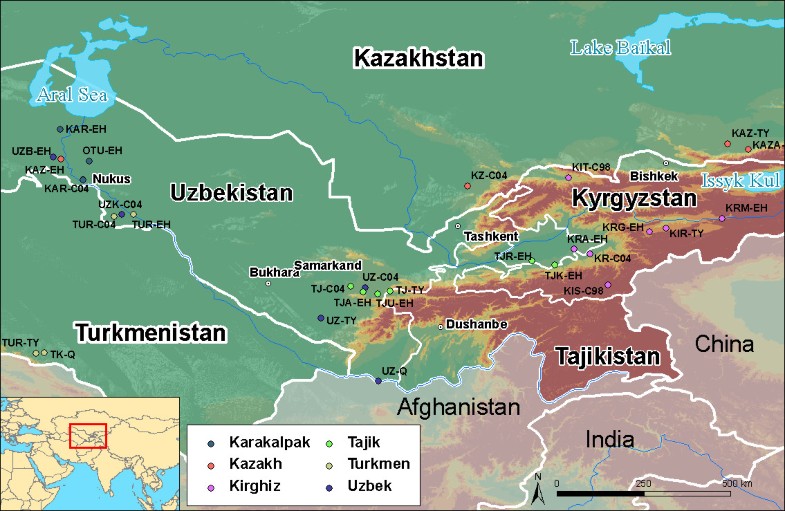 Central Asia is located on the Silk Road, where numerous ethnic groups characterised by different languages and historical modes of subsistence co-exist. These include the Tajik populations, who speak an Indo-Iranian language and are sedentary agriculturalists, and several Turkic populations, who speak an Altaic language and are traditionally nomadic herders [1, 2]. However, some of the latter (e.g. Uzbeks) have shifted to a sedentary agriculturally-based lifestyle more recently, during the sixteenth century. These two groups of populations have different lifestyles, but also different social organisations. Agriculturalist societies are patrilocal and are organised into families. Marriage rules are based on kinship and geographical proximity with a strong preference for first-cousin marriages. Conversely, nomadic societies are organised into so-called "descent groups", namely "lineages, clans, and tribes". Individuals belonging to each of these descent groups claim to share a recent common ancestor on the paternal line. We have previously shown that such claims have a biological basis for individuals belonging to lineages and clans, but that links between individuals from a given tribe and their claimed paternal ancestor are socially constructed rather than biological [3]. Membership of these descent groups is transmitted through the father to the children, and we have previously shown that the dynamics of these descent groups increase the Y-chromosomal inter-population genetic differentiation among Turkic populations [4], in comparison to the level of Y-chromosomal differentiation among agriculturalist populations and reduces male effective population size [5].  In this study we addressed, by analyzing uniparentally-inherited markers, how social organisation in human populations can have an impact on genetic diversity. More specifically, we studied the extent to which the way individuals choose their mates and where they settle affect genetic distances between populations. In the current study, as expected, the overall levels of genetic differentiation based on mtDNA turned out to be very low (less than 1%), even when comparing population groups with different language family affiliations and diverse modes of subsistence. This lack of differentiation most likely results from high levels of female gene flow in these patrilocal societies. The mean Fst among populations of the same ethnic group clearly shows a contrasting pattern between Turkic versus Tajik populations. Among Turkic groups, Fst based on mtDNA is close to zero in all comparisons (except one case of one Kyrgyz population) in contrast with Tajik farmer populations where Fst between populations is always relatively high (0.025). This reflects a different mode of exchanging spouses between populations, with a high level of exchange in the Turkic group and a lower level in the Tajik group [4]. 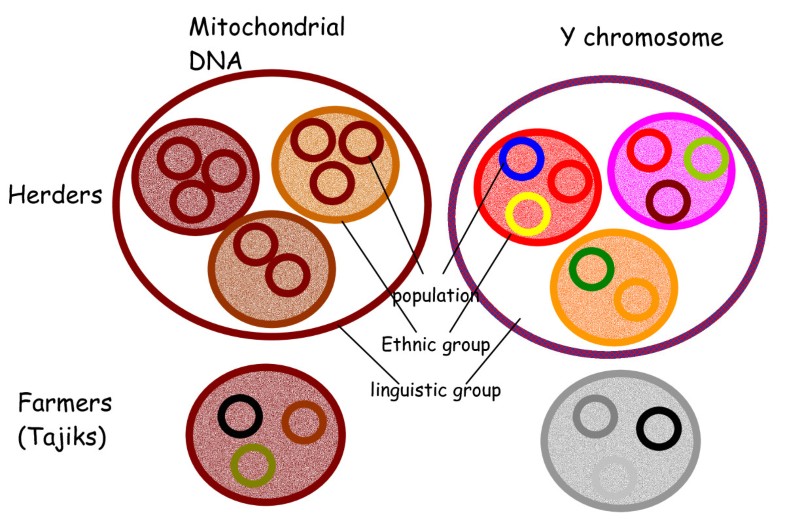 The situation for the Y chromosome in these populations is in sharp contrast with the mtDNA data. Previous studies have reported the occurrence of high levels of Y-chromosomal genetic diversity in Central Asia [4, 7, 8]. Our study strengthens these observations and most importantly, shows that genetic differentiation is strong even within a single ethnic group. The level of genetic differentiation is lower at the inter-ethnic group level than at the intra-ethnic group level: 5.6% of the differences are among ethnic groups while the overall genetic differences are 18.6%, leaving 13.7% of differences among populations within ethnic group. The differences among populations belonging to the same ethnic group vary according to the ethnic group with a non significant value for the two Uzbek populations, a lower value for Karakalpak and Kyrgyz (7% and 9% respectively) and a higher value for Turkmen (25%). This observation cannot be accounted by the geographic location of these populations since there is no global correlation between genetic and geographical distances, nor a physical barrier between them. Contrasting levels of differentiation for Y and mtDNA We found evidence that overall, the Y chromosome has a significantly higher level of differentiation between populations than does mtDNA, in agreement with previous studies. The present study also shows that the level at which differentiation occurs is different between the two markers. There are more differences between populations of the same ethnic group than between ethnic groups for the Y chromosome, whereas the opposite is observed for mtDNA in the Turkic group. Indeed, no differences are observed in the Turkic group between populations belonging to the same ethnic group but there is a significant (although low) genetic differentiation between ethnic groups. This is not the case for Tajik populations where the mtDNA differentiation, like Y-chromosomal differentiation, is also significant between populations within this ethnic group. Ethnologists describe the social organisation of Turkic populations as exogamous at the clan level or the lineage level (depending on the population) but endogamous at the tribe level - a man chooses his spouse outside the clan or his lineage but inside the tribe and inside his ethnic group. The geographical spread of a given tribe is wide [1], and this could explain the lack of mtDNA genetic differentiation between populations that are defined on geographical criteria. However, we would have expected stronger differences between ethnic groups. One explanation for our observations of low levels of maternal differentiation could be that ethnic groups are not actually highly endogamous. An ethnological study during our field expedition in Karakalpakia measured the level of endogamous mating at the tribe level among Karakalpak. Of 506 matings considered, 443 (87.5%) were among members of the Karakalpak ethnic group, and 78.5% among members of the same tribe [9]. Thus, even if the ethnic group's endogamy is high (87.5%) from an ethnological perspective, it is low from a genetic point of view and insufficient to create high levels of genetic differentiation for mtDNA between these ethnic groups. An alternative explanation is that ethnic groups are a recent aggregation of tribes of different origins. This low level of endogamy, combined with an aggregation of unrelated tribes to form an ethnic group, leads to a low level of matrilineal genetic differentiation among ethnic groups. By contrast, Tajik populations are endogamous - a male tends to choose his spouse in the same village, and within the same family. This is shown by the significant Fst between Tajik populations for mtDNA. Further, the strong sex-specific difference in the pattern of genetic differentiation in Turkic populations (i.e. no mtDNA genetic differences between populations but strong Y-chromosomal differences within them) is explained by their strongly patrilineal social organisation. This type of organisation is absent in Tajik and explains the less sex-specificity in the genetic differentiation observed in this ethnic group (see Figure 1), consistent with no sex-specificity in the effective population size that has been demonstrated recently [5].  History of ethnic groups The combination of mtDNA and Y-chromosomal data from these large collections of populations and ethnic groups of Central Asia can shed light on the history of these groups. In addition, the Y-chromosomal analysis of genetic differentiation between populations belonging to the same ethnic group can give some estimation of the minimal age of these ethnic groups. The median estimate of the age of first split is always older than 1000 years (except for Karakalpak, for which it is 880 years). Actually, this estimation does not represent the age of the group sensu stricto, but the lower bound at which the group originated. In any case, this estimate is older than what is known from historical records for most of the Turkic ethnic groups, further, even if the confidence intervals are large, they do not overlap with historical estimates in two of the ethnic groups (and marginally three). Historical sources state that the Kazakh, Kyrgyz and Uzbek living in Central Asia arose in the sixteenth century. Genetic data show that populations belonging to one of these ethnic groups have an older common ancestor (more than one thousand years ago). Although these estimates are based on only one genetic system (linked Y chromosome microsatellites), we can propose that these ethnic groups are a heterogeneous conglomerate of tribes or populations. This hypothesis has been previously formulated in the case of Brahmin caste in India, whose subcastes seem to result from a fusion rather than a fission process [10]. Such heterogeneous conglomerate of populations could have its origins at the foundation of the ethnic group or later during its history, as a result of the agglomeration of new unrelated tribes. The second hypothesis is compatible with historical records regarding the Uzbek and the Kyrgyz. Soucek [11] records that what is now called 'Uzbek' encompasses the seventeenth century Uzbek and former Chagatai Turk groups who were already settled in Uzbekistan. Therefore the name refers to a tribal union of different tribes including Chagatai Turks who were strongly mixed with Iranian dwellers of Central Asia. The same type of scenario is proposed by historians regarding the Kyrgyz living in Kyrgyzstan: this group is made up of Kyrgyz who arrived in the country in the fourteenth century and of Turkic groups who were already leaving in TienShan. The minimum age of the origin of the group is compatible with a common ancestry for the Turkmen group. This does not prove the common ancestry hypothesis, but does not refute it formally as for the other ethnic groups. In any case, additional sampling would certainly help to test these hypotheses, especially because our Turkmen group is composed of only two populations. Similar analyses based on mtDNA information are not feasible because of the high uncertainty in mtDNA mutation rate calibration and the near absence of genetic differentiation among populations belonging to the same ethnic group. Recent common ancestry or older common ancestry with high levels of gene flow are both possible explanations for this absence of mtDNA genetic differentiation. Despite the limitations associated with mtDNA data, our study shows that for the Turkic, there is a slight but significant mtDNA genetic differentiation between ethnic groups. This is consistent with the results on the Y chromosome revealing genetic differentiation between ethnic groups. The refutation of the common ancestry hypothesis for several of these ethnic groups, together with the observation of inter-group genetic differentiation, suggest that genetic boundaries separate them. Conclusion Since the work of Frederik Barth in the 1970s [12] anthropologists have placed emphasis not only on presumed common ancestry and shared cultural traits, but also on the "boundaries" used by individuals in order to distinguish themselves from members of other ethnic groups. These boundaries can take different forms - racial, cultural, linguistic, economic, religious, and political - and may be more or less porous. The persistence of such boundaries implies rules. One of the most common rules around the world is an endogamous preference for mate choice. In conclusion, our analysis of uniparental markers lends support to Barth's hypothesis by indicating that ethnicity, at least for two (and marginally three) of the Turkic groups in Central Asia, should be seen as a constructed social system maintaining genetic boundaries with other ethnic groups rather than the outcome of common genetic ancestry. It further highlights the differences between Turkic and Indo-Iranian populations in their sex-specific differentiation and shows good congruence with anthropological data. BMC Genetics 2009 10:49 |
|
|
|
Post by Admin on Jun 18, 2019 18:01:10 GMT
High gene diversity of cytochrome B in the Uyghur population 1190 bp PCR fragments were amplified in all studied samples and 1140 bp of DNA fragment encoding CYTB (positions 14747–15886) were sequenced. Compared with the standard reference sequence (rCRS), a total of 102 mutant sites were observed in the studied 240 samples (Additional file 1: Table S1). The number of mutation sites in the samples varied from 0 to 10 with an average of 5.126. There were no deletions and/or insertions observed. Table 1 lists the most common and group-unique mutation positions. Position 15326 A –G transition occurred in almost all samples except 2 samples (one from Sanji and another one from Bortala). The second highest mutation position was nt 14766 C-T with an average frequency of 82.92% observed in 240 studied Uyghur individuals. More than 90% of Uyghur from Korla, Kumul, Sanji and Turpan had a 14766 C-T mutation, while this mutation occurred less than 80% in the individuals from Aksu (77.14%), Gulja (73. 68%), Hotan (78.95%), and Kashgar (79.10%). The third dominant mutation positions were 14783 T-C (36.25%), 15043 G-A (36.25%) and 15301 G-A (35.42%). Position 14783 T/C, 15043G/A, and 15301 G/A mutations simultaneously took place with an average frequency of 34.17% in the overall Uyghurs. The frequency of the triple 14783 T/C-15043G/A-15301G/A mutant varied from population to population, from region to region (Figure 1). In general, the frequency of the triple 14783 T/C-15043G/A-15301G/A mutant among the ten regional subpopulations decreased in the order of Kumul, Sanji, Turpan, Bortala, Atush, Kashgar, Aksu and Hotan, in line with their geographic location from north to south. The lowest frequency of this triple mutant (15.79%) was observed in the group from Hotan which is located in the south end of Xinjiang, adjacent to Tibet, India and Pakistan. The north end regions, geographically closer to Mongolia, had similar frequencies of the triple 14783 T/C-15043G/A-15301G/A mutant to the Mongolian people(our unpublished data). 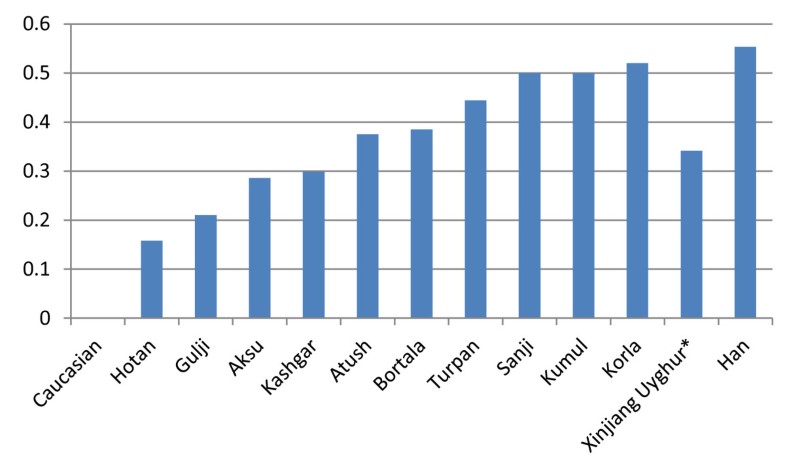 Figure 1 The frequency of triple 14783 T/C-15043G/A-15301G/A mutant. Studying mutations among the regions, we observed the presence of regional group specific mutations in the CYTB sequence (Table 1). The mutations 14927 A/G and 15440 T/C were only observed in the Bortala with a frequency of 15.38%, 15746 A/G only in Kumul (30.00%), and 14857 T/C only in Turpan (11.11%). Only three samples of the total 240 Uyghurs showed a nucleotide change at position 14798 which occurs more frequently in Caucasians with a frequency of 0.2083, but not in other Asian groups [14]. Founder / bottleneck haplotypes of CYTB in the Uyghur There were 93 different haplotypes observed in the 240 Uyghur samples (Additional file 2: Table S2). Due to absence of a standard for assignment of haplotypes, we called each different sequence as an individual haplotype generated by DnaSP5.0. The frequencies of different haplotypes varied between different regions (Additional file 2: Table S2). The standard reference sequence was observed only in one sample. Haplotype 15 (15326G, in which only one nucleotide mutation positioning 15326 existed) was the most dominant haplotype with a frequency of 13.75% (33/240) in the study. The second dominate haplotype was haplotype 13 (14766 T, 15326G) observed in 31 individuals out of 240 (12.92%), followed by haplotype 11 (14766 T, 14783C, 15043A, 15301A, 15326G) with a frequency of 11.25% which is the most abundant haplotype in Chinese [14]. Haplotype 7 (14766 T, 14783C, 15043A, 15204C, 15301A, 15326G, 15487 T) was observed in 11 people. Haplotype 16 (14766 T, 15326G, 15884C), as well as Haplotype 19 (14766 T, 15326G, 15693C) existed in seven individuals. Haplotype 2 (14766 T, 14905A, 15326G, 15452A, 15607G) was shared by 6 people, and haplotype 17 (14766 T, 15326G, 15535 T) shared in four people. Six sequences appeared three times (H8, H31, H42, H50, H83, and H70), and 17 sequences were observed twice. The other 62 sequences or haplotypes were only observed once. The network of haplotypes showed the existence of two major clusters (Figure 2): cluster 1 (left side of network) consisting of two-thirds of total haplotypes including H13 and H15, and cluster 2 (right side) consisting of one-third of total haplotypes including H11. The network showed that there are founder/ bottleneck haplotypes existing in the Xinjiang Uyghur which are also observed in the Mongolians (our unpublished data). 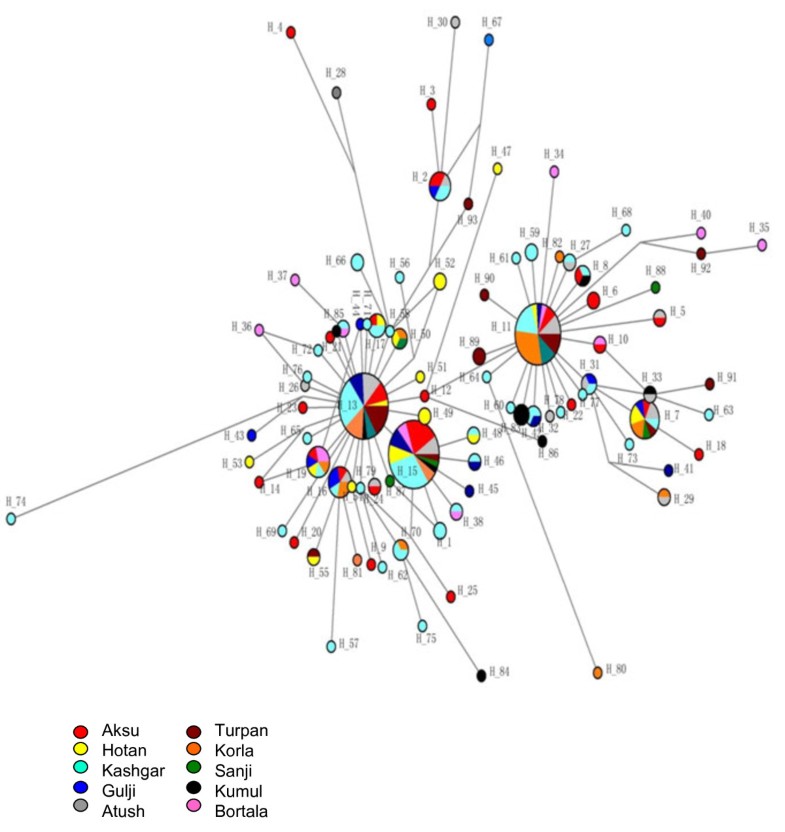 Grouping samples into different geographic locations; there were 24 haplotypes observed in 35 Aksu individuals, 16 in 24 Atush, 11 in 13 Bortala, 14 in 19 Gulja, 15 in 19 Hotan, 41 in 67 Kashgar, 13 in 25 Korla, 8 in10 Kumul, 7 in 10 Sanji, and 11 in 18 Turpan individuals. Haplotype 15 (15326G) was predominantly found in the Aksu with a frequency of 20% and in the Kashgar with a frequency of 14.93%. Haplotype 13 (14766 T, 15326G) existed most frequently in the Turpan (27.78%), Atush (16.67%) and Korla (16%), but was not in the Bortala nor Kumul. Haplotype 11 (14766 T, 14783C, 15043A, 15301A, 15326G) appeared frequently in the Korla (32%), Sanji (30%), Turpan (16.67%), and Atush (12.5%). Haplotype 83 (14766 T, 14783C, 15043A, 15301A, 15326G, 15746G) was only observed in the Kumul group with a frequency of 30%, but not in other groups thereby showing region-specificity. Haplotype 89 (14766 T, 14783C, 14857C, 15043A, 15301A, 15326G) was observed only in the Turpan with a frequency of 11.11%, while haplotype 59 (14766 T, 14783C, 15043A, 15301A, 15326G, 15673A) and haplotype 66 (14766 T, 15314A, 15326G, 15452A) were only found in the Kashgar group with a frequency of 2.99%, respectively. Different regional Uyghur represent different genetic features In order to investigate the genetic diversity of CYTB in ten regional Xinjiang Uyghurs, MDS analysis was first conducted within ten regional Xinjiang Uyghurs and groups were made based on their geography. As shown in Figure 3A, ten regions were separated from each other by dimension 1 and some subpopulations were gathered closer than others. Kumul, Turpan, Sanji, Atush and Korla were located closely at the left side in the MDS plot forming cluster 1, while Kashgar, Aksu, Hotan and Gulja sit on the right side and formed cluster 2. Bortala was almost in the middle in the MDS plot. However, in dimension 2, Bortala was closely distributed to Kumul (a northern Xinjiang place), but still be separated from cluster 2 consisting of most of southern Xinjiang regions. 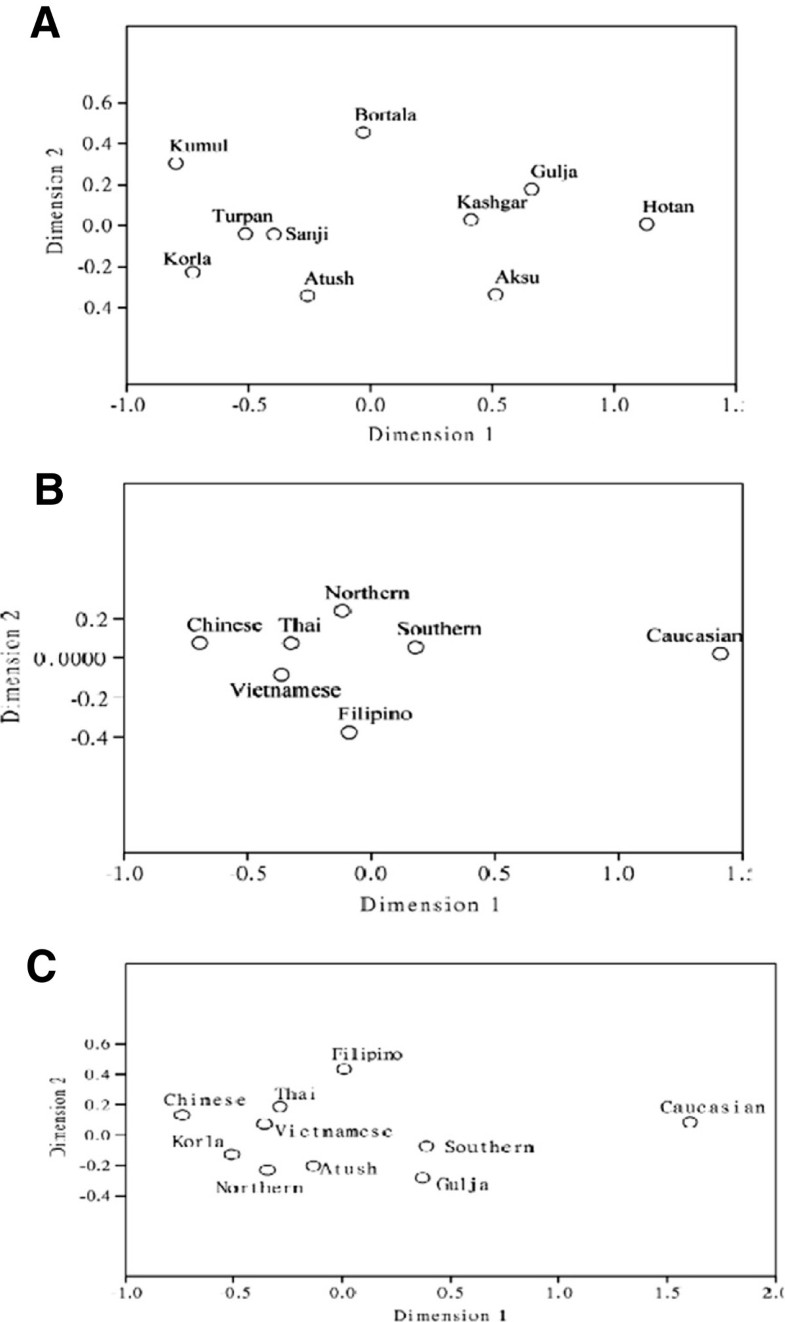 Figure 3 Multiple dimension scale plot by SPSS. Tianshan and the ancient Silk road are a geographic dividing line separating Xinjiang into two parts: Southern Xinjiang (Nanjiang) and Northern Xinjiang (Beijiang). Nanjiang consists of Kashgar, Aksu, Hotan, Atush and Korla, while Kumul, Turpan, Sanji, Gulja and Bortala belong to Beijiang. Accordingly we divided ten regional Xinjiang Uyghurs into two subgroups: Southern Uyghur (groups living in Nanjiang) and Northern Uyghur groups (living in Beijiang). We then performed MDS analysis with the Southern and Northern Uyghur and other populations [14, 15, 16, 17, 18] in order to reveal the genetic relationships among these populations. Figure 3B shows that both Northern and Southern Uyghurs and other 4 Asian populations (Thai, Vietnamese, Filipino and Chinese) were distributed closely to the left in MDS plot and formed a cluster, while Caucasians were isolated far away from them and the cluster, suggesting that both Southern and Northern Uyghur are closer to Asian in genetics than to Caucasian. In addition, the Northern Uyghur was separated from the Southern Uyghur. In comparison with the Southern Uyghur, the Northern Uyghur were more closely located to the Chinese. Furthermore, we noticed that Gulja Uyghurs who geographically reside in northern Xinjiang appeared closely related to the southern subgroups (Hotan, Kashgar and Aksu) in the MDS plot, while geographic southern Uyghur subgroups Korla and Atush were close to the northern subgroups (Kumul, Sanji and Turpan) as shown in Figure 3A. Therefore we regrouped Uyghur samples by subtracting Gulja from northern group, Korla and Atush from the southern group, and conducted the third MDS analysis using new designed groups (Figure 3C). This regrouped MDS plot displayed that the northern group (Turpan, Kumul, Sanji and Bortala) was separated further away from the southern group (Hotan, Aksu and Kashgar). Korla was distributed between Chinese and the new northern group with similarly close distance to both of them. The Gulja and the new southern group formed a cluster, clearly separated from the northern group and Caucasian. In contrast, Atush was distributed relatively more closely to northern Uyghur. The patterns of haplotypes of CYTB reflected migration history and origin of Uyghur To further explore the genetic linkage, the genetic distances between each of the regional groups were determined (Table 3). Genetic distances between regions shown in Table 3 nicely reflected their geographic distance. There were significant differences in genetic distance between south region Hotan and north regions Kumul and Turpan. Interestingly, there were significant differences between the south region Korla and Hotan and between Korla and Kashgar. An unrooted NJ tree was constructed based on the ten regional groups’ FSTdistances as seen in Table 3 (Figure 4A). The tree showed that there were three branches: Hotan and Gulja formed one branch; Turpan, Sanji, Kumul and Korla formed the second branch, Aksu, Kashgar, Bortala and Atush formed the third Branch. The tree also showed that there were genetic diversities within branches with the exception of the first cluster. 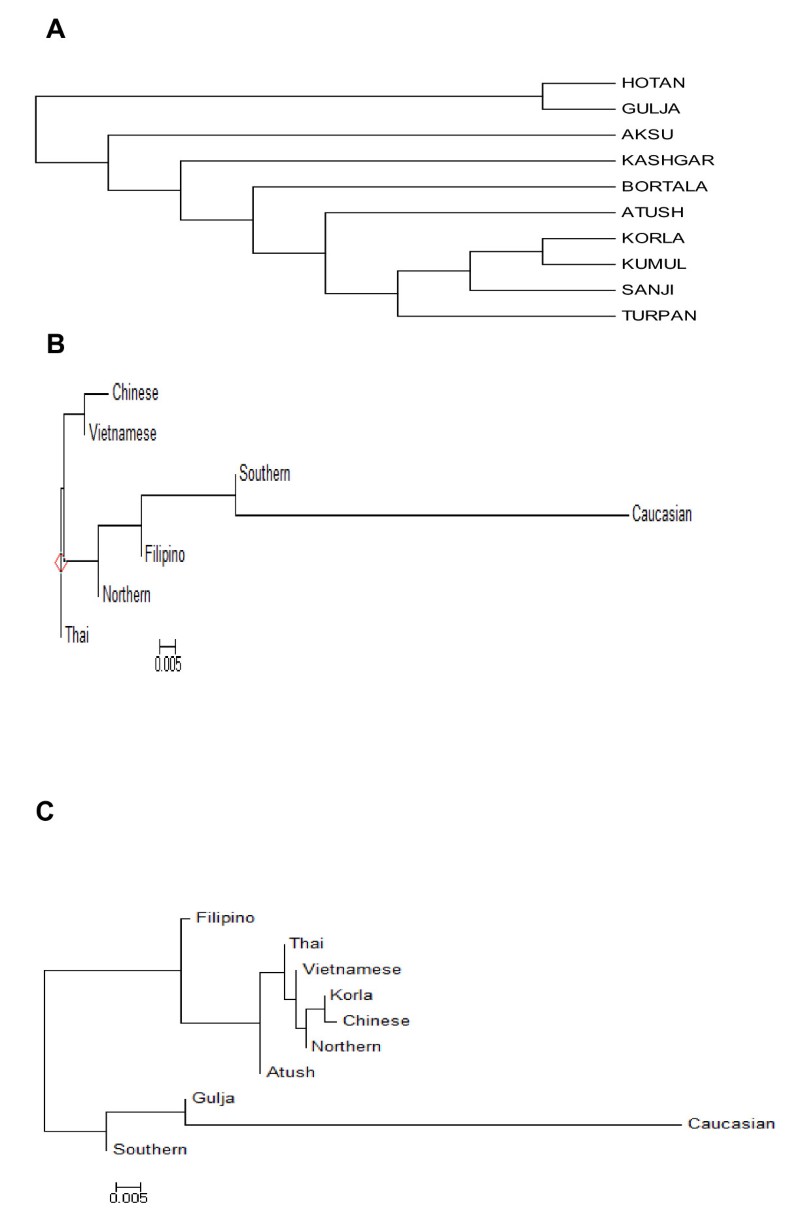 Figure 4 Unrooted Neighbor-joining tree. Using genetic distance in Table 3(A), Table 4(B) and Table 5(C) an unrooted Neighbor-joint trees were constructed using Phylips 3.6.9 software. Other populations were cited from [14]. With the same strategies in MDS analysis, we regrouped samples and calculated genetic distance (Tables 4 and 5) and constructed phylogenetic trees (Figure 4B and 4C) using new assigned groups. Table 5 showed the results of genetic distance generated by regrouping the Uyghur into two major groups--Southern and Northern Uyghur. Figure 4B and 4C are NJ trees constructed with the genetic distances from Tables 4 and 5. We found that both the southern and northern groups showed shorter genetic distance from Chinese than from Caucasian. There were significance in genetic distance between the southern Uyghur and Caucasian, between the southern Uyghur and Chinese, and between the northern Uyghur and Caucasian, while there was no significance between the northern Uyghur and Chinese. The NJ tree (Figure 4B) intuitively showed the genetic relationship between these populations, supporting Table 4 results. Table 5 further confirmed the genetic relationship between the southern, northern, Chinese and Caucasian. More importantly, Table 5 and Figure 4C demonstrated that geographic southern cities Atush and Korla showed gene similarity to the northern Uyghur, although northern city Gulja is genetically similar to the Southern Uyghur, but not to the northern Uyghur. The Korla Uyghur was completely different to the southern Uyghur (Hotan, Aksu and Kashgar). The Uyghurs are a Turkic ethnic group living in Eastern and Central Asia. The ancestors of the Uyghur tribe were Turkic pastoralists called Tiele in Northern China, Mongolia, and the Altay Mountains. Due to wars and environmental stress, Uyghur continued migrating from north to south. From the historic perspective, Uyghur originated from Mongolians, rather than Caucasians and inherited Mongolia genetics. The Uyghur population was gradually diluted as they migrated from north to south. Our data on the frequency of triple 14783 T/C-15043G/A-15301G/A mutant and founder/bottle neck haplotypes demonstrated that the Uyghur originated from Mongolia, migrated from north to south, supporting historic reports. In this study, we found that nucleotide positions with most frequent mutation were 14766, 14783, 15043, and 15302, which were most commonly seen in Asians including the Chinese Han population [14]. Mutation at position 14766 occurs in more than 93% of Asian samples, but less than 0.72% of Caucasians [8, 14]. The frequencies of mutation at the position 14766 in the ten different geographic Uyghur samples varied from 0.73 to 0.94. The frequencies of 14766 mutation declined from the eastern Tarim Basin to the western Tarim Basin, reflecting a clear geographic pattern. This implies that the East Asian portion of genetics was gradually diluted as people migrated from the east to the west of Xinjiang, and from north to south. Mutations occurring at position of 14783, 15043, and 15302 showed the same trend among the ten Uyghur groups as position 14766. Mutations at the above three positions were seldom observed in the Caucasian population. In contrast, mutation at position 14798 that is Caucasian specific was observed in only one Aksu sample and two Hotan samples. Taken together, we found that at the cytochrome B gene, Uyghurs generally have more imprint of East Asian genetic portion than that of Caucasian. These genetic results are in agreement with the history of Uyghur formation. The Uyghurs living in the Nanjiang are different to Beijiang, and the southern Uyghur have relatively less influence from East Asians than the northern. Our data showed that in the same ethnic group, people residing at different places have genetic differences. In this study, we reported that Uyghur from different geographic locations in Xinjiang have differences in the percentage of European/East Asian ancestry component, distinctly by the difference between Aksu/Hotan and Kumul or Korla. There is a significant difference between the south (Hotan, Kashgar, and Aksu ) and the north of Xinjiang (Kumul, Bortala, Turpan and Sanji). East Asian ancestry dominates the Uyghur from the north, while European ancestry imprints more on the southern Uyghur. In addition, we observed that Uyghurs living in two geographically south cities Atush and Korla shared northern Uyghur genetics (Kumul, Turpan and Sanji), in contrast with the southern Uyghur, while Uyghurs from Gulja which is located in the north of Tianshan in geography presented the southern regional Uyghur genetic features. Demographic records show that the dominant ethnic group is Kyrgyz who defeated the Uyghurs in AD 840, despite the fact that Atush is located in the south of Tianshan [Wikipedia, the free encyclopedia, History of the Kyrgyzstan]. Moreover, there were intermarriages in the Uyghur living in the Atush region. This might explain why the gene pattern of cytochrome B in the Atush Uyghurs was between that of the southern and northern Uyghur group, different from the other three southern group samples. As for Gulja, there were two large migrations of the southern Uyghur from south to north Gulja in history. Over time, the migrated southern Uyghurs expanded in Gulja and became the largest minority in Gulja [Wikipedia, the free encyclopedia, History of the Uyghur people.]. As a result, the Gulja Uyghur was and still is a branch of southern Uyghur, having little relationship with the northern Uyghur, which is in line with our data that the Uyghur from Gulja shares similar genetic characters with the Southern Uyghur. Although Korla is located in the south of Tianshan belonging to Nanjiang ( southern of Xinjiang), it is also adjacent to Turpan and Sanji. Korla is located in Bayingolin Mongol Autonomous Prefecture where the current major population is Chinese Han. As early as 94 CE, the Chinese government and military started to administrate this area and forced different populations to exchange and mix. The results from CYTB genotyping are consistent with that from the control region of mtDNA (unpublished data). Our data showed that the Uyghurs from Korla in genetics are different to the south Xinjiang Uyghurs. BMC Genetics201314:100 |
|
|
|
Post by Admin on Jul 19, 2019 18:00:08 GMT
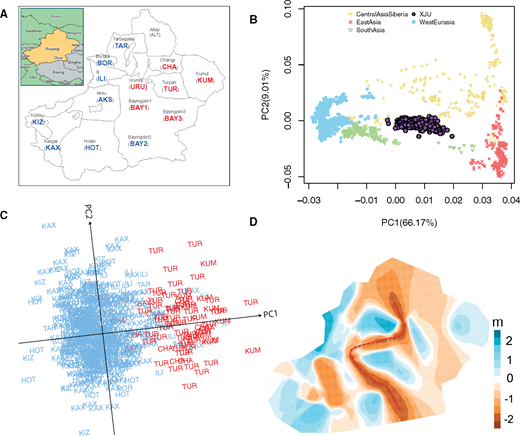 FIG. 1. Xinjiang, previously known as “Xiyu” or the “Western Region”, is a vast territory located in northwestern China, spanning over 1.6 million square kilometers. Xinjiang has been crucial in human history due to its strategic location. It is crossed by the well-known route of the historical Silk Road (Mair 1995) and borders the countries of Afghanistan, India, Kazakhstan, Kyrgyzstan, Tajikistan, Pakistan, Russia, and Mongolia. However, investigations on human genetic diversity in these regions are limited. With a population size of >10 million, the Uyghur people used to be one of the most influential ethnic groups in Xinjiang. They are believed to be descendants of the most ancient Turkic tribes with mixed Caucasian and East Asian ancestries (Balfour 1985). Therefore, the Uyghur people are a key ethnic group for understanding both the history of recent genetic exchanges between Eastern and Western Eurasian people, and the impact of genetic admixture on population genetic diversity in Eurasia. Nonetheless, the origins and history of the Uyghur people remain poorly understood and thus have been the topic of intense debates. Uyghur historians view the Uyghurs as the original inhabitants of Xinjiang, having occupied the area for 6,400–9,000 years (Tursun 2008). Well-preserved Tarim mummies exhibiting European features were discovered and dated 4,000–2,000 years ago (ya), indicating the migration of people of European ancestry into Xinjiang at the beginning of the Bronze Age (Li etal. 2015). According to ancient Chinese historical texts (e.g., Book of Wei), the Uyghurs in Xinjiang originated from the Tiele tribes, a confederation of Turkic people that was established after the disintegration of the Xiongnu confederacy, and migrated to Xinjiang from Mongolia after the collapse of the Uyghur Khaganate during the ninth century. Numerous contemporary Western scholars, however, do not consider modern Uyghurs to be of direct linear descent from the old Uyghur Khaganate of Mongolia. Rather, they consider them to be descendants of a number of people, one of which are the ancient Uyghurs (Henders 2006; Millward 2007; Millward and Perdue 2004). Genetic studies based on mtDNA (Yao etal. 2004), Y chromosome (Wells etal. 2001), and autosomal data (Hui Li and Kidd 2009; Xu etal. 2008; Xu and Jin 2008; Xu and Jin 2009; Xu etal. 2009) have shown that modern Uyghurs are an admixed population with ancestries that were mainly derived from Eastern and Western Eurasian people. However, previous studies either focused on a single geographical population, or a limited number of markers, and thus the global population structure and admixture of the Xinjiang’s Uyghurs (XJU) remain unclear. In the present study, we genotyped 951 Uyghur samples from 14 geographical regions (prefectures) on the Illumina OminiZhongHua and Affymetrix Genome-Wide Human SNP 6.0 array (fig. 1A). Our data well represented all regions where the Uyghur people reside. With this unprecedented data set, we attempted to comprehensively characterize the ancestral makeup of XJU, uncover their origins, and reconstruct their admixture history. Genetic affinity and population structure of Xinjiang’s Uyghur (XJU). (A) Distribution map of XJU samples. The abbreviated name of each region was colored according to figure 1C. No samples were collected from Altay. (B) PCA of 951 XJU with reference populations from Central Asia Siberia, East Asia, South Asia, and West Eurasia. (C) PCA of 679 XJU individuals from 11 regions (samples from Aksu (AKS), Bayingolin1 (BAY1), and Urumqi (URU) were excluded). (D) Effective migration rates of XJU individuals based on EEMS analysis with 700 demes. Dark blue color indicates higher migration rate, whereas brown color indicates lower migration rate. Red dashed line indicates the putative genetic barrier. Genetic Affinity and Population Structure of XJU To understand the general patterns of relatedness between XJU and worldwide populations, we analyzed genome-wide data of XJU together with 203 worldwide populations from the Human Origins data set (Lazaridis etal. 2014). Reference populations were classified into five groups representing major geographical regions: Africa, America, Central Asia/Siberia (SIB), East Asia (EA), Oceania, South Asia (SA), and West Eurasia (WE) (see Materials and Methods). Principal component analysis (PCA) showed that XJU lay along the axis between groups from WE and EA (supplementary fig. S1, Supplementary Material online). After removing populations outside of Eurasia from PCA, the XJU samples were surrounded by populations from SIB, EA, SA, and WE (fig. 1B). Among these neighboring populations, XJU was most closely related to the Central/South Asian populations, followed by the EA/WE populations. Interestingly, the Turkish were not the group with the closest relationship with XJU (FST = 0.0180), whereas the Hazara (FST = 0.0098) and Uzbek (FST = 0.0130) groups showed significantly less differentiation from XJU (supplementary fig. S2, Supplementary Material online). We further explored the substructures of XJU using PCA and observed that individuals from the same region tended to cluster together (supplementary fig. S3, Supplementary Material online). In particular, samples from Southwest Xinjiang, e.g., Hotan, Kizilsu, Kaxgar, and Bortala, could be separated from those from Northeast Xinjiang, e.g., Turpan, Changji, and Kumul. On the other hand, samples from some regions distributed sparsely, such as those from Aksu and Bayingolin1 exhibited higher diversity in these regions. The largest pairwise genetic distance (as measured by FST) was between Kumul and Bortala, which are located in East and West Xinjiang, respectively, although these are not the most distant geographic pair (supplementary fig. S4, Supplementary Material online). Despite the high diversity, the extent of genetic differentiation between different regional populations was still significantly smaller than that between XJU and the nonXJU populations (supplementary table S1, Supplementary Material online). Our analysis showed that PC1 had a significant correlation with longitude (P = 8.58 × 10⁻⁴) but not latitude (P = 0.992) (supplementary fig. S5, Supplementary Material online). Longitude and latitude could jointly explain 68.0% of the total variance of genetic differentiation on PC1 among regional populations. XJU samples were thus classified into “Northeast” and “Southwest” clusters, which correspond to their geographical distribution (fig. 1C). Significant correlation between genetic distance (FST) and geographical distance (great circle distance) was observed in XJU (supplementary fig. S6, Supplementary Material online, R2 = 0.178, P = 1.22 × 10⁻⁴). We further applied EEMS analysis and identified a distinct genetic barrier that roughly runs from north to south (fig. 1D). The barrier starts from the Altai Mountains, moving around Urumqi on its way to south, and coincides with the Tian Shan Mountains for a distance; then, it turns south, extending into the Taklamakan Desert, and ending at the Kunlun Mountains (supplementary fig. S7, Supplementary Material online). This pattern coincides with the observed stratification of XJU samples in PCA but was in contrast to the north-south divergence assuming the east–west chain of the Tianshan Mountains to be a natural barrier. A possible explanation could be that gene flow from the eastern and western neighboring populations has some considerable influence on the genetic makeups of XJU, which will be discussed in the next sections. |
|
|
|
Post by Admin on Jul 20, 2019 18:39:03 GMT
Ancestral Makeup of XJU To unveil the ancestry makeup of XJU and investigate the genetic influence of the surrounding populations, we performed ADMIXTURE analysis of XJU combined with global populations, assuming that K ranged from 2 to 20 (supplementary fig. S8 and table S2, Supplementary Material online). At K = 4, the ancestral makeup of XJU could be explained by two major ancestral components that were represented by EA and WE populations, respectively (supplementary fig. S8, Supplementary Material online), which is in agreement with the findings of previous studies (Li etal. 2009; Xu etal. 2008). Southwest XJU showed a larger proportion of West Eurasian ancestry, particularly Kizilsu XJU (49.9%). The proportion gradually decreased towards the northeast XJU, and was lowest in Kumul XJU (33.8%), whereas the distribution of East Asian ancestry in XJU was in the opposite direction (supplementary fig. S9, Supplementary Material online). From K = 8 to K = 20 in ADMIXTURE analysis, different XJU regional populations shared the majority of their ancestral makeup with populations from EA, SIB, WE, and SA (supplementary fig. S8, Supplementary Material online). These four major ancestries of XJU were confirmed by running ADMIXTURE for XJU together with representative populations of EA, SIB, WE, and SA ancestries (K = 3–8, see Materials and Methods, supplementary fig. S10, Supplementary Material online). The estimated ancestral proportions, as confirmed by reduced data sets (K = 4), are as follows: EA (28.8%–46.5%), SIB (15.2%–16.8%), WE (24.9%–36.6%), and SA (12.0%–19.9%) (fig. 2A and B). In contrast, the Turkish populations share the majority of their ancestral makeup with populations from WE (74.8%) and SA (16.5%), whereas those from the East is considerably lower (4.03% EA and 4.66% SIB) (fig. 2A). A significant difference in admixture proportions was observed between Northeast and Southwest XJU (supplementary fig. S11 and S12, Supplementary Material online). WE ancestry proportions were positively correlated with SA ancestry proportions in XJU across different regions, and both were negatively correlated with longitudes from Southwest to Northeast, whereas EA and SIB ancestry in XJU were positively correlated with longitudes (fig. 2C). However, none of the ancestries were significantly correlated with latitude (fig. 2C and supplementary fig. S13, Supplementary Material online), indicating that the gene flow in the east–west direction was more frequent than in the north–south direction. Therefore, the observed southwest–northeast differentiation within XJU likely resulted from a joint effect of the barrier of the Tianshan Mountains and gene flow from eastern and western neighboring populations. 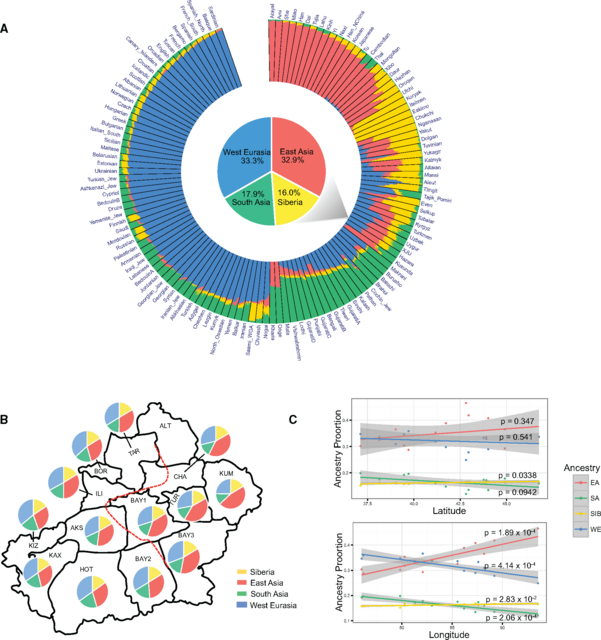 FIG. 2. Ancestry makeup and variations in admixture proportion within XJU. (A) ADMIXTURE results of XJU with West Eurasia, South Asia, East Asia, and Central Asia Siberia populations at K = 4 (in order to show a full picture of Eurasian populations, all populations of the four major ancestries (including representative populations) were included.). Proportion of each ancestry in XJU was highlighted with a pie chart. Height of the bar is proportional to admixture proportion. (B) Admixture proportions of the four major ancestries in regional XJU based on ADMIXTURE analysis in figure 2A. Red dashed line indicates the genetic barrier from EEMS analysis in figure 1D. (C) Correlations between proportions of four major ancestries and latitudes as well as longitudes of XJU across regions. Grey region indicate 95% confidence region for each regression fit. EA = East Asia; SA = South Asia; SIB = Siberia; WE = West Eurasia. Population Admixture and Admixture History We further applied admixture history graph (AHG) analysis (Pugach etal. 2016) to determine admixture chronology, i.e., the chronology of introduction of each ancestry into XJU’s gene pool (see Methods). The results indicated that the WE ancestry first admixed with the SA ancestry in the West, whereas the SIB ancestry admixed with the EA ancestry in the East. Next, the mixed Western ancestries (WE-SA) and the mixed Eastern ancestries (EA-SIB) joined together to form the gene pool of XJU (fig. 3A and supplementary fig. S14, Supplementary Material online). The AHG results were highly consistent across ADMIXTURE replicates (supplementary figs. S15 and S16, Supplementary Material online). This configuration supported the inference generated by Globetrotter (Hellenthal etal. 2014), in which Iranians and Mongolians are the best representative ancestral origins of the Uyghur admixture. Among other Central Asian populations, our analysis showed that Uzbek and Turkmen own the same admixture configuration as XJU. 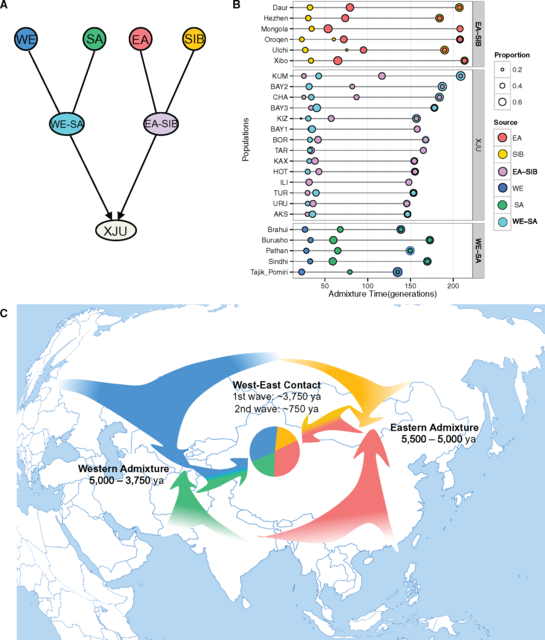 FIG. 3. Population admixture and admixture history of XJU. (A) The most likely admixture topology of the four major ancestries in XJU based on Admixture History Graph (AHG) results. Ancestries represented as colored balls were as follows: EA (Red); SIB (Gold); EA-SIB (Plum); WE (Blue); SA (Green); WE-SA (Cyan). (B) Admixture time of EA-SIB admixture, WE-SA admixture, and West–East admixture in XJU by MultiWaver. Representative populations (represented as colored balls) used in MultiWaver were as follows: EA = Atayal; SIB = Nganasan; EA-SIB = Hezhen; WE = Sardinian; SA = Mala; WE-SA = Tajik_pomiri. Representative populations were selected according to ADMIXTURE results with their major components (>10%) limited to representative ancestries. XJU from different regions in Xinjiang were inferred separately. (C) Schematic map showing the possible admixture model of XJU. Arrows in different colors indicate ancestral sources and directions of the gene flow. If the inferred configuration for XJU is true, then we would expect some other existing (or once existing) populations that show signals of EA-SIB admixture or WE-SA admixture. Therefore, we conducted a systematic analysis detecting each Eurasian population in the Human Origins data set for such admixture signals, including the EA-SIB, SIB-WE, WE-SA, and SA-EA admixtures (supplementary fig. S17 and table S3, Supplementary Material online). Strong signals were observed for the EA-SIB, SIB-WE, and WE-SA admixtures in Eurasia, but not for the SA-EA admixture. The limited SA-EA admixture signal could have resulted from geographic barriers such as the Himalaya Mountains situated between South Asia and East Asia. In contrast, the vast Eurasia steppe stretching from Eastern Europe, through Central Asia, Siberia, to the northern part of East Asia facilitated gene flow between the neighboring populations living on the steppe. Given the ([WE, SA], [EA, SIB]) admixture model we established in XJU data, we expect that the WE-SA and EA-SIB admixtures have occurred earlier than the West (harboring WE and SA ancestries)—East (harboring EA and SIB ancestries) admixture. We estimated the EA-SIB admixture time based on Eastern admixed populations (Daur, Hezhen, Mongolian, Oroqen, Ulchi, and Xibo), whose major components (proportion >10%) were limited to EA and SIB (fig. 2A), and inferred WE-SA admixture time based on Western admixed populations (Brahui, Burusho, Pathan, Sindhi, and Tajik_Pomiri), whose major components were limited to WE and SA (fig. 2A). We estimated the time for West–East contacts based on the data of XJU by using AdmixInfer (Ni etal. 2016). The results showed that the WE-SA admixture occurred 120∼100 generations ago under a continuous gene flow (CGF) model, EA-SIB occurred 140∼100 generations ago under a CGF model, and the West–East admixture occurred 100∼90 generations ago under a gradual admixture model (supplementary fig. S18, Supplementary Material online). The admixture dates for most Eastern admixed populations were earlier than the West-East admixture, thereby providing additional support for the admixture topology earlier described. However, this particular pattern was not significant in Western admixed populations, which might due to differences in true source populations from those analyzed. Because AdmixInfer analysis indicated multiple waves of admixture in the history of XJU, we used MultiWaver (Ni unpublished data) to infer multiple waves from multiple sources in admixed populations (fig. 3B). The first wave of WE-SA admixture was estimated to have occurred around 180∼130 generations ago (variations exist across populations), followed by subsequent gene flow. In the East, the first wave of EA-SIB admixture was estimated to have occurred 225∼180 generations ago, and was also followed by subsequent gene flow. Two waves were detected in most regional populations of XJU, with the first admixture being estimated to have occurred around 150 generations ago, followed by a second wave at around 30 generations ago (fig. 3B). The 95% confidence intervals of the admixture dates for each population were obtained from 1,000 bootstrapping repeats, and the intervals were generally small with a range of 4–38% of each point estimation (supplementary table S4, Supplementary Material online). Simulations were performed to specifically evaluate the performance of MultiWaver in detecting two-wave admixtures (see supplementary text S1, Supplementary Material online). Our results confirmed the ability of MultiWaver to determine the correct admixture model and detect ancient admixture events. Nevertheless, MultiWaver tends to underestimate the time of the first wave in cases involving very ancient admixtures (>100 generations). Despite this slight underestimation, the time for the first wave admixture, i.e., ∼3750 ya, assuming a generation time of 25 years (McEvoy etal. 2011) was much earlier than that reported by previous studies (Hellenthal etal. 2014; Patterson etal. 2012; Loh etal. 2013; Xu and Jin 2008). Interestingly, this early wave of admixture largely overlapped with the range of the dating of mummies exhibiting European features that were discovered in the Tarim basin, which is situated in southern Xinjiang (4,000–2,000 ya) (Hemphill and Mallory 2004; Mair 1995). Our estimation of time for the second wave was around 30 generations ago (fig. 3B), which coincides with the estimate of a recent study using a different method (Patterson etal. 2012). A summary of the admixture history of the Uyghurs based on our analyses is depicted in figure 3C. Further anlaysis using MultiWaver indicated that some regional XJU groups such as from Kumul, Bayingolin2, and Changji showed slightly larger time estimations for the first admixture wave, as well as an additional admixture wave from the east at around 100∼80 generations ago (fig. 3B). On the one hand, these results suggested a more complex admixture history for XJU; on the other hand, it was possible that MultiWaver underestimated the number of admixture waves, which could occur in case of long-term isolation and recent gene flow. To find evidence of recent gene flow in XJU, we categorized the local ancestry tracts in XJU into the East origin and West origin, and binned the tracts based on their lengths. After correction for admixture proportion, the results showed that long tracts (>0.2 Morgan) of the West origin were significantly enriched in Southwest XJU groups such as Hotan and Kizilsu, whereas long tracts of East origin were significantly enriched in Northeast XJU groups such as Kumul and Turpan (supplementary fig. S19, Supplementary Material online). These results thus suggest recent gene flow (<5 generations) into XJU from west and east neighboring populations. We further estimated the admixture times of EA-SIB and WE-SA ancestral source populations using Southern Siberian and South Asian populations as references. The time of the first admixture in Southern Siberian populations such as Hezhen (∼180 generations ago) and Oroqen (∼200 generations ago, fig. 3B), which could still be underestimated according to our simulation results, was older than previous estimates based on StepPCO (both at ∼70 generations ago) (Pugach etal. 2016). StepPCO assumes a single wave admixture, and thus it is also likely to underestimate the time for the ancient admixture events given multiple admixture waves actually occurred in the history of the populations studied. A recent study has also revealed that both prehistoric SIB and EA lineages in the ancient populations that were located in northern Xinjiang underwent admixture between Siberians and East Asians dating back to the early Bronze Age (3900–3300 ya) (Gao etal. 2015). Taken together, we unveiled a more complex scenario of ancestral origins, population structure, and admixture history for XJU than previously reported. The two-wave model we proposed here does not necessarily mean there were only two admixture events that had occurred in the history of XJU. Rather, it suggests that population admixture occurred more than once during human dispersal in Xinjiang and its surrounding areas. The Silk Road was not a single route, but rather a series of routes (Wood 2002), and Xinjiang is a territory with a documented history of at least 2,500 years and populated by a succession of peoples and empires during the course of its history. Therefore, the vast territory is expected to have experienced a complex scenario of genetic admixture between populations from all around Eurasia. Further studies of over ten other ethnic groups residing in the area such as the Han Chinese, Hui, Kazakhs, Kyrgyz, Mongols, Russians, and Tajiks, together with information of archaeological remains and ancient DNA, are expected to provide further insights into the complete picture of human dispersal in Xinjiang and all of Eurasia. Molecular Biology and Evolution, Volume 34, Issue 10, October 2017, Pages 2572–2582 |
|
|
|
Post by Admin on Jul 27, 2019 19:07:23 GMT
Xinjiang, geographically located in northwestern China, has long been one of the major crossroads between eastern and western Eurasia. The Silk Road located in the heart of the Xinjiang documents the intensive connections between the East and the West since at least the Han dynasty (207 BCE–220 CE). Another well-known example is the Tocharian language, which is an extinct branch of the Indo-European language family but was found on the northern edge of the Tarim Basin, in southern Xinjiang during the first millennium CE. The origin of the Tocharian speakers has been long debated. Archaeologists have proposed two hypotheses, the “Bactrian Oasis hypothesis” and the “Steppe hypothesis,” to explain the first appearance of agricultural communities in the region ca. 2,000 BCE [11]. The “Bactrian oasis hypothesis” suggests the oasis-based agriculture may have spread from the Bactria-Margiana Archaeological Complex (BMAC) region with the incursion of nomadic groups particularly from the Andronovo Culture into the Tarim Basin in the early second millennium BCE [12]. In contrast, the “Steppe hypothesis” argues that the initial immigrants to Xinjiang were instead part of the Steppe populations most likely related to the Afanasievo culture from the Altai region north of the Tarim Basin. A number of craniometric studies have been carried out in Xinjiang indicating a degree of mixture between western Eurasian and eastern Eurasian people [11, 13]. Genetic evidence, especially from maternal mtDNA suggested that populations in Xinjiang were genetically admixed between eastern and western Eurasians dating back to at least early Bronze Age [7, 14]. This was further confirmed by a more recent study on genomic autosomal DNA, suggesting that present-day Uygurs in Xinjiang are genetically derived from various geographic groups, namely, Europeans (25%–37%), South Asians (12%–20%), Siberians (15%–17%), and East Asians (29%–47%) [6]. The Uygurs show a southwest to northeast substructure genetically [6]. The paternal lineage enriched in ancient Steppe populations was R1b. But nowadays the haplogroups R1a and R1b have both become characteristic lineages of the Xinjiang populations [15, 16]. However, those previous studies mainly focused on a few present-day populations or a limited number of markers on Y chromosome non-recombination (NRY) and mitochondrial regions, whose resolution is not enough to support either the Bactrian Oasis or the Steppe hypothesis. Therefore, the complicated admixture history between Eastern and Western Eurasian people remains unclear.  Figure 1 Geographic Location and Archaeological Excavations of the Shirenzigou Site To investigate temporal genetic dynamics, we generated genome-wide DNA sequences for 10 human individuals that were collected from the Shirenzigou site, an early Iron Age agro-pastoralist site on the northern slope of eastern Tianshan Mountains, Xinjiang, Northwestern China (Figure 1). This site showed multiple cultural features from the surrounding regions, such as the Yanbulake Culture of the southern slope of the Tianshan Mountains, the Pazyryk Culture from the Altai region as well as the excavated beads imported from the central region of China [17, 18]. Five of the sequenced samples were radiocarbon dated and all fall into the Iron Age (∼200–100 BCE) (Table 1). The samples were sequenced to genomic coverage from ∼0.04× to 0.75× (Table 1). The sequence reads show DNA damage patterns consistent with ancient DNA (Data S1A) and low contamination estimates for mtDNA (1%–2%) as well as for the X chromosomes in male samples (∼0%–1.5% for samples with at least 100 SNPs on X chromosome) (Data S1A). None of the individuals were found to share close kinship (Figure S1).
Table 1 Sample Information and Nuclear Human DNA Screening of All Shirenzigou Individuals

Sample Name Skeletal Elements C14 Dating (cal. BCE) Mean Coverage 1240k SNPs mtDNA Haplogroup Y Haplogroup

M4	petrous bone	380–200	0.0468	42,170	U4’9	–
M8R1	petrous bone	330–200	0.037	26,963	T1a1b	–
M15-1	petrous bone	N/A	0.1404	118,763	I1b	R1b1a1a2
M15-2	petrous bone	N/A	0.1029	98,380	U4	Q1a1a1
X3	petrous bone	N/A	0.1892	164,388	G3b	Q1a1b
M819	tooth	N/A	0.7558	478,956	H15b1	N/A
M820	tooth	285–230	0.2901	246,312	U5b2c	N/A
M012	tooth	N/A	0.1564	139
|
|


