Post by Admin on Nov 28, 2019 18:57:49 GMT
The unsupervised fineSTRUCTURE (FS) analysis of haplotypes37 placed individuals into genetic clusters that include: Philippine groups from lowland Luzon, Palawan, and Visayas (‘Philippines 1’), Malaysia, Sulawesi, East Asia, northern Melanesia (Bougainville), New Guinea, and western Europe (Supplementary Fig. S6). The GLOBETROTTER (GT) analysis38 produced strong statistical support for two separate episodes of admixture involving the ancestors of the Leeward Society Islanders (Fig. 3, Supplementary Table S8). The first represents an average contribution of ~6% western European ancestry, which is dated to 1749–1803 CE. This is consistent with documented contact during Cook’s three voyages of exploration1, which took place 1768-71, 1772-75 and 1776-80. The second episode is estimated to have occurred in an interval from ~1,200 to 1,700 BP (229–725 CE), and is composed of a minor component (~17%), comprising mainly northern Melanesian and New Guinea sources, and a major one (~83%), in which the largest contributions are attributable to the ‘Philippines 1’, Sulawesi, and Malaysian clusters. The chronology indicates that this episode occurred prior to the earliest widely accepted radiometric dates for the permanent settlement of eastern Polynesia, which centre on ~950 BP and come from archaeological sites on Rai’atea in the Leeward Society Isles26,27. In addition, the presence of northern Melanesian ancestry in the minor component of the second (older) episode of admixture (~8% of the genome) reflects some genetic contact with this region for the ancestors of the Leeward Society Islanders prior to 1,200–1,700 BP.
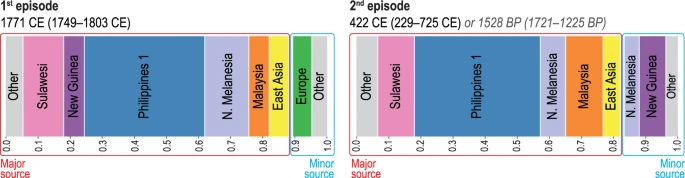
Figure 3
Population admixture events and inferred contact dates. Admixture events between genetic clusters obtained using fineSTRUCTURE37 (FS, Supplementary Fig. S6) and estimated with GLOBETROTTER38 (GT, Supplementary Table S8) for the Leeward Society Isles group. Each color represents a separate genetic cluster estimated with FS that acts as a donor to the recipient cluster (Leeward Society Isles) in the GT analysis. These donor groups are: Europe, East Asia, Malaysia, northern Melanesia (Bougainville), Philippines (‘Philippine 1’ cluster in FS), New Guinea and Sulawesi. ‘Other’ represents an amalgamation of groups contributing less than 3% ancestry to the admixture episodes in the genomes of Leeward Society Islanders. There is strong statistical support for two episodes of admixture; the ancient and recent events are represented by the left- and right-hand bar plots, respectively. Each episode involves two pairs of sources (minor and major); bar plots depict the inferred composition of the mixing sources for each, with admixture dates calculated using a generation time of 28 years. The dates for the older episode are given in the format of Common Era (CE) and Before Present (BP) for convenience. Detailed information about the inferred admixture episodes and composition of mixing sources is given in Supplementary Table S8.
In order to investigate the presence of the northern Melanesian contributions further, we performed a GT analysis on different subsets of Leeward Society Islanders as recipient groups (Supplementary Fig. S7, Supplementary Table S8). The results produced a spread of dates for the older episode of admixture, but always partitioned the northern Melanesian contribution into both sides of the admixture episode with point estimates ranging between ca 1,200 and 1,850 BP. Some of the variability in the dating may be due to the heterogeneous distribution of what appears to be recent admixture with people of East Asian ancestry (Figs 2B, S7, Supplementary Table S8), but the result is robust to variations in the makeup of the recipient group. This result, therefore, provides important evidence for either a period of migration from northern Melanesia into the ancestors of eastern Polynesians during the 3rd millennium BP, or a process of biological admixture taking place during the LCC period in northern Melanesia prior to the pioneering settlement of Polynesia ~3,000 BP.
A further insight from the FS and GT analyses of haplotypes is the clear delineation between possible donor groups within the Philippine palette of populations. This excludes the Aeta, Batak, and Kankanaey clusters from any significant contribution to the population ancestral to the Leeward Society Isles (Figs 3, S7, Supplementary Table S8). The Philippine populations from the regions of Luzon, Palawan, and Visayas form a ‘Philippines 1’ cluster, which contributes nearly 40% of the genome of the Leeward Society Islanders. The apparent discrepancy with the analysis of unlinked SNPs (Supplementary Figs S3 and S4), which indicates the Kankanaey as being closest to the Leeward Society Isles, may be caused by the two methods measuring different aspects of the underlying genetic structure. In addition, ascertainment bias inherent to genotyping arrays data can affect the allele-sharing statistics. The GT analysis, in contrast, is based on combinations of linked markers, and is consequently more powerful and robust for identification of complex admixture events38.
Uniparental haploid loci: mtDNA
Ninety-six percent of Leeward Society Isles mitochondrial lineages belong to the haplogroup (hg) B4a1a1 typical of Polynesian speaking populations. A PCA plot based on frequencies of mtDNA B4a1a lineages (Supplementary Fig. S8) places the Leeward Society Islands closest to Ontong Java (central northern Polynesian outlier, Fig. 1a) with the major western Polynesian populations of Tonga and Samoa among the most distant from eastern Polynesians. The Bayesian estimate of the time to the most recent common ancestor (MRCA) for well-supported clades of mitochondrial hg B4a1a1 (Supplementary Table S10A) is consistent with more than a third being significantly older than the first settlement of southern Melanesia and western Polynesia. The diversity-based age for B4a1a1 among Polynesian-speaking groups at ~5,700 BP (4,100–7,700 BP) is substantially older than the age of the LCC in northern Melanesia.
Uniparental haploid loci: Y chromosome
The major Y chromosome haplogroup in the Leeward Society Isles is C2a1-P33 (67%), a sub-clade of C2a-M208, as it is throughout eastern Polynesia16, including the New Zealand Maori (52%), and the central northern outlier of Ontong Java (Supplementary Table S9B). Many of the haplotypes from eastern Polynesia (Leeward Society Isles, Tahiti, New Zealand Maori), and Ontong Java, are found near to the root of the hg C2a-M208 phylogenetic network (Supplementary Fig. S9). The PCA of this haplogroup and its sub-clades, including C2a1-P33, places the Leeward Society Islanders in closest overall proximity to individuals from the central northern Polynesian outlier of Ontong Java rather than those from Tonga and Samoa (Supplementary Fig. S10). The MRCA of the four target-sequenced Society Isles Y chromosomes provides an age of ~2,100 BP for the hg C2a1-P33 (Supplementary Fig. S11, Supplementary Table S10B).
Another Y chromosome hg, O3a’i-P164, represents a possible ISEA contribution to male lineages among Polynesians and occurs in western Polynesia at significant levels (35%). In the Leeward Society Islands O3a’i-P164 has a frequency of 11% (Supplementary Table S9B). Seven of the eight individuals belong to the O3i-B451 clade, which so far has only been identified among Austronesian speakers in ISEA39,40. All of these seven also typed positive for the downstream B450 marker and share an MRCA at ~5,700 BP with a Sama-Bajaw individual from Sulawesi (Supplementary Fig. S11, Supplementary Table S3). They also carry a rare triplication event at DYS385, which is present among individuals, not genotyped beyond the ancestral positions of O3′7-M122 and O3′6-M324, from New Zealand (Supplementary Table S3), western Polynesia, Tikopia (southern Polynesian outlier) and Fiji (southern Melanesia)17,41. These individuals, therefore, likely belong to hg O3i.

The Y chromosome diversity of the Leeward Society Isles is completed by hg O1-M119 and hg O6a-JST002611, which are prevalent in Taiwanese aborigines and East Asia42, respectively, and hg S2a-P79 (formerly K3-P79) (see Supplementary Fig. S11 and its legend online, Supplementary Table S9B). The latter occurs on average at a frequency 6% in eastern Polynesia, western Polynesia, and Ontong Java (central northern Outlier). The available high-resolution STR data place the S2a-P79 haplotypes of the Leeward Society Isles in close proximity to those from New Zealand Maori and Ontong Java (Supplementary Fig. S12).
Figure 3
Population admixture events and inferred contact dates. Admixture events between genetic clusters obtained using fineSTRUCTURE37 (FS, Supplementary Fig. S6) and estimated with GLOBETROTTER38 (GT, Supplementary Table S8) for the Leeward Society Isles group. Each color represents a separate genetic cluster estimated with FS that acts as a donor to the recipient cluster (Leeward Society Isles) in the GT analysis. These donor groups are: Europe, East Asia, Malaysia, northern Melanesia (Bougainville), Philippines (‘Philippine 1’ cluster in FS), New Guinea and Sulawesi. ‘Other’ represents an amalgamation of groups contributing less than 3% ancestry to the admixture episodes in the genomes of Leeward Society Islanders. There is strong statistical support for two episodes of admixture; the ancient and recent events are represented by the left- and right-hand bar plots, respectively. Each episode involves two pairs of sources (minor and major); bar plots depict the inferred composition of the mixing sources for each, with admixture dates calculated using a generation time of 28 years. The dates for the older episode are given in the format of Common Era (CE) and Before Present (BP) for convenience. Detailed information about the inferred admixture episodes and composition of mixing sources is given in Supplementary Table S8.
In order to investigate the presence of the northern Melanesian contributions further, we performed a GT analysis on different subsets of Leeward Society Islanders as recipient groups (Supplementary Fig. S7, Supplementary Table S8). The results produced a spread of dates for the older episode of admixture, but always partitioned the northern Melanesian contribution into both sides of the admixture episode with point estimates ranging between ca 1,200 and 1,850 BP. Some of the variability in the dating may be due to the heterogeneous distribution of what appears to be recent admixture with people of East Asian ancestry (Figs 2B, S7, Supplementary Table S8), but the result is robust to variations in the makeup of the recipient group. This result, therefore, provides important evidence for either a period of migration from northern Melanesia into the ancestors of eastern Polynesians during the 3rd millennium BP, or a process of biological admixture taking place during the LCC period in northern Melanesia prior to the pioneering settlement of Polynesia ~3,000 BP.
A further insight from the FS and GT analyses of haplotypes is the clear delineation between possible donor groups within the Philippine palette of populations. This excludes the Aeta, Batak, and Kankanaey clusters from any significant contribution to the population ancestral to the Leeward Society Isles (Figs 3, S7, Supplementary Table S8). The Philippine populations from the regions of Luzon, Palawan, and Visayas form a ‘Philippines 1’ cluster, which contributes nearly 40% of the genome of the Leeward Society Islanders. The apparent discrepancy with the analysis of unlinked SNPs (Supplementary Figs S3 and S4), which indicates the Kankanaey as being closest to the Leeward Society Isles, may be caused by the two methods measuring different aspects of the underlying genetic structure. In addition, ascertainment bias inherent to genotyping arrays data can affect the allele-sharing statistics. The GT analysis, in contrast, is based on combinations of linked markers, and is consequently more powerful and robust for identification of complex admixture events38.
Uniparental haploid loci: mtDNA
Ninety-six percent of Leeward Society Isles mitochondrial lineages belong to the haplogroup (hg) B4a1a1 typical of Polynesian speaking populations. A PCA plot based on frequencies of mtDNA B4a1a lineages (Supplementary Fig. S8) places the Leeward Society Islands closest to Ontong Java (central northern Polynesian outlier, Fig. 1a) with the major western Polynesian populations of Tonga and Samoa among the most distant from eastern Polynesians. The Bayesian estimate of the time to the most recent common ancestor (MRCA) for well-supported clades of mitochondrial hg B4a1a1 (Supplementary Table S10A) is consistent with more than a third being significantly older than the first settlement of southern Melanesia and western Polynesia. The diversity-based age for B4a1a1 among Polynesian-speaking groups at ~5,700 BP (4,100–7,700 BP) is substantially older than the age of the LCC in northern Melanesia.
Uniparental haploid loci: Y chromosome
The major Y chromosome haplogroup in the Leeward Society Isles is C2a1-P33 (67%), a sub-clade of C2a-M208, as it is throughout eastern Polynesia16, including the New Zealand Maori (52%), and the central northern outlier of Ontong Java (Supplementary Table S9B). Many of the haplotypes from eastern Polynesia (Leeward Society Isles, Tahiti, New Zealand Maori), and Ontong Java, are found near to the root of the hg C2a-M208 phylogenetic network (Supplementary Fig. S9). The PCA of this haplogroup and its sub-clades, including C2a1-P33, places the Leeward Society Islanders in closest overall proximity to individuals from the central northern Polynesian outlier of Ontong Java rather than those from Tonga and Samoa (Supplementary Fig. S10). The MRCA of the four target-sequenced Society Isles Y chromosomes provides an age of ~2,100 BP for the hg C2a1-P33 (Supplementary Fig. S11, Supplementary Table S10B).
Another Y chromosome hg, O3a’i-P164, represents a possible ISEA contribution to male lineages among Polynesians and occurs in western Polynesia at significant levels (35%). In the Leeward Society Islands O3a’i-P164 has a frequency of 11% (Supplementary Table S9B). Seven of the eight individuals belong to the O3i-B451 clade, which so far has only been identified among Austronesian speakers in ISEA39,40. All of these seven also typed positive for the downstream B450 marker and share an MRCA at ~5,700 BP with a Sama-Bajaw individual from Sulawesi (Supplementary Fig. S11, Supplementary Table S3). They also carry a rare triplication event at DYS385, which is present among individuals, not genotyped beyond the ancestral positions of O3′7-M122 and O3′6-M324, from New Zealand (Supplementary Table S3), western Polynesia, Tikopia (southern Polynesian outlier) and Fiji (southern Melanesia)17,41. These individuals, therefore, likely belong to hg O3i.
The Y chromosome diversity of the Leeward Society Isles is completed by hg O1-M119 and hg O6a-JST002611, which are prevalent in Taiwanese aborigines and East Asia42, respectively, and hg S2a-P79 (formerly K3-P79) (see Supplementary Fig. S11 and its legend online, Supplementary Table S9B). The latter occurs on average at a frequency 6% in eastern Polynesia, western Polynesia, and Ontong Java (central northern Outlier). The available high-resolution STR data place the S2a-P79 haplotypes of the Leeward Society Isles in close proximity to those from New Zealand Maori and Ontong Java (Supplementary Fig. S12).