|
|
Post by Admin on Mar 26, 2020 21:46:49 GMT
Asian and Australasian Populations Consistent with previous results obtained with a simpler admixture graph in Mallick et al. (2016), New Guinea and Australia fit well as sister groups, with their majority ancestry component forming a clade with East Asians (with respect to western Eurasians). Onge fit as a near-trifurcation with the Australasian and East Asian lineages, while Mamanwa are inferred to have three ancestry components: One branching deeply (but unambiguously) from the Australasian lineage (prior to the split between New Guinea and Australia); one East Asian-related (interpreted as Austronesian admixture); and one from Denisova. The Denisova-related introgression in Mamanwa is shared with New Guinea and Australia and then diluted ∼3× by the Austronesian admixture (here 68.5%, when compared with 73% in Reich et al. (2011) and 50–60% in a simpler model in Lipson et al. (2014)). In a previous study (Reich et al. 2011), Australia and New Guinea were modeled as having about half of their ancestry from each of two components: One forming a trifurcation with Onge and East Asians, and the other splitting more recently from the Onge lineage. Here, we obtain a satisfactory fit without this admixture, and while we cannot rule it out entirely, we do not have strong evidence for rejecting our simpler model. We also note that the previous model, by virtue of its different topology, included relatively more Denisova-related ancestry in Mamanwa (∼50% as much as in Australia), although both versions appear to fit the data satisfactorily. We also performed two additional analyses involving minimal modeling assumptions to test for possible southern route ancestry in Australasians. First, we used a method that leverages a large set of f4-statistics from different outgroup populations in elucidating admixture in a population of interest (Haak et al. 2015). Given a population Test, we plot f4-statistics f4(Test, Ref1; Oi, Oj) against f4(Test, Ref2; Oi, Oj) for references Ref1 and Ref2 and all pairs of outgroups from a set O1, O2,…, Ok. If Test is well modeled as a two-way admixture of populations related to Ref1 and Ref2 in proportions α and 1 − α, then f4(Test, Ref1; Oi, Oj) = (1 − α)f4(Ref2, Ref1; Oi, Oj), and f4(Test, Ref2; Oi, Oj) = αf4(Ref1, Ref2; Oi, Oj) = −αf4(Ref2, Ref1; Oi, Oj). Thus, the points should show a negative correlation, where the slope is informative about the mixture proportions (Haak et al. 2015). We tested New Guinea as a two-way mixture between an East Asian-related population (Ref1 = Ami) and Denisova (Ref2), using outgroups Chimp, Altai, Dinka, Ust’-Ishim, and K14. The negative correlation is very strong (fig. 3), with no points in the plot indicating a significant violation of a New Guinea/East Asian clade. We note that if a deep-lineage component were present in New Guinea, we would expect to detect it via this set of outgroups, as it would push the points defined by (Oi, Oj) for Oi = Dinka and Oj = Ust’-Ishim or K14 off the line.  Fig. 3 We then applied qpWave (Reich et al. 2012) to a larger set of test populations simultaneously to test formally for evidence of multiple waves of admixture. Using the same outgroups plus Denisova (right pop list: Chimp, Altai, Denisova, Dinka, Ust’-Ishim, K14), we computed how many ancestry components are necessary to relate the following set of (left) test populations: Ami, Dai, Kinh, Han, Bougainville, New Guinea Highlanders, HGDP Papuan, Australian, Onge, and Mamanwa. We find that this set is consistent with just two ancestral components (rank 1 tail P = 0.27), where the loadings appear to be driven primarily by the gradient of Denisova-related ancestry, as expected. As above, this test can only distinguish components that differ relative to the outgroups, but we would expect to see a signal of any substantial ancestry from a source diverging prior to the eastern/western Eurasian split. Western and Northern Eurasians We used the K14 and MA1 individuals to capture the roots of two major western Eurasian lineages (a western clade and a northern/eastern clade, respectively; Raghavan et al. 2014; Seguin-Orlando et al. 2014; Haak et al. 2015). Recent focused studies of later European prehistory have developed detailed models involving numerous admixture events (Lazaridis et al. 2014; Seguin-Orlando et al. 2014; Haak et al. 2015; Fu et al. 2016); as a result of this complexity, we deemed it beyond the scope of the present work to include present-day western Eurasians (although we address Europeans below). In our model, K14 fits well as unadmixed (aside from archaic introgression), but MA1 receives, in addition to its archaic admixture, a component of eastern Eurasian ancestry. The latter gene flow explains the preliminary residual f4(MA1, K14; Ami, Ust’-Ishim), which is of a similar form to several other relatively poorly fitting statistics from our initial graph, for example f4(MA1, K14; Ami, New Guinea) = 2.00 (fitted 0.08; Z = 2.68) and f4(MA1, Ust’-Ishim; Ami, New Guinea) = 1.73 (fitted 0.08; Z = 2.49). We added this admixture into our model with its best-fitting source position (near the root of the East Asian lineage) and mixture proportion (17.4% East Asian-related ancestry, 95% CI 7.7–27.4%). The graph score improved by 7.0 (P < 0.001), indicating a significant improvement in the fit. We also attempted to fit the full graph with west-to-east gene flow instead, and the overall score was significantly worse (log-likelihood difference of 4.6 with the same number of free parameters). Similar statistics (D(MA1, K14; Han, Mbuti) with Z = 5.4 and D(Loschbour, K14; Han, Mbuti) with Z = 5.3) were reported in the initial genetic analysis of K14 (Seguin-Orlando et al. 2014) and were interpreted there as evidence that K14 harbored Basal Eurasian ancestry. However, it has been shown in an analysis of a larger set of pre-Neolithic Europeans (Fu et al. 2016) that these signals in fact appear to reflect shared drift between a subset of western Eurasian hunter-gatherers (including MA1 and Mesolithic Europeans such as Loschbour) and East Asians. This is particularly evident from our primary statistic f4(MA1, K14; Ami, Ust’-Ishim): Even if K14 did have a component of deeply diverging ancestry, it would not share extra drift with Ust’-Ishim (likewise, this statistic is essentially unaffected by excess archaic ancestry in K14). To support our inference of the directionality of gene flow between eastern Eurasians and MA1 (which was not addressed in Fu et al. 2016), we compared the two statistics: (1) f4(MA1, K14; Ami, Ust’-Ishim) = 1.89 (Z = 2.76) and (2) f4(Ust’-Ishim, MA1; Onge, Ami) = 0.23 (Z = 0.52) (computed on all available Human Origins SNPs). In figure 4, we show alternative models in which the flow is east to west, with MA1 admixed (A), or west to east, with Ami admixed (B). The statistics (1) and (2) have expected values equal to a branch length (red for (1) and black for (2)) times the mixture proportion α. As can be seen, the models are distinguishable by which statistic has the greater magnitude (as observed independently in more generality by Pease and Hahn (2015)). In truth, the admixture may have been complex and bidirectional, but the fact that the observed value of (1) is significantly larger in magnitude than (2) (Z = 2.29 for the difference via block jackknife) argues for east-to-west (fig. 4A) as the primary direction, with MA1 admixed. The same pattern is observed with other outgroups in place of Ust’-Ishim (Z = 3.42, 2.74, 1.84, 2.90 for the analogous difference using Dinka, Altai, Denisova, and Chimp, respectively). We also repeated the computation with other western Eurasian populations in place of MA1 and found the same signal of eastern Eurasian relatedness, including the same preferred directionality, in WHG (defined as in table 2; Z = 2.04 for the difference), Caucasus hunter-gatherers (CHG; Jones et al. 2015; Z = 1.77), and Afontova Gora 3 (AG3, a ∼17 kya individual from Siberia closely related to MA1; Fu et al. 2016; Z = 2.17). We note that a recent study (Lazaridis et al. 2016) found a cline of MA1-relatedness among a large number of present-day eastern Eurasian populations and argued for admixture from west to east instead; while the present analysis supports the other direction, an important subject for future work will be to reconcile these results.  Fig. 4 While we did not carefully model present-day Europeans in our main admixture graph, we did build an extended graph with French added (25 individuals). A good fit was obtained with four ancestry components, related to western (K14), northern (near the base of the MA1 lineage), and eastern (specified as the same source as for MA1) Eurasians, plus Basal Eurasian (specified without Neanderthal introgression; Lazaridis et al. 2016). The inferred proportions were 27.7%, 34.9%, 23.2%, and 14.2%, respectively, with essentially no change in the list of residuals. We note that these sources do not represent the proximal ancestral populations of present-day Europeans (Lazaridis et al. 2014; Haak et al. 2015), and this fit also may not be the optimal one, but it does provide a sense of the relationships of Europeans to the major lineages defined in our model. Lastly, we also briefly studied two other ancient European lineages. First, we built a version of our model with WHG in place of MA1 and found that it fit in a similar fashion (majority component of WHG’s ancestry as a sister group to K14, plus eastern Eurasian gene flow). Second, we fit an expanded graph with MA1, K14, and the early modern human Oase 1 (Fu et al. 2015). Because of possible contamination, we used the published damage-restricted data, which reduced the set of SNPs with coverage in all populations to ∼28k. The inferred graph was similar overall, with modest changes due to the smaller set of SNPs. Oase 1 was inferred to diverge from the western Eurasian (K14) lineage, slightly later than Ust’-Ishim (shared drift 1.6), but still close to the split of the eastern and western clades. As shown in Fu et al. (2015), Oase 1 has a significant excess of Neanderthal ancestry, which we inferred at 8.3% in the extended model. |
|
|
|
Post by Admin on Mar 27, 2020 6:22:58 GMT
Native Americans We included Suruí, from Brazil, a Native American population without recent European admixture. As previously demonstrated for Native Americans generally (Raghavan et al. 2014), we found that they fit well in the model as a mixture of components related to East Asians (73%) and MA1 (27%). This proportion of western Eurasian ancestry is lower than previously inferred (∼40% in Raghavan et al. 2014), which may be because we are separately modeling East Asian-related gene flow into MA1. It has also been shown that Suruí harbor a few percent ancestry from a “Population Y” related to Onge and Australasians (Skoglund et al. 2015). In the context of our model, with only one Native American population present, this admixture should only have a minor effect, although we do see hints of such a signal, as mentioned above. Early Out-of-Africa Split Points After the divergence of Dinka from non-Africans, the next split point on the modern human lineage in our model is that between the major eastern and western clades (the node labeled “Non-African”—although we note that the split point of Basal Eurasian would be deeper.) This split is soon followed on the western Eurasian branch by the split between K14 and Ust’-Ishim (i.e., their respective modern-human ancestry components). The original Ust’-Ishim analysis (Fu et al. 2014) inferred a near-trifurcation at this point, and we wished to test whether K14 (and other western Eurasians) and Ust’-Ishim form a statistically supported clade. In fact, while the best-fitting position for Ust’-Ishim is on the western lineage (0.6 shared drift), the inferred 95% confidence interval for this point overlaps the eastern/western split (standard error 0.4 for the Ust’-Ishim split position), so that we cannot confidently resolve the branching order. We therefore continue to regard this cluster as approximately a trifurcation; while we show Ust’-Ishim at its best-fitting split point in figure 1, we color-code it as a basal non-African rather than a member of the western clade. We also investigated another near-trifurcation, near the top of the eastern Eurasian clade, where the East Asian, Onge, and Australasian lineages are inferred to diverge in a short span. Here, the best-fitting arrangement features Onge and East Asians as a weak clade (p ∼ 0.02), but the model reaches a second, only slightly inferior local optimum with Onge and Australasians as sister groups instead, possibly suggesting admixture between two of the three lineages. An admixture event in either Onge (between the Australasian and East Asian lineages) or Australasians (between the Onge and deep eastern Eurasian lineages) is likewise weakly significant (p ∼ 0.02), but with no discriminatory power between these two scenarios. Ultimately, we chose to present the model with a trifurcation at this point because we felt it best conveyed our uncertainty: No pair of lineages clearly shares more drift, and it is likely that some admixture took place, but we cannot accurately determine which lineage or lineages were involved or constrain the exact proportions or sources. Power to Detect Admixture Events The set of admixture events we have included is limited by our power to detect statistically significant deviations from the proposed model. Suppose that we specify a quartet of populations as unadmixed with the topology ((A, B),(C, D)). If population A is in fact admixed with a component of ancestry related to C (in an unrooted sense), then we will observe a residual statistic f4(A, B; C, D) with expected value γL, where γ is the C-related mixture proportion and L is the branch length in the graph that is shared uniquely between this component and population C (Reich et al. 2009; Patterson et al. 2012). For our data set, in 1000 times drift units, standard errors on observed f4-statistics are on the order of 0.5. Thus, in order to observe a residual at Z = 2 (for example), an admixture event would have to satisfy (approximately) γL > 1. We note that while γ is a fixed parameter, L depends on how close a reference C is available (and one must also have access to populations B and D with the proper topology). We were particularly interested in the question of power to detect possible southern route ancestry in Australasians. In this case, population A would be Australasians, population B would be an East or Southeast Asian group without a southern route component, population C would be an outgroup (African, archaic, or Chimp), and population D would be a western Eurasian. The length L would measure the distance from the “Non-African” node up to the split point of the southern route source. A more thorough empirical analysis of this question in Mallick et al. (2016) concluded that any southern route component in Australasians is unlikely to comprise more than several percent. If, for example, the deeper ancestry were from a population that split halfway between the “Non-African” node and the African/non-African ancestor (L ≈ 17), then via the inequality above, we would have power to find roughly 6% admixture or more, similar to the previous results. For a split closer to the “Non-African” node, our power would be reduced, while for a deeper split (e.g., the ∼120 kya proposed by Pagani et al. (2016)), it would be enhanced. We also carried out two tests using our admixture graph to examine our power empirically in cases of well-known admixture. First, we studied the ∼27% MA1-related ancestry in Suruí. In order to make our available constraints similar to the hypothetical southern route case, we removed MA1, K14, and Ust’-Ishim from the model. With this reduced graph, if we model Suruí as unadmixed, we observe six residuals with Z > 3 (max 3.6), all of the form f4(Suruí, Asian; outgroup, Australasian). Thus, even without any western Eurasian references, we can easily locate the admixture signal (the relevant length L is the branch between the “East1” and “Non-African” nodes, or approximately 6 units). Second, we conducted a similar analysis for the Denisova-related ancestry in Australasians, having removed Onge, Chimp, Altai, and Denisova from the model. In this case, we observe a residual f4(Australian, Suruí; Dinka, K14) at Z = 2.01, roughly as expected given the known parameters of a few percent introgression and L ≈ 34 (the full distance between the “Non-African” node and the African/non-African ancestor). This demonstrates our ability to detect a very small proportion of deep ancestry in Australasians without a close surrogate available, as would also be true for southern route admixture. While in this example the residual was only weakly significant, it was obtained after relaxing a number of key constraints from the full model, and even 1–2% more deep ancestry would have made for an unambiguous signal. Replication with SGDP Data To gain further perspective, we repeated our admixture graph analysis with full sequence data from the SGDP (Mallick et al. 2016). The set of populations we used was similar (although generally with smaller sample sizes; see Materials and Methods), with only two changes: We substituted HGDP Papuans instead of New Guinea Highlanders (which should not be substantively different) and no longer had access to data for Mamanwa. We ascertained SNPs as polymorphic among the four SGDP Mbuti individuals and merged with Chimp, Altai, Denisova, Ust’-Ishim, K14, and MA1. The resulting data set contained 1.99M SNPs overlapping all populations. The best-fitting graph is shown in figure 5. Overall, it is very similar to our primary model, with only one change in topology (the eastern Eurasian admixture source for MA1 now splits closer to Ami) and small differences in inferred mixture proportions (table 1). The SGDP model does have two residual statistics falling more than 3 standard errors from their fitted values: f4(Ust’-Ishim, Ami; Australia, Dinka) = −4.34 (fitted value −6.69; Z = 3.52) and f4(Ust’-Ishim, Papuan; Australia, Dinka) = −24.64 (fitted value −26.83; Z = 3.02). A number of other residuals are also present with Z > 2 showing the same apparent signal of shared drift between Ust’-Ishim and Australasians (for example, with Altai or Denisova in place of Dinka); these statistics are not independent, but the overlap argues that it is indeed this pair of populations that drives the two most significant residuals.  Fig. 5 Model fit with SGDP data. Notation is the same as in figure 1. While this signal is intriguing, we ultimately decided not to add a new admixture event to the model to account for it. We considered the possibility either of gene flow from a population related to Ust’-Ishim into the ancestors of Australasians or vice versa. Both would create a pattern of shared drift as reflected in the residuals, but the two directions would make distinct predictions in relation to other populations. In the first scenario, we would expect the genetic affinity to Ust’-Ishim to be unique to Australasians, and this affinity should be detectable in our previous analyses. However, neither the f4 correlation nor qpWave methods showed evidence of Ust’-Ishim-related admixture in Australasians, and the signal of shared drift between Australasians and Ust’-Ishim was only marginally significant in our main graph model; while based on fewer SNPs, the corresponding statistics in fact had lower standard errors than those from the SGDP model, so the difference was not due to a lack of power. In the second scenario, with Ust’-Ishim admixed, we would expect a slightly different signature, since Ust’-Ishim would then possess a component of ancestry that, in addition to being related to Australasians, also shares excess drift with other eastern Eurasians. We do in fact observe two such (weaker) residual statistics: f4(Ust’-Ishim, K14; Onge, Dinka) = 1.37 (fitted value −0.21; Z = 2.24) and f4(Ust’-Ishim, K14; Ami, Dinka) = 1.30 (fitted value −0.21; Z = 2.07). However, when we replicated these statistics with our main data set, using all available SNPs, they were only weakly positive (f4(Ust’-Ishim, K14; X, Dinka) = 0.31, 0.62, 0.72, 1.10 for X = Onge, Ami, New Guinea, and Australia, respectively; Z = 0.59, 1.18, 1.23, 1.18). We also compared the quality of fit of full graph models (using the SGDP data) in which we added an extra admixture event between Ust’-Ishim and Australasians in either direction, with the hypothesis that if one of these models is correct, it should score better than the other. In both cases, the score improved by more than 11, but the two models had similar residual lists, and their log-likelihood scores only differed by ∼0.3. This would seem to indicate either that 1) the shared drift signal does not reflect a true admixture, 2) there was very evenly bidirectional gene flow, or 3) our model is not sufficiently powered to detect the true mixture source. Moreover, both graphs still had numerous other residuals involving Ust’-Ishim with Z-scores above 2 (up to Z = 2.48 with Australasians admixed and Z = 2.89 with Ust’-Ishim admixed). For the sake of comparison, using our main graph model, we applied a similar analysis to the inferred admixture event from eastern Eurasians into MA1. In that case, while the signal was relatively weak, and there could be reason to believe that the gene flow was not strictly east-to-west, we were able to show that the admixture had a preferred directionality; as noted above, a model with gene flow in the reverse direction scored 4.6 worse. (For an example of a strongly constrained admixture event, if we fit a model with gene flow from Mamanwa to Ami rather than in reverse, the score is more than 400 worse.) To draw a more precise analogy, we repeated the model-fitting without K14 in the graph, so that MA1 was the only western Eurasian population present (in the same way that Ust’-Ishim is the only representative of its lineage). Not surprisingly, this caused the signal of directionality to be attenuated, but it was still present: A model with east-to-west gene flow scored 1.2 better than the reverse. Finally, we fit a version of our model on SGDP data but restricted to transversion polymorphisms (a total of ∼622k SNPs) to test whether there could be any effects of ancient DNA damage patterns either on these residual signals or in the model-fitting as a whole. The graph fit well overall, with the same optimized topology as in our main results (restoring the one difference present in the full-SGDP graph) and similar mixture proportions (table 1). The list of significant residuals was slightly shorter than with all SNPs, but the Ust’-Ishim-related signal was still present (although now stronger with Papuan than with Australia), with the most significant residual, f4(Ust’-Ishim, Ami; Papuan, Dinka), now at Z = 2.98. This leads us to conclude that neither this signal nor other results obtained in the full models are driven by ancient DNA damage. However, in light of our other analyses, we do not feel that we have sufficient evidence at this time to assign the Ust’-Ishim-related signal as a true admixture. |
|
|
|
Post by Admin on Mar 27, 2020 6:59:47 GMT
Discussion
Our proposed admixture graph provides both an integrated summary of many population relationships among diverse non-African modern human groups and a framework for testing additional hypothesis. As an example of the model’s utility, it can help to evaluate a signal previously used to argue for deeply diverged ancestry in Aboriginal Australians (Rasmussen et al. 2011): f4(Australia, Han; Yoruba, French) = 2.02 (Z = 8.23), or with related populations in our admixture graph, f4(Australia, Ami; Dinka, MA1) = 1.43 (Z = 3.01). While southern route ancestry would indeed cause these statistics to be positive, the admixture events specified in our model provide two (partial) alternative explanations, namely Denisova-related introgression into Australasians and gene flow between eastern and western Eurasians. In fact, the predicted value of f4(Australia, Ami; Dinka, MA1) in our final graph is 1.72, slightly larger than the observed value, without any southern route ancestry in Australasians. Thus, this example illustrates how fitting a large number of groups simultaneously can add context to the interpretation of observed patterns in population genetic data.
In addition to providing a synthesis of previous results, we have also proposed two new admixture events in MA1, both of which seem plausible on geographical grounds but are not overwhelmingly statistically significant and would be interesting topics for further study. One event, consisting of gene flow from an eastern Eurasian population, appears to be present as well in other later western Eurasians, which makes it unlikely that the signal could be due to contamination in MA1. We note though that this event could have involved one or more (unknown) intermediate populations rather than being direct, and we also cannot rule out a small amount of admixture in the reverse direction. The second, consisting of Denisova-related gene flow, provides intriguing evidence of a novel instance of archaic introgression, but it should be subject to additional scrutiny with more sensitive methods to confirm whether the source has been accurately inferred (as opposed to excess introgression from Neanderthal or a different archaic group).
Furthermore, we show that we can obtain a good fit to the data with no further admixture events beyond those specified in our model. In other words, even though our graph is in some ways relatively simple, with only three admixtures among the 10 modern human populations, we do not find any large residuals (to the extent that we have statistical power). This does not mean that we have identified all admixture events in the ancestry of these populations or that our graph represents the exact historical truth; rather, we propose that our model be viewed as a reasonable and relatively comprehensive starting point given currently available data, in the spirit of previous demographic null models (Schaffner et al. 2005; Gravel et al. 2011). We also have not included certain groups with known complicated histories, including present-day European and Indian populations. We attempted to add Indians to the graph but failed to obtain a satisfactory fit, which we believe was primarily due to difficulty in modeling the western Eurasian (ANI) ancestry found in all Indian groups today (in addition to eastern, “ASI” ancestry) (Reich et al. 2009).
Overall, our model supports a rapid radiation of Eurasian populations following an out-of-Africa dispersal, in line with results from uniparental markers (Karmin et al. 2015; Posth et al. 2016). Here, this pattern is reflected in the near-trifurcations among the main eastern and western Eurasian clades plus Ust’-Ishim (with Oase 1 splitting very close as well) and at the base of the eastern clade among Andamanese, Australasians, and East Asians. We note that archaeological evidence increasingly points to early eastward modern human dispersals, with suggestive remains from East and Southeast Asia (Mijares et al. 2010; Demeter et al. 2015; Liu et al. 2015) in addition to the relatively early sites confidently assigned to modern humans in Australasia (O’Connell and Allen 2015; Clarkson et al. 2015). If these finds do all represent true modern human occupation, this would change our understanding of the timing of out-of-Africa migrations, but it would not necessarily be the case that present-day Asians and Australasians are related to these first inhabitants. It is also possible that Australasians possess a few percent ancestry from an early-dispersal population which could be detectable with more sensitive genetic analyses but not with our allele-frequency-based methods (Mallick et al. 2016; Pagani et al. 2016). Finally, we caution that we are limited in our ability to infer the geographical locations and calendar dates of events in the admixture graph; our most powerful temporal constraint comes from Ust’-Ishim, whose date of ∼45 kya places the eastern/western Eurasian split no later than this time. Further analysis of ancient DNA in the context of present-day genetic variation promises to provide additional data points to refine and add detail to our understanding.
|
|
|
|
Post by Admin on May 8, 2020 1:01:25 GMT
Published: 11 February 2016 Genomic study of the Ket: a Paleo-Eskimo-related ethnic group with significant ancient North Eurasian ancestry Abstract The Kets, an ethnic group in the Yenisei River basin, Russia, are considered the last nomadic hunter-gatherers of Siberia and Ket language has no transparent affiliation with any language family. We investigated connections between the Kets and Siberian and North American populations, with emphasis on the Mal’ta and Paleo-Eskimo ancient genomes, using original data from 46 unrelated samples of Kets and 42 samples of their neighboring ethnic groups (Uralic-speaking Nganasans, Enets and Selkups). We genotyped over 130,000 autosomal SNPs, identified mitochondrial and Y-chromosomal haplogroups and performed high-coverage genome sequencing of two Ket individuals. We established that Nganasans, Kets, Selkups and Yukaghirs form a cluster of populations most closely related to Paleo-Eskimos in Siberia (not considering indigenous populations of Chukotka and Kamchatka). Kets are closely related to modern Selkups and to some Bronze and Iron Age populations of the Altai region, with all these groups sharing a high degree of Mal’ta ancestry. Implications of these findings for the linguistic hypothesis uniting Ket and Na-Dene languages into a language macrofamily are discussed. Introduction The Kets (an ethnic group in the Yenisei River basin, Russia) are among the least studied native Siberians. Ket language lacks apparent affiliation with any major language family and is clearly distinct from surrounding Uralic, Turkic and Tungusic languages1. Moreover, until their forced settlement in 1930s, Kets were considered the last nomadic hunter-gatherers of North Asia outside the Pacific Rim2. Ket language, albeit almost extinct, is the only language of the Yeniseian family that survived into the 21st century. Most Yeniseian-speaking tribes (Arin, Assan, Baikot, Kott, Pumpokol, Yarin, Yastin) used to live south of the current Ket settlements. According to toponymic evidence, prior to the 17th century speakers of this language family occupied vast territories of Western and Central Siberia, from northern Mongolia in the south to the middle Yenisei River in the north and from the Irtysh River in the west to the Angara River in the east3,4. The Altai region was suggested as a homeland of the Yeniseian language family2 and ancestors of the Yeniseian people were tentatively associated5 with the Karasuk culture (3200-2700 YBP) of the upper Yenisei6. Yeniseian linguistic substrate is evident in many contemporary Turkic languages of this region (South Siberia): Altaian, Khakas, Shor, Tubalar, Tuvinian and in Mongolic Buryat language2. As these languages are spoken in river basins with Yeniseian river names1, the Yeniseian tribes were likely to have mixed with these ethnic groups (and with the Southern Samoyedic groups Kamasins and Mators, now extinct1) at different times. We expect to find genetic signatures of these events. Over the centuries, Kets and other Yeniseian people suffered relocation, extinction and loss of language and culture. First, they were under a constant pressure from the reindeer herders to the north (Enets and Nenets) and east (Evenks) and the Turkic-speaking pastoralists to the south. Second, Russian conquest of Siberia, which started at the end of the 16th century, exposed the natives to new diseases, such as the 17th century smallpox epidemic7. Third, in the 20th century USSR resettled the Kets in Russian-style villages, thus interrupting their nomadic lifestyle2. Under the pressure of disease and conflict, the Kets have been gradually migrating north along the Yenisei River and now reside in several villages in the Turukhansk district (Krasnoyarsk region); around 1,200 people in total8. Until the 20th century, Kets, being nomadic hunters and fishers in a vast Siberian boreal forest, had little contact with other ethnic groups, which is manifested by the rarity of loanwords in Ket language2. However, since the collapse of the inter-Ket exogamous marriage system following the smallpox epidemics in the 17th and 18th centuries, Kets have been marrying Selkups, Uralic-speaking reindeer herders2,9. Moreover, during the 20th century, the settled Kets have been increasingly mixing with other native Siberian people and with the Russians, which resulted in irrevocable loss of Ket language, genotype and culture. Recently, a tentative link was proposed between the Yeniseian language family and the Na-Dene family of Northwest North America (composed of Tlingit, Eyak and numerous Athabaskan languages), thus forming a Dene-Yeniseian macrofamily10,11,12. The Dene-Yeniseian-linkage is viewed by some as the first relatively reliable trans-Beringian language connection11, with important implications for timing of the alleged Dene-Yeniseian population split, the direction of the subsequent migration (from or to America), the possible language shifts and population admixture13,14,15.  So far, no large-scale population study was conducted with samples from each of the presently occupied Ket villages. Previously, six Ket individuals were genotyped16,17,18 and two of them sequenced19 These studies concluded that the Kets do not differ from surrounding Siberian populations, a rather surprising finding, given their unique language and ancient hunter-gatherer life-style. In order to clarify this issue, in 2013 and 2014 we collected 57 (46 unrelated) samples of Kets and 42 unrelated samples of their neighboring Uralic-speaking ethnic groups (Nganasans inhabiting the Taymyr Peninsula and Enets and Selkups living further south along Yenisei). We genotyped approximately 130,000 autosomal SNPs and determined mitochondrial and Y-chromosomal haplogroups with the GenoChip array20. We also performed high-coverage genome sequencing of two Ket individuals. Using these data, we investigated connections between Kets and modern and ancient Siberian and North American populations (including the Mal’ta and Saqqaq ancient genomes). In addition, we estimated Neanderthal contribution in Kets’ genome and in specific gene groups. Mal’ta is a ~24,000 YBP old Siberian genome, recently described21 as a representative of ancient North Eurasians (ANE)22, a previously unknown northeastern branch of the Eurasian Paleolithic population. ANE contributed roughly 30–40% to the gene pool of Native Americans of the first settlement wave21 and about 50% to the Bronze Age Yamnaya culture in the Pontic-Caspian steppe6,23,24. Massive expansion of the Corded Ware culture around 5,000-4,000 YBP, originating from the Yamnaya source, introduced the ANE genetic pool into Central and Western Europe and thus reshaped its genetic landscape6,23. During the same period, the Afanasievo and Andronovo cultures, genetically similar to the Yamnaya culture, expanded into the Altai region (South Siberia) and later mixed with Siberian populations, giving rise to the Bronze Age Karasuk culture and later Iron Age cultures6. A global maximum of ANE ancestry occurs in Native Americans, with lower levels in peoples of more recent Beringian origin, i.e. indigenous populations of Chukotka, Kamchatka, the Aleutian Islands and the American Arctic21,22,25. In modern Europe, ANE genetic contribution is the highest in the Baltic region, on the East European Plain and in the North Caucasus6,22,23. However, little is known about the distribution of ANE ancestry in its Siberian homeland. According to a single f4 statistic, the Kets had the third highest value of ANE genetic contribution among all Siberian ethnic groups, preceded only by Chukchi and Koryaks26. Thus, we suggest that the Kets might represent the peak of ANE ancestry in Siberia; the hypothesis we tested extensively in this study. We also investigated continuity between the modern Kets and Altaians and the ancient Bronze and Iron Age populations of the Altai region discussed above: the Karasuk culture samples dated to 3531-3261 YBP and Iron Age samples roughly dated to 2900-1100 YBP6. The 4,000 YBP genome from Greenland16 represents the Saqqaq archeological culture (4,500-2,800 YBP). This culture formed a continuum with Dorset and Norton cultures (2,500-1,000 YBP), collectively termed Paleo-Eskimo25. Paleo-Eskimos were culturally and genetically distinct from modern Inuits and Eskimos13,25. The Saqqaq culture is a part of the wider Arctic Small Tool tradition (ASTt) that had rapidly spread across Beringia and the American Arctic coastal regions (but not the interior) after 4,800 YBP, bringing pottery, bow and arrow to the northern North America13,15,27. According to the archaeological data, the likely source of this spread was located in Siberia, namely in the Lena River basin (probably, in the Bel’kachi culture13). On genetic grounds, Paleo-Eskimos were also argued to represent a separate migration into America16,25,28. ASTt spread coincided with the arrival of mitochondrial haplogroup D2 into America and the spread of haplogroup D2a29; the Saqqaq individual bore haplogroup D2a130. The closest modern relatives of Saqqaq occur among Beringian populations (Chukchi, Koryaks, Inuits25) and Siberian Nganasans16. In addition, Saqqaq has been linked to Na-Dene-speaking Chipewyans (16% contribution to this population modeled with admixture graphs28). However, mitochondrial haplogroup data25,30,31 argues against the proximity of Paleo-Eskimos to contemporary Na-Dene people13,15, primarily due to the very high frequency of haplogroup A in the latter32. Archeological evidence seems to support this argument13.  There is no archaeological evidence of considerable trans-Beringian population movements between the inundation of the Bering Platform around 13,000-11,000 YBP and 4,800 YBP. Therefore, it is unlikely that the hypothetical Dene-Yeniseian language family has separated prior to 11,000 YBP, according to current concepts of time depth in language evolution13,15 and hence ASTt could be the vehicle spreading Dene-Yeniseian languages and genes from Siberia to Alaska and to the American Arctic13. However, as argued based on language phylogenetic trees33 in the framework of the Beringian standstill model29,34, the Dene-Yeniseian languages have originated in Beringia and spread in both directions. Irrespective of the migration direction and their relationship to contemporary Na-Dene groups, Paleo-Eskimos are the primary target for investigating genetic relationship with the Kets. In this study, we found that: (1) Kets and Selkups constitute a clade closely related to Nganasans; (2) Nganasans, Kets, Selkups and Yukaghirs form a cluster of populations most closely related to Paleo-Eskimos in Siberia (not considering indigenous populations of Chukotka and Kamchatka); (3) unlike Nganasans, Kets derive roughly 30–40% of their ancestry from ancient North Eurasians; (4) Kets show genetic continuity with the hypothetical homeland of Yeniseian languages, as they are closely related to the ancient individuals of the Karasuk culture and to the later Iron Age individuals from the Altai. |
|
|
|
Post by Admin on May 8, 2020 20:13:24 GMT
Results and Discussion Identification of a non-admixed Ket genotype We compared the GenoChip SNP array data for the Ket, Selkup, Nganasan and Enets populations (Suppl. file S1) to the worldwide collection of populations35 based on 130 K ancestry-informative markers20.We applied GPS35 and reAdmix36 algorithms to infer provenance of the samples and confirm self-reported ethnic origin (see details in Suppl. Information, Section 4, Suppl. Figs. 4.2, 4.3, Suppl. Table 3). Combining the two algorithms, we identified a subset of non-admixed Kets among self-identified Ket individuals and nominated two individuals for whole-genome sequencing. ADMIXTURE37 revealed very similar profiles of components in individuals sequenced in this study and in two (Fig. 1A) or four (Suppl. Fig. 5.1) Kets from published sources. We note that proportion of the European component at K = 4 was slightly lower in the published Ket individuals (28% vs. 32% on average). 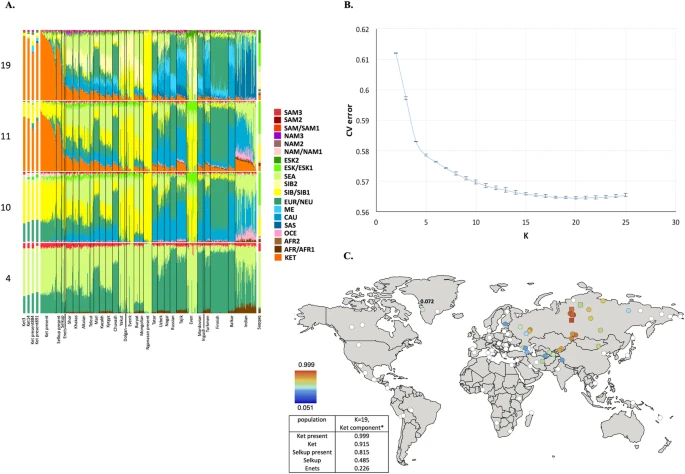 Figure 1 (A) Admixture coefficients plotted for dataset ‘GenoChip + Illumina arrays’. Abbreviated names of admixture components are shown on the left as follows: SAM, South American; NAM, North American; ESK, Eskimo (Beringian); SEA, South-East Asian; SIB, Siberian; NEU, North European; ME, Middle Eastern; CAU, Caucasian; SAS, South Asian; OCE, Oceanian; AFR, African. The Ket-Uralic (‘Ket’) admixture component appears at K ≥ 11 and admixture coefficients are plotted for K = 4, 10, 11 and 19. Although K = 20 demonstrates the lowest average cross-validation error, the Ket-Uralic component splits in two at this K value, therefore K = 19 was chosen for the final analysis. Only populations containing at least one individual with >5% of the Ket-Uralic component at K = 19 are plotted and individuals are sorted according to values of the Ket-Uralic component. Admixture coefficients for the Saqqaq ancient genome are shown separately on the right and for two reference Kets and two Ket individuals from this study - on the left. (B) Average cross-validation (CV) error graph with standard deviations plotted. Ten-fold cross-validation was performed. The graph has a minimum at K = 20. (C) Color-coded values of the Ket-Uralic admixture component at K = 19 plotted on the world map using QGIS v.2.8. Maximum values in each population are taken and only values >5% are plotted. Top five values of the component are shown in the bottom left corner and the value for Saqqaq is shown on the map. ‘Ket-Uralic’ admixture component Using the GenoChip SNP array20, we genotyped 130 K ancestry-informative markers in the Ket, Selkup, Nganasan and Enets populations (Suppl. file S1). Following the exclusion of first-, second- and third-degree relatives among the individuals genotyped in this study (Suppl. file S1, Suppl. Fig. 4.1), we merged the GenoChip array data with the published SNP array datasets to produce a worldwide dataset of 90 populations and 1,624 individuals, focused on Siberia and America (Suppl. Table 2). The intersection dataset, containing 32,189 SNPs (Suppl. Table 1), was analyzed with ADMIXTURE37 (Fig. 1). At K ≥ 11, ADMIXTURE identified a characteristic component for the Ket population (Suppl. Information Section 5). This component reached its global maximum of nearly 100% in Kets, closely followed by Selkups from this study (up to 81.5% at K = 19), the reference Selkups (up to 48.5%) and the Enets (up to 22.6%). The difference between the Selkups from this study and the reference Selkups21 can be attributed to a much closer geographic proximity of the former population to the settlements of Kets, with whom they have a long history of cohabitation and mixture2,10. The ‘Ket’ component occurred at high levels (up to ~20%) in four Turkic-speaking populations of the Altai region: Shors, Khakases, Altaians and Teleuts. Notably, the Altai region was populated by Yeniseian-speaking people before they were forced to retreat north (Suppl. Information, Section 2). Lower levels of the ‘Ket’ component, from 5% to 15%, were observed in the following geographic regions (in decreasing order): the Volga-Ural region, Central and South Asia, East Siberia and Mongolia and North Caucasus. The ‘Ket’ component also occurred at a low level in Russians (up to 7.1%), Finns (up to 5.4%), and, remarkably, in the Saqqaq ancient genome from Greenland (7.2%, see below). In order to verify and explain the geographic distribution of the ‘Ket’ admixture component, we have performed ADMIXTURE analysis on two additional datasets, different in population (Suppl. Table 2) and marker selection (Suppl. Table 1) (see Suppl. Information, Section 5). In summary, we suggest the existence of an admixture component with a peculiar geographic distribution, observed in some previous studies but not discussed there17,18. In addition to the Kets, this component is characteristic also for Samoyedic-speaking and Ugric-speaking people of the Uralic language family: Selkups, Enets, Nenets, Khanty, Mansi, with a notable exception of Samoyedic-speaking Nganasans. The proportion of the ‘Ket-Uralic’ admixture component correlated strongly with the worldwide frequency of mitochondrial haplogroup U4 (Pearson’s correlation coefficient up to 0.8 and a corresponding p-value of 7 × 10⁻⁸) and with the frequency of Y-chromosomal haplogroup Q in Eurasian populations (correlation coefficient up to 0.9 and p-value 2 × 10⁻⁷) (Suppl. Information, Section 10). Kets in the context of Siberian populations In order to study the relationship of Kets and other Siberian populations with the relevant ancient genomes, we have constructed three additional datasets: the dataset based on the Ket genome sequences and the HumanOrigins array SNP data22 and two datasets based on genome sequences only (Suppl. Tables 1 and 2). The Ket and Selkup populations were closely related according to multiple analyses (see the ADMIXTURE plot in Fig. 1, PCA plots in Suppl. Figs. 6.3, 6.6, TreeMix tree in Fig. 2 and outgroup f3 statistics38 in Suppl. Fig. 7.2). Nganasans appeared as the closest relatives of Kets according to statistics f3 (Yoruba; Ket, X): the statistic for Nganasans was significantly different from that of the second-best hit (Suppl. Fig. 7.2). In general, outgroup f3 statistics (Yoruba; Test, X) were tightly correlated between the Kets, the Selkups and the Nganasans, with Pearson’s correlation coefficients ranging from 0.96 to 0.999 (Suppl. Information, Section 7), suggesting that these populations form a closely related group. In line with these results, Nganasans, Kets, Selkups and Yukaghirs formed a clade in a maximum likelihood tree constructed with TreeMix on a HumanOrigins-based dataset of 194,750 SNPs (Fig. 2). ] ] 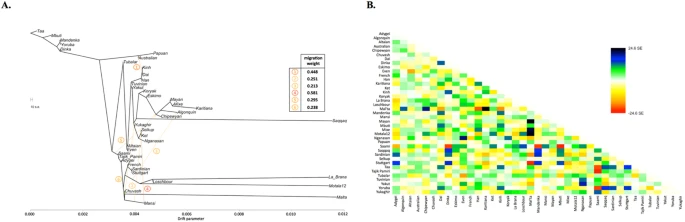 ] Figure 2 In our ADMIXTURE analyses (Fig. 1A, Suppl. Fig. 5.4), the Saqqaq Paleo-Eskimo individual featured the following components: Beringian, Siberian and South-East Asian. Thus, Saqqaq Paleo-Eskimo has mostly Beringian ancestry (similar to modern Eskimo, Inuits, Aleutians, Koryaks, etc.): see outgroup f3 statistics and associated Zdiff scores in Suppl. Figs. 7.17–7.19, migration edges modelled with TreeMix in Fig. 3 and the ADMIXTURE results in the original study16. Beringian ancestry in Saqqaq is combined with considerable Siberian ancestry: 32% or 28% as a sum of Siberian ADMIXTURE components in this study (Fig. 1A, Suppl. Fig. 5.4); ~25% according to ADMIXTURE analysis in the original study (Rasmussen et al. 2010)16; from 31% to 57% according to f4 statistic ratios calculated with various outgroups (Suppl. Information, Section 8, Suppl. Table 6). This ‘core Siberian’ component in Saqqaq is apparently most closely related to modern Nganasans16 (Suppl. Fig. 7.17) and to the Nganasan-related clade in general (see a TreeMix tree in Fig. 2). The Kets are the only representatives of this clade in the genome-based datasets in this study. According to the pairwise correlation between outgroup f3 statistics (the method used in Allentoft et al.6), Kets are closer to Saqqaq as compared to Nivkhs, Altaians, Buryats and Yakuts (Suppl. file S2). According to Euclidean distances in the ten-dimensional space of principal components on the HumanOrigins dataset, Kets were a closer population to Saqqaq than Nganasans, Selkups, Yukaghirs and the other populations (Fig. 4). However, the outgroup f3 statistics (Yoruba; Saqqaq, Ket) in many cases were not significantly different from f3 (Yoruba; Saqqaq, other Siberian population): e.g., see |Zdiff| scores < 3 for f3 (Yoruba; Saqqaq, Nivkh) (Suppl. Figs. 7.18, 7.19). The same result was produced with f4 (Saqqaq, Yoruba; Nivkh, Ket): an absolute Z-score was lower than 2 (Suppl. Fig. 8.18A,B). |
|

