Post by Admin on May 9, 2020 5:52:28 GMT
Figure 3
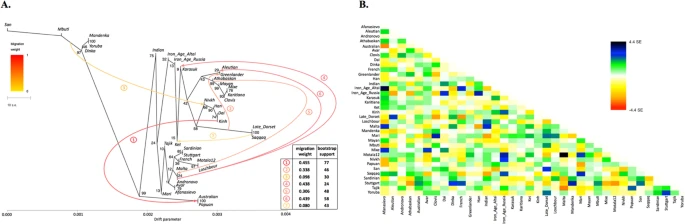
(A) A maximum likelihood tree with 7 migration edges computed on the genome-based dataset without transitions. Edge weight and bootstrap support values are shown in the table, the drift parameter is shown on the x-axis and bootstrap support values for tree nodes are indicated. Migration edges are numbered according to the order of their appearance in the sequence of trees from m = 0 to m = 8. Note to the figure: as migration edges and tree topology are inter-dependent in bootstrapped trees, bootstrap support for the edges in the original tree was calculated by summing up support for closely similar edges in bootstrapped trees. Below these edge groups are listed for edges #1–7: 1/ Australian and/or Papuan the (Nivkh, Han, Dai, Kinh) clade or any of its members; 2/ Greenlander Inuit or the (Greenlander, Aleutian) clade Saqqaq and/or Late Dorset (optionally a wider clade with Nivkh); 3/ any clade containing African populations any clade composed of Nivkh/Han/Dai/Kinh (optionally a wider clade with Late Dorset and/or Saqqaq and/or Iron Age Altai); 4/ any clade composed of Mal’ta/Afanasievo/Andronovo (optionally a wider clade with Aleutian and/or Mari) Karasuk; 5/ Mal’ta (optionally a wider clade with Motala12/Afanasievo/Andronovo/Aleutian) any clade composed exclusively of Native Americans and/or Greenlander; 6/ any clade composed exclusively of populations with European ancestry Aleutian; 7/ Ket (optionally a wider clade with Karasuk and/or Iron Age Altai and/or Iron Age Russia) Saqqaq and/or Late Dorset. (B) Residuals from the fit of the model to the data visualized. 96.72% variance is explained by the tree.
Figure 4
(A) PC3 vs. PC4 plot for the dataset ‘Ket genomes + HumanOrigins array’. African populations are not shown. Populations are color-coded by geographic region or language affiliation (in the case of Siberian and Central Asian populations) and most relevant populations are differentiated by marker shapes. Ancient genomes are shown in black. For the corresponding PC1 vs. PC2 plot see Suppl. Fig. 6.7. (B) PC3 vs. PC4 plot, zoom on the Ket individuals. Here is a list of populations closest to Saqqaq based on the average Euclidean distances in the multi-dimensional space of ten principal components (distances in parentheses): Ket (0.022), Nganasan (0.025), Selkup (0.026), Yukaghir (0.028), Eskimo (0.032), Koryak (0.032), Mansi (0.032), Itelmen (0.033), Chukchi (0.033), Dolgan (0.035).
Allentoft et al.6 have shown that in the early Bronze Age the Altai region was inhabited by a genetically West Eurasian population of the Afanasievo archaeological culture, most similar to the Yamnaya culture with about 50% of ANE ancestry6 and to the modern Avars (Suppl. file S2, Fig. 3, Suppl. Figs. 9.4, 9.5). In the late Bronze Age this population apparently had being gradually admixed with Siberians, giving rise to the Karasuk culture and the later cultures of the Iron Age6. The ancient genome ‘Iron Age Russia’, carbon-dated to 721–889 AD6, is most closely related to the typical modern Siberians: Nganasans according to the outgroup f3 statistic in the original study6 and Altaians or Koryaks according to the outgroup f3 statistics and their pairwise correlations on our datasets lacking Nganasans (Suppl. file S2). However, according to various analyses, the ‘Iron Age Altai’ (dated roughly to 2900-1500 YBP) and the Karasuk (carbon-dated to 3531-3261 YBP) populations of two and six genomes, respectively, are most closely related to each other and to Kets (Suppl. files S2, S3, Suppl. Figs. 7.5, 7.6, 8.17A, 9.1). The outgroup f3 statistics (Yoruba; Karasuk, X) on both genome-based datasets selected Kets as the best hit for Karasuk (Suppl. files S2, S3, Suppl. Fig. 7.5), although statistics for Mayans, Greenlanders, Mixe, Saqqaq, Mal’ta, Iron Age Russia and Aleutian were not significantly different (|Zdiff| score < 3). Similarly, Native American, Beringian populations and Selkups were the best hits for Iron Age Altai and Karasuk according to the outgroup f3 statistics in the original study (Kets were lacking in the dataset, see Allentoft, et al.6). Importantly, the Karasuk culture has been tentatively associated with the Yeniseian-speaking people based on the toponymic evidence5 and the Altai region is considered to be the homeland of the Yeniseian language family2. As another piece to this puzzle, we observed genetic continuity between the Kets and the ancient genomes from the Altai.
Mal’ta (ancient North Eurasian) ancestry in Kets
The outgroup statistic f3 (Yoruba; Mal’ta, Ket) (Raghavan et al. 2014)21 was higher than statistics for all other Siberian and most Beringian populations. However, the statistic values were not significantly different within a large group of North Eurasians, according to Zdiff scores (Suppl. Figs. 7.13–7.16). Zdiff score for f3 (Yoruba; Mal’ta, Ket) vs. f3 (Yoruba; Mal’ta, Nganasan) equaled 7.4, 7.0 vs. f3 (Yoruba; Mal’ta, Yukaghir) and only 2.7 vs. f3 (Yoruba; Mal’ta, Selkup) (Suppl. Fig. 7.13). Thus, we suggest that, unlike the other members of the Nganasan-related clade (Fig. 2), Kets and, to a lesser extent, Selkups have a high proportion of Mal’ta ancestry, alternatively referred to as the ANE ancestry22. The Mal’ta ancestry in Kets was further supported by the TreeMix39 analysis, specifically by a migration edge connecting Mal’ta to the Ket-Karasuk clade, with a weight of 43% (Suppl. Fig. 9.1, Suppl. Table 7). Taking into account the admixture coefficients for the two sequenced Ket individuals (Ket891 and Ket884, Fig. 1A), we selected Ket891 as an individual with lower values of the North European and Siberian admixture components (in the K = 19 dimensional space). In addition, Ket891 was identified as non-admixed by reAdmix analyses (Suppl. Table 3). Ket891 demonstrated a slightly closer genetic affinity to Mal’ta (compare Suppl. Figs. 7.13 and 7.14).
These results were consistent with calculations of f4 statistic in two configurations: (X, Chimp; Mal’ta, Stuttgart) or (X, Papuan; Sardinian, Mal’ta), reproducing the previously used statistics22,26 (Suppl. Figs. 8.1–8.6). f4 (X, Chimp; Mal’ta, Stuttgart) analysis tests whether the population X has more drift shared with Mal’ta or with Stuttgart (an early European farmer, EEF22). Sardinians were used as the closest modern proxy for EEF22 in f4 (X, Papuan; Sardinian, Mal’ta). All possible population pairs (X,Y) were tested by f4 (Mal’ta, Yoruba; Y, X) on the genome-based dataset, including both Ket individuals (Fig. 5A). Compared to Kets, Mal’ta was significantly closer to none of the populations including Native Americans.
Figure 5
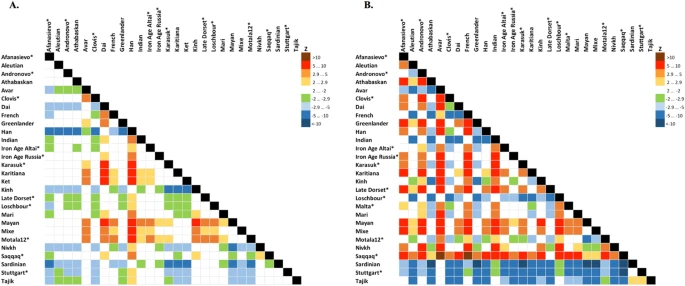
Statistics f4 (Mal'ta, Yoruba; Y, X) (A), f4 (Ket, Yoruba; Y, X) (B) computed on the genome-based dataset with African, Australian and Papuan populations excluded. See the corresponding results for the dataset without transitions in Suppl. Figs 8.15 and 8.16, respectively. A matrix of color-coded Z-scores is shown and ancient genomes are marked with asterisks. Z-score equals the number of standard errors by which the statistic differs from zero and |Z| > 2.9 demonstrates that the statistic is significantly different from zero using Bonferroni correction for 27 independent tests (threshold p-value of 0.001852). Rows show Z-scores for f4 (Mal'ta, Yoruba; row, column) or f4 (Ket, Yoruba; row, column), vice versa for columns.
Based on all analyses, we can tentatively model Kets as a two-way mixture of broadly defined East Asians and ANE. Therefore, ANE ancestry in Kets can be estimated, using various f4-ratios, at 27% to 43% (depending on reference populations and datasets), vs. 25–53% in various Native American groups (Suppl. Table 6, see details in Suppl. Information, Section 8). Given non-significant Zdiff scores and f4 statistics (Fig. 5A) discussed above, it is difficult to identify the exact Eurasian population west of Chukotka and Kamchatka with the highest degree of the Mal’ta ancestry, but Kets are a good candidate. We speculate that ANE component was acquired by ancestors of Kets in the Altai region, where the Bronze Age Okunevo culture was located, with a surprisingly close genetic proximity to Mal’ta6. Later, the Yeniseian-speaking people occupied this region until the 16th–18th centuries3,4.
(A) A maximum likelihood tree with 7 migration edges computed on the genome-based dataset without transitions. Edge weight and bootstrap support values are shown in the table, the drift parameter is shown on the x-axis and bootstrap support values for tree nodes are indicated. Migration edges are numbered according to the order of their appearance in the sequence of trees from m = 0 to m = 8. Note to the figure: as migration edges and tree topology are inter-dependent in bootstrapped trees, bootstrap support for the edges in the original tree was calculated by summing up support for closely similar edges in bootstrapped trees. Below these edge groups are listed for edges #1–7: 1/ Australian and/or Papuan the (Nivkh, Han, Dai, Kinh) clade or any of its members; 2/ Greenlander Inuit or the (Greenlander, Aleutian) clade Saqqaq and/or Late Dorset (optionally a wider clade with Nivkh); 3/ any clade containing African populations any clade composed of Nivkh/Han/Dai/Kinh (optionally a wider clade with Late Dorset and/or Saqqaq and/or Iron Age Altai); 4/ any clade composed of Mal’ta/Afanasievo/Andronovo (optionally a wider clade with Aleutian and/or Mari) Karasuk; 5/ Mal’ta (optionally a wider clade with Motala12/Afanasievo/Andronovo/Aleutian) any clade composed exclusively of Native Americans and/or Greenlander; 6/ any clade composed exclusively of populations with European ancestry Aleutian; 7/ Ket (optionally a wider clade with Karasuk and/or Iron Age Altai and/or Iron Age Russia) Saqqaq and/or Late Dorset. (B) Residuals from the fit of the model to the data visualized. 96.72% variance is explained by the tree.
Figure 4
(A) PC3 vs. PC4 plot for the dataset ‘Ket genomes + HumanOrigins array’. African populations are not shown. Populations are color-coded by geographic region or language affiliation (in the case of Siberian and Central Asian populations) and most relevant populations are differentiated by marker shapes. Ancient genomes are shown in black. For the corresponding PC1 vs. PC2 plot see Suppl. Fig. 6.7. (B) PC3 vs. PC4 plot, zoom on the Ket individuals. Here is a list of populations closest to Saqqaq based on the average Euclidean distances in the multi-dimensional space of ten principal components (distances in parentheses): Ket (0.022), Nganasan (0.025), Selkup (0.026), Yukaghir (0.028), Eskimo (0.032), Koryak (0.032), Mansi (0.032), Itelmen (0.033), Chukchi (0.033), Dolgan (0.035).
Allentoft et al.6 have shown that in the early Bronze Age the Altai region was inhabited by a genetically West Eurasian population of the Afanasievo archaeological culture, most similar to the Yamnaya culture with about 50% of ANE ancestry6 and to the modern Avars (Suppl. file S2, Fig. 3, Suppl. Figs. 9.4, 9.5). In the late Bronze Age this population apparently had being gradually admixed with Siberians, giving rise to the Karasuk culture and the later cultures of the Iron Age6. The ancient genome ‘Iron Age Russia’, carbon-dated to 721–889 AD6, is most closely related to the typical modern Siberians: Nganasans according to the outgroup f3 statistic in the original study6 and Altaians or Koryaks according to the outgroup f3 statistics and their pairwise correlations on our datasets lacking Nganasans (Suppl. file S2). However, according to various analyses, the ‘Iron Age Altai’ (dated roughly to 2900-1500 YBP) and the Karasuk (carbon-dated to 3531-3261 YBP) populations of two and six genomes, respectively, are most closely related to each other and to Kets (Suppl. files S2, S3, Suppl. Figs. 7.5, 7.6, 8.17A, 9.1). The outgroup f3 statistics (Yoruba; Karasuk, X) on both genome-based datasets selected Kets as the best hit for Karasuk (Suppl. files S2, S3, Suppl. Fig. 7.5), although statistics for Mayans, Greenlanders, Mixe, Saqqaq, Mal’ta, Iron Age Russia and Aleutian were not significantly different (|Zdiff| score < 3). Similarly, Native American, Beringian populations and Selkups were the best hits for Iron Age Altai and Karasuk according to the outgroup f3 statistics in the original study (Kets were lacking in the dataset, see Allentoft, et al.6). Importantly, the Karasuk culture has been tentatively associated with the Yeniseian-speaking people based on the toponymic evidence5 and the Altai region is considered to be the homeland of the Yeniseian language family2. As another piece to this puzzle, we observed genetic continuity between the Kets and the ancient genomes from the Altai.
Mal’ta (ancient North Eurasian) ancestry in Kets
The outgroup statistic f3 (Yoruba; Mal’ta, Ket) (Raghavan et al. 2014)21 was higher than statistics for all other Siberian and most Beringian populations. However, the statistic values were not significantly different within a large group of North Eurasians, according to Zdiff scores (Suppl. Figs. 7.13–7.16). Zdiff score for f3 (Yoruba; Mal’ta, Ket) vs. f3 (Yoruba; Mal’ta, Nganasan) equaled 7.4, 7.0 vs. f3 (Yoruba; Mal’ta, Yukaghir) and only 2.7 vs. f3 (Yoruba; Mal’ta, Selkup) (Suppl. Fig. 7.13). Thus, we suggest that, unlike the other members of the Nganasan-related clade (Fig. 2), Kets and, to a lesser extent, Selkups have a high proportion of Mal’ta ancestry, alternatively referred to as the ANE ancestry22. The Mal’ta ancestry in Kets was further supported by the TreeMix39 analysis, specifically by a migration edge connecting Mal’ta to the Ket-Karasuk clade, with a weight of 43% (Suppl. Fig. 9.1, Suppl. Table 7). Taking into account the admixture coefficients for the two sequenced Ket individuals (Ket891 and Ket884, Fig. 1A), we selected Ket891 as an individual with lower values of the North European and Siberian admixture components (in the K = 19 dimensional space). In addition, Ket891 was identified as non-admixed by reAdmix analyses (Suppl. Table 3). Ket891 demonstrated a slightly closer genetic affinity to Mal’ta (compare Suppl. Figs. 7.13 and 7.14).
These results were consistent with calculations of f4 statistic in two configurations: (X, Chimp; Mal’ta, Stuttgart) or (X, Papuan; Sardinian, Mal’ta), reproducing the previously used statistics22,26 (Suppl. Figs. 8.1–8.6). f4 (X, Chimp; Mal’ta, Stuttgart) analysis tests whether the population X has more drift shared with Mal’ta or with Stuttgart (an early European farmer, EEF22). Sardinians were used as the closest modern proxy for EEF22 in f4 (X, Papuan; Sardinian, Mal’ta). All possible population pairs (X,Y) were tested by f4 (Mal’ta, Yoruba; Y, X) on the genome-based dataset, including both Ket individuals (Fig. 5A). Compared to Kets, Mal’ta was significantly closer to none of the populations including Native Americans.
Figure 5
Statistics f4 (Mal'ta, Yoruba; Y, X) (A), f4 (Ket, Yoruba; Y, X) (B) computed on the genome-based dataset with African, Australian and Papuan populations excluded. See the corresponding results for the dataset without transitions in Suppl. Figs 8.15 and 8.16, respectively. A matrix of color-coded Z-scores is shown and ancient genomes are marked with asterisks. Z-score equals the number of standard errors by which the statistic differs from zero and |Z| > 2.9 demonstrates that the statistic is significantly different from zero using Bonferroni correction for 27 independent tests (threshold p-value of 0.001852). Rows show Z-scores for f4 (Mal'ta, Yoruba; row, column) or f4 (Ket, Yoruba; row, column), vice versa for columns.
Based on all analyses, we can tentatively model Kets as a two-way mixture of broadly defined East Asians and ANE. Therefore, ANE ancestry in Kets can be estimated, using various f4-ratios, at 27% to 43% (depending on reference populations and datasets), vs. 25–53% in various Native American groups (Suppl. Table 6, see details in Suppl. Information, Section 8). Given non-significant Zdiff scores and f4 statistics (Fig. 5A) discussed above, it is difficult to identify the exact Eurasian population west of Chukotka and Kamchatka with the highest degree of the Mal’ta ancestry, but Kets are a good candidate. We speculate that ANE component was acquired by ancestors of Kets in the Altai region, where the Bronze Age Okunevo culture was located, with a surprisingly close genetic proximity to Mal’ta6. Later, the Yeniseian-speaking people occupied this region until the 16th–18th centuries3,4.