MATERIALS AND METHODS
Ancient DNA extraction and sequencing
DNA extractions from prehistoric bone and teeth and all further laboratory work including library preparation were performed at the ancient DNA laboratory facilities at the Archeological Research Laboratory at Stockholm University. We cleaned the samples from earth and potential contaminants using 1 to 3% NaOCl solution and ddH2O mechanical cleansing. We thereafter subjected the samples to ultraviolet radiation at about 6 J/cm2 at 254 nm to further decontaminate the surfaces. Bone powder or bone fragments were obtained using a Dremel drill. Weight of taken sample ranged from 50 to 400 mg. The samples were digested in 1 M urea, EDTA (0.5 M), and proteinase K (10 mg/ml) at temperatures between 37° and 55°C. A blank negative control was added for every 8 to 10 samples at this step. Upon dissolving, we concentrated the DNA extract using Amicon filters (Millipore) and purified it with silica-based MinElute spin columns (Qiagen) (40–42), eluting the DNA in 110 μl of elution buffer (Qiagen). Double-stranded blunt-end–repaired Illumina libraries were prepared from 20 μl of DNA. Each library was amplified in at least five replicates using 0.5 μl of 10 μM index primer per library. The thermocycling conditions used were as in (42), and the number of cycles was estimated individually for each library using quantitative polymerase chain reaction (qPCR). For some samples, damage-repaired double-stranded libraries (table S1) were prepared with USER enzyme (NEB/BioNordika) to remove deaminated cytosines (43). All libraries were sequenced using Illumina HiSeq X platform at the SciLife sequencing center at Stockholm.
Sequencing data processing
Paired-end sequencing reads were merged using MergeReadsFastQ_cc.py requiring a minimum 11–base pair (bp) overlap, and residual adapter sequences were trimmed (44). Merged reads were mapped to the human reference genome (version hs37d5) using BWA (version 0.7.13) aln algorithm (45) in single end mode (samse) with parameters “-n 0.01 -o 2 -l 16500” (37). PCR duplicates were filtered using a modified version of FilterUniqSAMCons_cc.py (44) to prevent the biased choice of the nucleotides. Reads mapped to the reference genome with more than 10% mismatches and shorter than 35 bp and with mapping quality below 30 were filtered. For each sample, all libraries including the damage-repair and non–damage-repair libraries were merged into a single bam file using SAMtools (46) merge module. These files were used for further variant discovery (C/T-type transitions excluded) to be used in population genetics analysis. We also merged only damage-repair libraries for the samples to be used in diversity analysis.
Evaluation of authenticity
We assessed the authenticity of all sequencing reads based on three different approaches including (i) evaluation of cytosine (C)-to thymine (T)-type transitions at the 5′ ends of all sequencing reads, (ii) mitochondrial DNA (mtDNA)–based estimation of contamination for all samples, and (iii) X chromosome–based estimation of contamination for male samples (table S1). All sequences showed increased frequency of C/T-type transitions at 5′ ends (up to 37% at the last five bases) (table S1). To estimate contamination levels based on mtDNA, we used two different methods: (i) According to the method developed in (47), proportion of contamination per sample ranged between 1.8 and 20.5% (table S1). In this method, private alleles that have a frequency of less than 5% in 311 modern reference mtDNAs with a minimum base quality of 30 and a minimum genomic depth of 10× were used. Point estimate of contamination was calculated on transversion-type variations by summing the consensus and alternative allele counts across all allele counts. (ii) In the second mtDNA-based method developed in (48) that provides Bayesian estimates of contamination, the probability of being authentic per sample was estimated to be between 79 and 99% (table S1). For this method, we first produced consensus mitochondrial sequences using ANGSD (49) with parameters “-doFasta 2 -doCounts 1-minQ 30 -minMapQ 30 -setMinDepth 3” and calculated the probabilities for being authentic per sequence using contamMix library in R. Last, according to X chromosome–based estimation of degree of contamination in male individuals, contamination estimates were between 0.0001 and 0.009 (table S1). This method that was implemented in ANGSD (49) is based on examination of heterozygous positions on the X chromosome. To run this method, we first created a binary count file with the command “angsd -r X:5000000-154900000 -doCounts 1 -setMinDepth 3 -setMaxDepth 100 -i Counts 1 -minMapQ 30 -minQ 30” and then calculated the contamination estimate on transversion-type SNPs by “contamination -d 3 -e 100.” Contamination estimates and two different CIs including sampling all reads from each site (method 1) and sampling one read randomly per site (method 2) are reported in table S1. We included samples in the downstream analysis if the sample did not fail at least two of the applied tests; we thus included all samples for further analysis.
Biological sex determination
Biological sex of the individuals was determined using the Ry method, which was developed in (50). This method relies on dividing the total number of reads that were mapped to the Y chromosome to the total number of reads that were mapped to the X and Y chromosome. Computation was performed on sequencing reads with a minimum read length of 35 bp, with a mapping quality minimum of 30, and that were mapped to the reference genome with a maximum of 10% mismatches. We used ry_compute.py script, which is available at
github.com/pontussk/ry_compute/blob/master/ry_compute.py.
Biological relatedness estimation
We have used the program lcMLkin to detect related individuals (51). We chose only transversion-type SNPs (n = 1,065,109) from the Estonian Genome Diversity Project (EGDP) (52) to avoid bias due to postmortem damage in our samples. The genotype likelihoods of the selected SNP positions were called using “SNPbam2vcf.py” with a minimum frequency of 0.15 and using the population allele frequencies from the ancient individuals generated in this study. After a first run with all the ancient individuals, we used only the unrelated individuals as founders to estimate the allele frequencies of each pair. We inferred the most probable relationship between the ancient samples analyzed here comparing the obtained values of k0, k1, and k2 with the expected values of these parameters for the different degrees of relationship shown in (53) (see Supplementary Text).
Uniparental markers
To determine Y chromosome haplogroups, variants at haplogroup defining SNPs were identified on the basis of haplogroup definitions from PhyloTreeY (54) (http://phylotree.org/Y/tree/) and nomenclature from the International Society of Genetic Genealogy database (https://isogg.org) (v.11.349). The variants were called using SAMtools (v.1.8) mpileup with “–B” parameter (46), and positions with base and mapping quality of less than 30 were filtered. We also excluded insertions and deletions and sites that displayed multiple alleles from the analysis. Depending on the library preparation mode (damage-repaired or non–damage-repaired libraries), we used either transversions (non–damage-repaired libraries) or both transitions and transversions (damage-repaired libraries) in Y haplogroup assignment (table S18).
Mitochondrial haplogroups of 38 individuals were reported in (18) and those of 2 individuals (N2a-Matta-1 and cta016) were reported in this study (table S1). In brief, using sequence alignment files (BAM files) as input, consensus mitochondrial sequences were produced using ANGSD with parameters -doFasta 2 -doCounts 1-minQ 30 -minMapQ 30 -setMinDepth 3. Using HaploFind (55) and HaploGrep (56), mitochondrial haplogroups were determined. For the final assignment of haplogroups, visual inspection against PhyloTree mtDNA tree (build 17) was performed (table S1) (18) (see Supplementary Text).
SNP discovery and datasets
We prepared four different datasets for population genetics and diversity analysis including the following: (i) The Human Origins dataset consists of pseudohaploidized genotypes of ancient individuals sequenced in this study and pseudohaploidized genotypes of published ancient individuals (table S2) for a total of 594,924 SNPs genotyped in 2730 individuals from 203 present-day populations, which is available as curated Human Origins SNP Array dataset from (37, 57). This dataset was used in PCA, model-based clustering analysis, and outgroup f3-statistics. (ii) The 1000 Genomes dataset consists of pseudohaploidized genotypes of ancient individuals sequenced in this study as well as pseudohaploidized genotypes of published ancient individuals (table S2) for a total of 1,938,919 transversion-type SNPs ascertained with a minor allele frequency of 10% in the Yoruba population (n = 108 individuals) from phase 3 of the 1000 Genomes Project (58). This dataset was used in f4-statistics, qpAdm, and admixture graph-fitting analysis. (iii) The EGDP dataset consists of pseudohaploidized genotypes of ancient individuals sequenced in this study for 42,971,058 SNPs genotyped in 483 humans from 148 present-day populations, which is available from (52). This dataset was used for kinship analysis. (iv) The diploid dataset consists of diploid genotypes of 13 ancient individuals sequenced in this study with coverages above 4.5× including Kamenka-1, Kamenka-3, kra001, cta016, irk022, irk025, irk030, irk034, irk036, irk040, irk061, irk068, and irk075 (table S1), as well as 3 published individuals including Stuttgart (37), Loschbour (37), and Ust’ Ishim (25). This dataset was used in diversity analysis including estimation of heterozygosity, RoH, and also effective population size changes in time.
To prepare the diploid dataset, we used bam files that were prepared by merging damage-repaired libraries of Kamenka-1, Kamenka-3, kra001, cta016, irk022, irk025, irk030, irk034, irk036, irk040, irk061, irk068, and irk075, as well as bam files including Stuttgart (37), Loschbour (37), and Ust’ Ishim (25), which were processed with the same parameters. The last two bases of each read were trimmed using TrimBam of bamutils (59). Using Picard (http://broadinstitute.github.io/picard/), “read groups” were added to the files. Using indels of phase 1 of the 1000 Genomes Project (58) as reference, indel realignment was performed using GATK (60) IndelRealignment module. To call the diploid genotypes, the UnifiedGenotyper module of GATK was used with the parameters -stand_call_conf 50.0, -stand_emit_conf 50.0, -mbq 30, -contamination 0.02, and --output_mode EMIT_ALL_SITES. Using vcftools, SNP sites overlapping with 1,938,919 transversion-type SNPs were extracted. To prepare the other datasets, we used SAMtools (46) mpileup, producing pileup of each read for every genomic position of each ancient individual overlapping with 594,924 SNPs from the Human Origins SNP Array dataset (37, 57), overlapping with 42,971,058 SNPs (52), and overlapping with 1,938,919 transversion-type SNPs of African Yoruba individuals (58). Subsequently, a random read with a minimum mapping quality of 30 was selected and encoded as homozygous in the ancient individual. In the Human Origins dataset, C/T-type transitions were encoded as missing data. The 1000 Genomes dataset contained only transversion-type SNPs.
Principal components analysis
PCA was performed on the Human Origins dataset, which was prepared as described above. Principal components were calculated on present-day populations from Asia, Eurasia, Oceania, and America (table S2) using smartpca tool (v.1600) of the EIGENSOFT (61) with numoutlieriter: 0, shrinkmode: YES, and lsqproject: YES options. The result was plotted using the ploteig program of the EIGENSOFT (61).
Model-based clustering
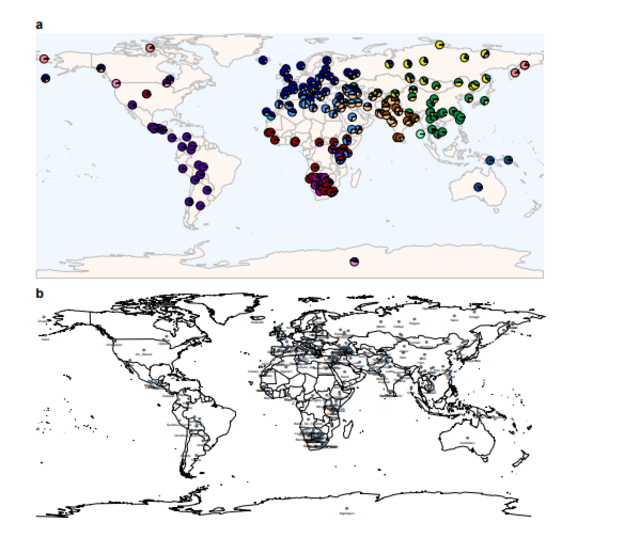
Unsupervised clustering was performed to estimate the ancestry components of ancient and present-day individuals. This analysis was conducted using ADMIXTURE (21) on the Human Origins dataset, which was described above. This dataset was divided into two sub-datasets to encompass (i) modern individuals and (ii) ancient individuals using the “--keep” option in PLINK (v1.90) (62). As described in (63), to prevent influence of missingness in ancient samples and the difference in number of overlapping SNPs across samples on analysis, we first run ADMIXTURE on the modern dataset and inferred the cluster memberships of each ancient individual using the ancestral allele frequencies that were obtained from the modern dataset (63). Before ADMIXTURE analysis, the modern dataset consisting of a total of 2340 individuals from present-day Asia, Eurasia, America, Oceania, and Africa populations was filtered for linkage disequilibrium using the --indep-pairwise option in PLINK (v1.90) with parameters (--indep-pairwise 200 25 0.2) (62), yielding a total of 594,924 SNPs. The ancient dataset was filtered by selecting the same set of SNPs using the “--extract” option in PLINK (v1.90) (62). For every hypothetical cluster number (K) ranging between K = 2 and K = 16, ADMIXTURE was run 30 times with different random seeds on the modern dataset, and cluster memberships of each ancient individual for each K and each run were computed using the ancestral allele frequencies (63). After merging the ancestral clusters of modern and ancient individuals for each K and each run, common signals between different replicate runs were determined using the LargeKGreedy algorithm of CLUMPP (64). Results were visualized using rworldmap, ggplot2, SDMTools, and RColorBrewer packages of GNU R version 3.3.0. Since we run the ADMIXTURE on modern samples and projected the ancient samples on this, we did not perform cross-validation to decide which K explains the observed pattern better; instead, we examined each K and present the results for all K values (fig. S3, table S4, and see Supplementary Text).
qpAdm analysis
To estimate the admixture patterns in ancient Siberian genomes, qpAdm analysis was performed. Using the qpAdm program of ADMIXTOOLS (57) package (https://github.com/DReichLab/AdmixTools) with the “allsnps: YES” option on the Human Origins dataset prepared as described above, we estimated the ancestry proportions in the genomes of Saqqaq (30) and Kolyma_M (5). First, to estimate ancestry proportions in the genome of Saqqaq, the following set of six populations was used as outgroup and provided as “right populations” to the program: MbutiPygmy, Yoruba, Mota, Onge, Ju_Hoan_north, and Papuan. Providing the “left populations” list as Saqqaq (30), K14 (26), and Yakutia_Lena_6850_6190_BP, we modeled the Saqqaq as a two-way admixture of the K14 and Yakutia_Lena_6850_6190_BP (table S11). To model the Kolyma_M as a two-way admixture of Khaiyrgas-1 and Devils_Cave_N (5), another set of six populations including Yoruba, Mota (65), Onge, Ju_Hoan_north, Papuan, and Ust_Ishim was used as in the right populations list as outgroup. We considered the models with a P value of >0.05 (indicating a small deviation of data from the model expectation) as consistent with the tested model.
f3- and f4-statistics
Shared genetic drift between two populations (or individuals) since their divergence from an ancestral population was computed using the outgroup f3-statistics. The qp3pop program of ADMIXTOOLS (57) package was used with the “inbreed: YES” option on the Human Origins dataset described above to calculate f3-statistics for the tree-like topology in the form of f3(Outgroup, Test Population, Modern Population) in which the Yoruba population was used as Outgroup, each of the 40 ancient Siberians was used as Test Population, and 194 modern populations from the Human Origins dataset were used as Modern Population. Significant deviations from zero indicated a deviation from the proposed tree-like topology; thus, more positive values indicated an excess of shared genetic drift between the Test Population and Modern Population. The f4-statistics for the tree-like topology of the shape f4(Outgroup, Test; Group1, Group2) measures the shared genetic drift between Test Population and Group1 and Group2. Assuming no recent interactions between each of these four groups, tree topologies are balanced at zero, and deviation from zero implies a deviation from this proposed tree. Positive values indicate that Test population shares more alleles with Group1, and negative values indicate that Test population shares more alleles with Group2. Using the qpDstat program of ADMIXTOOLS (57) package with the “f4mode:YES” option, f4-statistics were calculated for a set of tree-like topologies.
Admixture graph fitting
A statistical frame implemented in TreeMix (22) was used to examine the genetic relationships between ancient individuals and Khaiyrgas-1. The method relies on building a maximum likelihood tree of the given populations using the covariance matrix of allele frequencies. This method was applied to Khaiyrgas-1 (0.3×), irk034 (14.5×), kra001 (13.6×), Tianyuan (28), Kolyma_M (5), Yana_UP (5), Anzick (29), MA1 (23), and AfontovaGora3 (24). Tree was rooted with the Yoruba population, and analysis was run on the 1000 Genomes dataset described above. To inactivate the correction for low sample size, the program was run with the “-noss” option. Using “-k 500 -se” parameters, SEs were estimated using blocks of 500 SNPs. The analysis was run for m = 0 zero-migration model. The analysis was run for 30 different random seeds, and the graph with the highest likelihood and most common topology was reported (fig. S5).
Heterozygosity estimation
We estimated the heterozygosity levels in the genomes of 13 ancient individuals with coverages above 4.5× (Fig. 4A and table S1) as well as in the genomes of Loschbour (6.2×, European Mesolithic) and Stuttgart (9.2×, European Neolithic) (37). Heterozygosity levels were computed using ANGSD (49) on the alignment files (BAM) of the individuals as “angsd -i ${bamfile} -GL 1 -doGlf 2 -doMajorMinor 1 -sites $sites -doSaf 1 -anc $ref. -minQ 30 -minmapq 30 -noTrans 1 -out ${filebase}” and “realSFS ${filebase}.saf.idx -bootstrap 100 -P 16 > ${filebase}_est_boot.ml.”
Runs of homozygosity
We computed the RoH in the genomes of 13 ancient Siberian individuals with coverages above 4.5× (Fig. 4B and table S1). For this analysis, the diploid dataset as described above was used. First, the dataset was converted to plink file format using vcftools (66) by extracting Yoruba-ascertained transversion SNPs. To compute the RoH levels, plink (62) was used as “plink --file ${filename} --homozyg --homozyg-density 50 --homozyg-gap 100 --homozyg-kb 500 --homozyg-snp 50 --homozyg-window-het 1 --homozyg-window-snp 50 --homozyg-window-threshold 0.05 --out ${filename}.”
Multiple sequentially Markovian coalescent
MSMC was used to infer the changes in effective population size through time. The analysis was restricted to the samples with coverages above 7.5× coverage. Input files were prepared using scripts provided with the release of MSMC (https://github.com/stschiff/msmc-tools), and MSMC was run with the parameters --fixedRecombination and -r 0.88. Effective population sizes were plotted on the basis of a mutation rate of 1.25 × 10⁻⁸ and a generation time of 30 years, and the curves were shifted on the basis of approximate ages of the samples.
Analysis for Y. pestis
We used 205 DNA libraries from 40 ancient individuals. Quality of the sequencing libraries was evaluated using fastqc (www.bioinformatics.babraham.ac.uk/projects/fastqc/). Reads were first mapped to a hybrid Yersinia genome (39), and those mapping to Y. pestis CO92 reference genome were extracted. To judge the taxonomical origin of Y. pestis sequences, edit distance distribution, length distribution, deamination patterns, and breadth of coverage information were used. Malt was used to create an alignment database from reference and representative genomes of bacteria, fungi, archaea, and viruses from the National Center for Biotechnology Information RefSeq database (67). DustMasker was used to mask repetitive regions in the reference genomes. Each DNA library was aligned to the reference genome database by using the malt, and reads that were aligned to the Y. pestis reference genome were extracted using the malt-extract tool (https://github.com/rhuebler/HOPS) (68) with the default options. Reads with mapping quality of <30 and <20 nucleotides were filtered. Picard (http://broadinstitute.github.io/picard/) with MarkDuplicates option was used to remove the PCR duplicates. Edit distances were extracted using the NM field from the SAM file and visualized in R (version 3.6.2, R Core Team, 2013). MapDamage (69) was used to calculate the deamination patterns and the deamination rate of Y. pestis and human DNA sequences. To examine the coverage, SAMtools (46) “depth -a” command was used (see Supplementary Text).
Investigating the functional SNPs
We inspected the allele distribution in SNP positions associated with a selection of biological traits using SAMtools mpileup (v1.3) (46). The traits that we investigated include the status of acetylator phenotype (NAT2), diet, and a set of phenotypic traits, i.e., risk of hypertension, cancers, and drug metabolism. We further evaluated the blood group variation among ancient individuals (see Supplementary Text).
SUPPLEMENTARY MATERIALS
Supplementary material for this article is available at
advances.sciencemag.org/cgi/content/full/7/2/eabc4587/DC1