Post by Admin on Oct 21, 2020 20:46:01 GMT
Material and Methods
Subjects and Comparative Datasets
We sampled 926 Lebanese men who had three generations of paternal ancestry in the country and who gave informed consent for this study, which was approved by the American University of Beirut IRB Committee. Each provided information on his geographical origin, classified into five regions: (1) Beirut (the capital city), (2) Mount Lebanon in the center, (3) the Bekaa Valley in the east, (4) the north, and (5) the south. Each also provided information on his religious affiliation: (1) Muslim, including the sects Shiite and Sunnite, (2) Christian, including the major sects Maronite, Orthodox, and Catholic, and (3) Druze, a distinct religion that has a 1000-year history and whose followers live mainly in Syria and Lebanon.
Comparative data on haplogroup frequencies were obtained from published sources and consenting individuals from the Genographic Public Participation dataset, whose participants can choose to make their data available for subsequent studies. For the Arabian Peninsula, published data from Omani Arabs10, Qatar, United Arab Emirates, and Yemen11 were used; in addition, we used data from the Genographic Public Participation dataset for individuals originating from Oman, Qatar, United Arab Emirates, Yemen, and Saudi Arabia (Table S2 in the Supplemental Data). Data from France12, Germany13, England14, and Italy15 were used to construct a representative western European sample as described below, and data from Turkey were also available.16
Combined Y-SNP plus Y-STR datasets were available from the Arabian Peninsula10, 11 and Turkey16. European data were extracted from the consented Genographic Project Public Participation database (Table S2).
Historical Data
In addition to the contemporary subjects, we needed estimates of the likely genetic composition of the Crusaders. Historical sources17, 18, 19 show that four Crusades reached Lebanon—the first, second, third, and sixth—and that the main populations contributing were the French, Germans, English, and Italians; these sources suggest that the approximate numbers of men participating from the four countries were similar (Table 1). Y haplogroup frequencies are known in each of these modern populations12, 13, 14, 15, so if we assume that haplogroup frequencies were similar at the time of the Crusades, a weighted average western European haplogroup composition can be constructed (Table 2). This needed to be provided as numbers rather than frequencies for the tests described below. We therefore first scaled the total contribution from each country according to the smallest sample (the French12, n = 45) to produce the “weighted total” column in Table 2. We then divided each weighted total by the haplogroup frequency in that country to give a weighted number for each haplogroup from each country. Finally, we calculated the sum of these weighted numbers for each haplogroup and used the closest integer (bottom row in Table 2) in the analyses below.
Table 1
Numbers of Men Contributing to Each of the Crusades that Reached Lebanon According to Historical Sources17, 18, 19
Table 2
Construction of a Western European Y Haplogroup Sample Weighted According to the Relative Contribution from Each Country
aRare haplogroup not typed in the relevant study; value set to zero.
Genotyping
Samples were genotyped with a set of 58 Y-chromosomal binary markers by standard methods20 (Figure 2). These markers define 53 haplogroups (including paragroups), 27 of which were present in the Lebanese sample. We also typed a subset (the first 587 individuals collected, and thus with unbiased ascertainment) with 11 Y-STRs by using standard methods21, 22 (Table S1). STR alleles were named according to current recommendations23, except that “389b” was used in place of “DYS389II”; 398b = (DYS389II − DYS389I).

Figure 2
Y-Chromosomal Haplogroups Identified in Lebanese Subpopulations
The phylogenetic tree defined by the markers used is shown on the left, and the haplogroup names are given in the middle. Nomenclature is based on the 2003 YCC tree9, with departures indicated by “/-”. The absolute number of chromosomes within each haplogroup in the entire sample is shown in the “Lebanon” column, and the relative frequency within each of the three religious groups is shown on the right by the relative sizes of the circles.
General Statistical Analyses
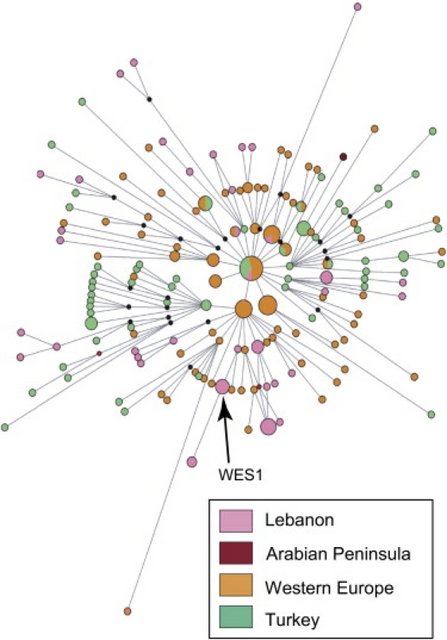
Analysis of molecular variance (AMOVA)24, population pairwise genetic distances, and Mantel tests25 were performed with the package Arlequin 3.11.26 Admixture analyses were carried out with Admix2_0.27 Median-joining networks28 were calculated with Network 4.2 (Fluxus-Engineering). Such networks were highly reticulated, and we reduced reticulations by first weighting the loci according to the inverse of their variance in the dataset used29 and subsequently constructing a reduced-median network30 to form the input of the median-joining network. Male effective population sizes were calculated with BATWING31 with a demographic model that assumed a period of constant size followed by exponential growth; prior values were set for other parameters as described previously.20
Computation of Drift Probabilities
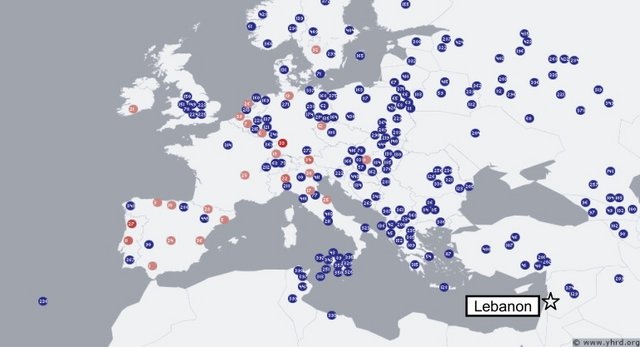
We wished to calculate the probability that a haplotype could increase from a deduced initial frequency to an observed current frequency by chance over a period specified by the historical record. In addition, we wished to evaluate the influence that admixture with an outside population might have on this probability. We had detailed data consisting of Y-SNP and Y-STR sets for some relevant groups and relied upon the YHRD database for data from other populations. A number of applications are available for estimating migration rates; these applications account for coalescence, mutation, and migration, including estimates of variation of migration, over a period of time.32, 33, 34, 35, 36, 37, 38 However, none of the packages address the specific question of testing whether drift alone could reasonably account for the emergence of modern levels of haplogroup or haplotype frequencies in the population or how much migration for a specified epoch could affect these rates if the available historical information is incorporated. We have therefore chosen to directly employ a Wright-Fisher model with sampled migration to compute the effects of drift given an admixture event of known duration.
The Wright-Fisher model39, 40 entirely replaces each generation with each succeeding one. The offspring select their parents randomly. The following calculation outlines the Wright-Fisher drift model, describing how the probability of seeing some particular number of members of a population carrying a haplotype will evolve over time. Then it considers the following circumstance: Two populations are evolving according to the Wright-Fisher model and the island model of Haldane41. First, a European population carrying a particular haplotype of interest described below (Western European Specific 1, WES1) experiences drift freely. Over some period of time, some number of this population is selected randomly and travels to Lebanon. Each generation, the children randomly select their parents from the mixed Lebanese and migrant European populations.
Subjects and Comparative Datasets
We sampled 926 Lebanese men who had three generations of paternal ancestry in the country and who gave informed consent for this study, which was approved by the American University of Beirut IRB Committee. Each provided information on his geographical origin, classified into five regions: (1) Beirut (the capital city), (2) Mount Lebanon in the center, (3) the Bekaa Valley in the east, (4) the north, and (5) the south. Each also provided information on his religious affiliation: (1) Muslim, including the sects Shiite and Sunnite, (2) Christian, including the major sects Maronite, Orthodox, and Catholic, and (3) Druze, a distinct religion that has a 1000-year history and whose followers live mainly in Syria and Lebanon.
Comparative data on haplogroup frequencies were obtained from published sources and consenting individuals from the Genographic Public Participation dataset, whose participants can choose to make their data available for subsequent studies. For the Arabian Peninsula, published data from Omani Arabs10, Qatar, United Arab Emirates, and Yemen11 were used; in addition, we used data from the Genographic Public Participation dataset for individuals originating from Oman, Qatar, United Arab Emirates, Yemen, and Saudi Arabia (Table S2 in the Supplemental Data). Data from France12, Germany13, England14, and Italy15 were used to construct a representative western European sample as described below, and data from Turkey were also available.16
Combined Y-SNP plus Y-STR datasets were available from the Arabian Peninsula10, 11 and Turkey16. European data were extracted from the consented Genographic Project Public Participation database (Table S2).
Historical Data
In addition to the contemporary subjects, we needed estimates of the likely genetic composition of the Crusaders. Historical sources17, 18, 19 show that four Crusades reached Lebanon—the first, second, third, and sixth—and that the main populations contributing were the French, Germans, English, and Italians; these sources suggest that the approximate numbers of men participating from the four countries were similar (Table 1). Y haplogroup frequencies are known in each of these modern populations12, 13, 14, 15, so if we assume that haplogroup frequencies were similar at the time of the Crusades, a weighted average western European haplogroup composition can be constructed (Table 2). This needed to be provided as numbers rather than frequencies for the tests described below. We therefore first scaled the total contribution from each country according to the smallest sample (the French12, n = 45) to produce the “weighted total” column in Table 2. We then divided each weighted total by the haplogroup frequency in that country to give a weighted number for each haplogroup from each country. Finally, we calculated the sum of these weighted numbers for each haplogroup and used the closest integer (bottom row in Table 2) in the analyses below.
Table 1
Numbers of Men Contributing to Each of the Crusades that Reached Lebanon According to Historical Sources17, 18, 19
Country	1st Crusade	2nd Crusade	3rd Crusade	6th Crusade	Total	Proportion
French	40,000	15,000	20,000	0	75,000	0.28
German	23,000	15,000	1,000	25,000	64,000	0.24
English	23,000	15,000	30,000	0	68,000	0.26
Italian	59,000	0	0	0	59,000	0.22
Total	145,000	45,000	51,000	25,000	266,000	1.00
Table 2
Construction of a Western European Y Haplogroup Sample Weighted According to the Relative Contribution from Each Country
E3b	G	I	J∗(xJ2)	J2	K2	L	R1b	Other	Total	Weighted total
European Y-Chromosomal Haplogroup Numbers from Previous Studies
French12	2	0	6	-	4	0	0	31	2	45	45
Germans13	75	-a	287	-	49	-	-	473	331	1215	38.4
English14	24	-	163	3	25	-	-	616	45	876	40.8
Italians15	88	75	52	14	140	-	-	280	50	699	35.4
159.6
Weighted Numbers Used
French	2	0	6	0	4	0	0	31	2	45
German	2.4	0	9.1	0	1.5	0	0	14.9	10.5	38.4
English	1.1	0	7.6	0.1	1.2	0	0	28.7	2.1	40.8
Italy	4.5	3.8	2.6	0.7	7.1	0	0	14.2	2.5	35.4
Western European combined	9.9	3.8	25.3	0.8	13.8	0	0	88.8	17.1	159.6
Western European (integer)	10	4	25	1	14	0	0	89	17	160
aRare haplogroup not typed in the relevant study; value set to zero.
Genotyping
Samples were genotyped with a set of 58 Y-chromosomal binary markers by standard methods20 (Figure 2). These markers define 53 haplogroups (including paragroups), 27 of which were present in the Lebanese sample. We also typed a subset (the first 587 individuals collected, and thus with unbiased ascertainment) with 11 Y-STRs by using standard methods21, 22 (Table S1). STR alleles were named according to current recommendations23, except that “389b” was used in place of “DYS389II”; 398b = (DYS389II − DYS389I).
Figure 2
Y-Chromosomal Haplogroups Identified in Lebanese Subpopulations
The phylogenetic tree defined by the markers used is shown on the left, and the haplogroup names are given in the middle. Nomenclature is based on the 2003 YCC tree9, with departures indicated by “/-”. The absolute number of chromosomes within each haplogroup in the entire sample is shown in the “Lebanon” column, and the relative frequency within each of the three religious groups is shown on the right by the relative sizes of the circles.
General Statistical Analyses
Analysis of molecular variance (AMOVA)24, population pairwise genetic distances, and Mantel tests25 were performed with the package Arlequin 3.11.26 Admixture analyses were carried out with Admix2_0.27 Median-joining networks28 were calculated with Network 4.2 (Fluxus-Engineering). Such networks were highly reticulated, and we reduced reticulations by first weighting the loci according to the inverse of their variance in the dataset used29 and subsequently constructing a reduced-median network30 to form the input of the median-joining network. Male effective population sizes were calculated with BATWING31 with a demographic model that assumed a period of constant size followed by exponential growth; prior values were set for other parameters as described previously.20
Computation of Drift Probabilities
We wished to calculate the probability that a haplotype could increase from a deduced initial frequency to an observed current frequency by chance over a period specified by the historical record. In addition, we wished to evaluate the influence that admixture with an outside population might have on this probability. We had detailed data consisting of Y-SNP and Y-STR sets for some relevant groups and relied upon the YHRD database for data from other populations. A number of applications are available for estimating migration rates; these applications account for coalescence, mutation, and migration, including estimates of variation of migration, over a period of time.32, 33, 34, 35, 36, 37, 38 However, none of the packages address the specific question of testing whether drift alone could reasonably account for the emergence of modern levels of haplogroup or haplotype frequencies in the population or how much migration for a specified epoch could affect these rates if the available historical information is incorporated. We have therefore chosen to directly employ a Wright-Fisher model with sampled migration to compute the effects of drift given an admixture event of known duration.
The Wright-Fisher model39, 40 entirely replaces each generation with each succeeding one. The offspring select their parents randomly. The following calculation outlines the Wright-Fisher drift model, describing how the probability of seeing some particular number of members of a population carrying a haplotype will evolve over time. Then it considers the following circumstance: Two populations are evolving according to the Wright-Fisher model and the island model of Haldane41. First, a European population carrying a particular haplotype of interest described below (Western European Specific 1, WES1) experiences drift freely. Over some period of time, some number of this population is selected randomly and travels to Lebanon. Each generation, the children randomly select their parents from the mixed Lebanese and migrant European populations.