|
|
Post by Admin on Feb 8, 2024 18:49:39 GMT
Ancient DNA reveals admixture history and endogamy in the prehistoric Aegean Abstract The Neolithic and Bronze Ages were highly transformative periods for the genetic history of Europe but for the Aegean—a region fundamental to Europe’s prehistory—the biological dimensions of cultural transitions have been elucidated only to a limited extent so far. We have analysed newly generated genome-wide data from 102 ancient individuals from Crete, the Greek mainland and the Aegean Islands, spanning from the Neolithic to the Iron Age. We found that the early farmers from Crete shared the same ancestry as other contemporaneous Neolithic Aegeans. In contrast, the end of the Neolithic period and the following Early Bronze Age were marked by ‘eastern’ gene flow, which was predominantly of Anatolian origin in Crete. Confirming previous findings for additional Central/Eastern European ancestry in the Greek mainland by the Middle Bronze Age, we additionally show that such genetic signatures appeared in Crete gradually from the seventeenth to twelfth centuries BC, a period when the influence of the mainland over the island intensified. Biological and cultural connectedness within the Aegean is also supported by the finding of consanguineous endogamy practiced at high frequencies, unprecedented in the global ancient DNA record. Our results highlight the potential of archaeogenomic approaches in the Aegean for unravelling the interplay of genetic admixture, marital and other cultural practices. Main The Aegean has long been recognized as a region of major importance for understanding transregional societal transformations between Europe and the Near East. Already during the seventh millennium BC, the first farming communities emerged in the Aegean, whereby the earliest evidence was unearthed on the island of Crete—that is, the oldest occupation level below the later palace of Knossos1—but the origins of these populations remain ambiguous. The next major transformation in Aegean prehistory took place during the Early Bronze Age (EBA; about 3100–2000 BC). Complex societies emerged, characterized by sophisticated architecture, metallurgy, sealing systems and the integration of the Aegean in the Bronze Age Eastern Mediterranean networks of exchange. During the late third millennium BC, the Greek mainland witnessed a severe societal breakdown (at the end of Early Helladic II) with lasting impact until the later Middle Helladic period of the early second millennium2,3. This disruption has been attributed to various factors, among them dramatic climatic changes2,4,5 and the arrival of new groups6,7,8. Crete does not seem to have suffered a comparable period of decline9,10. With the emergence of the first palaces during the nineteenth century BC in the Middle Minoan period, the island’s societies transformed into a hitherto unknown sophistication in art, architecture and social practices. Only a few centuries later, during the late Middle Bronze Age (MBA; Middle Helladic for the mainland), the first rich shaft graves of local elites appeared in southern mainland Greece, often displaying Minoan influences11. The competition between rising elites during the Shaft Grave period led to regional conflicts and culminated in the decline of many local dominions on the Greek mainland and possibly a first mainland military expedition to Crete during the fifteenth century12. At the end of this conflict, the palatial period (Late Helladic IIIA-B) started with a few eminent polities centred in Mycenae, Tiryns, Pylos, Athens, Hagios Vasileios in Laconia, Thebes, Orchomenos and Dimini—to name only the most prominent ones13,14,15. During this time, the influence on Crete by mainland centres intensified and Cretan resources were systematically exploited with the help of turning key palatial centres and cities like Knossos, Hagia Triada and Chania into outposts for the administration of large parts of the island16. So far, past human migrations in the Aegean were primarily reconstructed on the basis of archaeological and textual evidence but bioarchaeological studies have been adding new information during recent decades17,18,19,20,21,22. Biomolecular approaches based on ancient DNA (aDNA) have been introduced in prehistoric Aegean research during the last decade. The first aDNA study analysed mitochondrial genomes23, emphasizing autochthonous developments rather than migration from outside Crete. Subsequent studies generated nuclear aDNA data and showed a common gene pool for the Aegean Neolithic populations, indicating that the southern Greek mainland differed from the northern in its higher genetic affinity to early Holocene populations from the Iran/Caucasus24,25. Others reported the presence of this ‘eastern’ (Iran/Caucasus-associated) genetic component in both Bronze Age (BA) Cretan (Minoan) and southern Greek mainland (Mycenaean) populations26. However, the last carried additional ancestry linked to the Western Eurasian Steppe herders (WES)27,28 or Armenia. Recently, Clemente and colleagues expanded the sampling scope of the BA Aegean to the northern mainland and the Aegean Islands corroborating the previous findings but also reporting higher WES-related ancestry in MBA individuals from northern Greece29. Recent archaeogenetic studies outside the Aegean have engaged into integrating biological information as elements of the past social organization and structures30,31,32,33, whereby it is necessary to acknowledge that relational identities are not determined only through biological kinship34. Most approaches to past kinship in the Aegean were based on morphometric and non-metric analyses17,19,35 and first PCR-based studies were unsuccessful36. However, the potential of this line of evidence from the Aegean BA is outstanding due to the richness of collective burials as an expression and constitution of social belonging within local communities37. www.nature.com/articles/s41559-022-01952-3Results |
|
|
|
Post by Admin on Feb 9, 2024 19:46:17 GMT
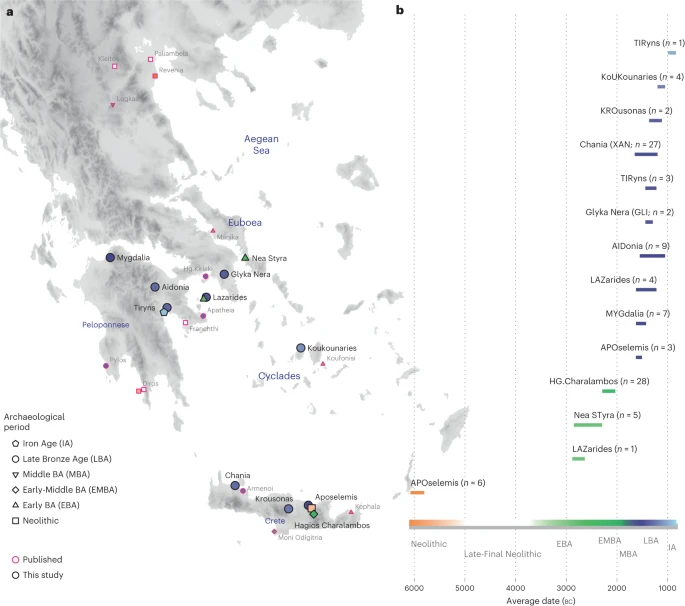
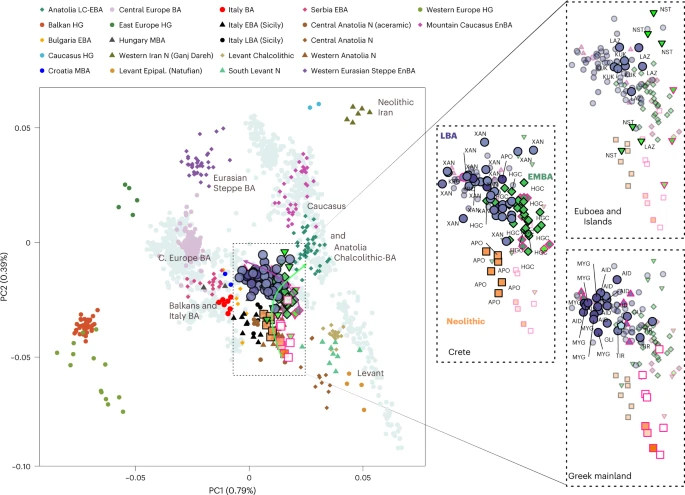
The archaeogenetic dataset Here, we generated new genome-wide data from 102 prehistoric individuals from Aegean Neolithic (n = 6), BA (n = 95), as well as Iron Age contexts (IA; n = 1) (Fig. 1 and Supplementary Note 1), thereby achieving a fourfold increase in sample size from previously published datasets. This sample, owing to the geographical and temporal distribution, enables us to address complex features of admixture history and other biological aspects interwoven into these prehistoric societies (for example, marital practices). Nea Styra on the island of Euboea and Lazarides on the island of Aegina add to the post-Neolithic sites included that date to the time before the debated disruption around 2200 BC (the end of Early Helladic II on the Greek mainland). The remaining individuals from the mainland and the islands are attributed to the Mycenaean culture of the Late Bronze Age (LBA) (Aidonia, Glyka Nera, Lazarides, Koukounaries, Mygdalia and Tiryns). Most of the data come from Crete (66 of 102 individuals), in a time transect that covers early phases of the Neolithic (Aposelemis; late seventh to early sixth millennia BC) and the BA (Hagios Charalambos—Early-Middle Minoan; Chania, Aposelemis and Krousonas—Late Minoan). With the exception of Aposelemis and XAN035 from Chania (about 1700–1450 BC), all other Late Minoan individuals date between about 1400 and 1100 BC (LMII–III). All the analysed skeletal remains from Nea Styra, Mygdalia, BA Aposelemis, Krousonas, Aidonia and Hagios Charalambos belonged to the same within-site collective burial context; for the latter, Yersinia pestis and Salmonella enterica were also recently detected38. Extracted aDNA was immortalized into genomic libraries, part of which were enriched for 1,233,013 ancestry-informative single nucleotide polymorphisms (SNPs) (1240K) (Methods) and sequencing data were evaluated for aDNA preservation and contamination (Supplementary Tables 1 and 2). In our inferences for the Aegean individuals, we re-appraised all previously published contemporaneous individuals from this area24,25,26,29 (Fig. 1). We also radiocarbon dated 43 of the skeletal remains that yielded genome-wide data (Supplementary Table 3; Methods). Fig. 1: Location and dates of individuals with newly generated aDNA data.  a, Geographical distribution of archaeological sites mentioned in the study annotated by period. Sites with smaller symbols of light outline refer to the published datasets that are co-analysed and follow the same symbol/colour scheme. Data obtained from the same site but different periods, are annotated with jittering points. b, The number of individuals analysed and their date range based on archaeological chronology or radiocarbon dating. Site names are abbreviated in three-letter capitalized identifiers as indicated in the labels. E, Early; M, Middle; L, Late. See also Supplementary Tables 2 and 3. Transregional genetic entanglements of Aegean populations To visualize genetic ancestry variation, we first performed a principal component analysis (PCA) on modern West Eurasian populations and projected onto the first two PCs the ancient individuals from the Aegean and nearby regions (Fig. 2). The six individuals from Neolithic Aposelemis cluster with other early European and Anatolian/Aegean farmers, suggesting that the gene pool of Neolithic Crete was linked to the broader Aegean during that period. After around two millennia, the EBA and MBA individuals show a substantial change in their PC coordinates, shifted along PC2 towards Early Holocene Iran/Caucasus and the descending Chalcolithic and BA Anatolians/ BA Caucasians. This shift does not seem uniform, as the five individuals from Nea Styra, who were buried together in the same shaft grave, show substantial genetic variation. Finally, the LBA individuals deviate from these earlier BA individuals towards BA Central and Eastern Europe, suggesting multiphased genetic shifts in the Aegean since the Neolithic. |
|
|
|
Post by Admin on Feb 10, 2024 19:35:35 GMT
Transregional genetic entanglements of Aegean populations To visualize genetic ancestry variation, we first performed a principal component analysis (PCA) on modern West Eurasian populations and projected onto the first two PCs the ancient individuals from the Aegean and nearby regions (Fig. 2). The six individuals from Neolithic Aposelemis cluster with other early European and Anatolian/Aegean farmers, suggesting that the gene pool of Neolithic Crete was linked to the broader Aegean during that period. After around two millennia, the EBA and MBA individuals show a substantial change in their PC coordinates, shifted along PC2 towards Early Holocene Iran/Caucasus and the descending Chalcolithic and BA Anatolians/ BA Caucasians. This shift does not seem uniform, as the five individuals from Nea Styra, who were buried together in the same shaft grave, show substantial genetic variation. Finally, the LBA individuals deviate from these earlier BA individuals towards BA Central and Eastern Europe, suggesting multiphased genetic shifts in the Aegean since the Neolithic. Fig. 2: West Eurasian PCA (grey background points) with projection of ancient Aegean and other ancient relevant populations (coloured points).  To formally test whether the remarks from the PCA are consistent with diachronic gene-flow events, we used f-statistics of the form f4 (Mbuti, Test; Anatolian farmers, Aegean) (Methods; Supplementary Note 2) that contrast the various Aegean groups with the Anatolian farmers east of the Aegean (Supplementary Table 4). Affinities with far-eastern groups like Neolithic Iran are traced for Neolithic Aposelemis (or APO004) but only reach significance levels (≥3 s.e. or Z ≥ 3) on the EBA group from Nea Styra and then prevail for most of the later Aegean BA groups. However, the LBA ones additionally share alleles with contemporaneous or earlier (Mesolithic) populations from Central and Eastern Europe (for example, Eastern European hunter-gatherers: EEHG, Germany ‘Corded_Ware’, ‘Russia_Samara_EBA_Yamnaya’ and ‘Russia_North_Caucasus’). In addition, evidence of admixture from these groups was confirmed with admixture f3 test (Supplementary Table 5 and Supplementary Note 2). |
|
|
|
Post by Admin on Feb 11, 2024 20:20:37 GMT
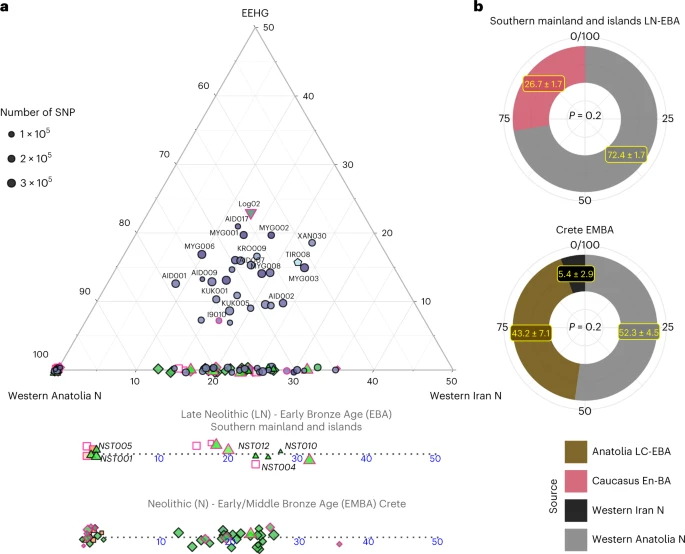
Neolithic to Early/Middle Bronze Age Informed by the f-statistics, we explored formal admixture models using the software qpAdm (Methods; Supplementary Note 2). First, we tested a no-admixture model, which treated every individual as a sister group of Neolithic western Anatolia (‘W. Anatolia_N’) and then models by adding sequentially Neolithic Iran (‘W. Iran N’) and EEHG (Fig. 3). Substantial EEHG coefficients were fitted only on LBA and the two MBA individuals from the northern mainland ranging from around 5% to 25%, which explains why for some of them the simpler Anatolia + Iran Neolithic model was also adequate. Notably, Iran/Caucasus-related genetic influx was inferred in published individuals from the later Neolithic phases on the mainland (I2318, I709 and I3920; Peloponnese, around the fifth millenium BC)—but not earlier—as well as most of the EBA individuals from Euboea, Aegina and Koufonisia. Overall, the genetic heterogeneity among the Late Neolithic (LN) to EBA is not correlated with time alone, since within the Nea Styra grave male individuals carried substantially varying proportions of Iranian-related ancestry. By applying DATES on the LN and EBA individuals from the mainland and the islands (Methods), we obtained an average admixture date of around 4300 ± 250 BC (Supplementary Table 6), which is slightly younger when estimated from the Nea Styra individuals alone (about 3900 ± 460 BC). This variance in admixture dates also corroborates ongoing biological admixing with incoming individuals from the east of the Aegean following the establishment of the first Neolithic Aegean communities. Fig. 3: Admixture modelling with qpAdm per individual and group.  a, Ternary plot for a three-way admixture model of Aegean individuals using the distal sources of ceramic farmers from Western Anatolia, Western Iranian farmers from Ganj Dareh and the EEHG, all dating to about 6000 BC. Because qpAdm is based on allele frequency differences, modelling of individual targets has a lower resolution especially when the SNP coverage is low. A few of the Late-Final Neolithic (LN) and EBA individuals show additional ancestry related to Neolithic Western Iran. To better visualize the fluctuation or Iranian-like coefficients among the LN-E/MBA individuals, the Anatolian–Iranian axis is also provided separately for Crete and the mainland islands. Fitting models were chosen with a cutoff of P ≥ 0.01, with only four individuals falling in the lower range (0.01 ≤ P < 0.05). b, Allele frequencies are averaged among all LN-EBA individuals from the southern mainland and all EMBA Cretan individuals and modelled using proximal in time and space source populations. For the former, a source proxy from the Eneolithic/BA Caucasus fits better than Anatolia, whereas the opposite holds for Crete. However, for the latter, the model becomes adequate with the inclusion of additional low contribution from Neolithic Iran. P values and standard errors of mean were calculated by the qpAdm program applying a likelihood ratio test and the 5 cM block jackknifing method, respectively. No correction for multiple testing has been made. See also Extended Data Fig. 1 and Supplementary Tables 4–7. We further evaluated genetic heterogeneity with cladality tests using qpWave (Extended Data Fig. 1). Our results confirmed that various pairs within EBA Euboea, Aegina and Koufonisia were not cladal to each other with respect to a set of reference populations (model P < 0.05), highlighting substantial genetic variation among coeval groups. In stark contrast, in Early Middle Bronze Age (EMBA) Crete the rate of non-cladal pairs (25 of 741) was the one expected for true models of cladal pairs to be rejected with a cutoff of 5% given a uniform distribution of the P values. To increase the resolution of admixture inferences, we repeated qpAdm in groups of individuals ‘Crete Aposelemis N’ (n = 6), ‘S. Mainland-Islands LN-EBA’ (n = 13) and ‘Crete EMBA’ (n = 29) following a ‘competing’ approach described in previous studies (Methods and Supplementary Information 2). For Aposelemis, the one-way model from Neolithic western Anatolia was adequate when aceramic farmers from central Anatolia (Boncuklu site) were included in the reference populations but the one-way model with the latter as a source failed even without adding western Neolithic Anatolia to the references (P = 9.32 × 10⁻⁵) (Supplementary Note 2). Subsequently, we modelled the differences of the two descending ‘S. Mainland LN-EBA’ and ‘Crete EMBA’ groups from the earlier Aegean farmers with two-way models from these local farmers and various southwest Asian populations (Supplementary Table 7). Most of the two-way models including Neolithic Aposelemis were not rejected, indicating a decreased resolution owing to the low SNP coverage and small group size of Aposelemis. On the contrary, when models included ‘W. Anatolia N’ as a local source instead, only the one with an additional 28% contribution from the Eneolithic/BA Southern Caucasus was feasible for ‘S. Mainland-Islands LN-EBA’ (Fig. 3b). Accordingly, for ‘Crete EMBA’, the additional ancestry was better modelled with Late Chalcolithic/Early Bronze Age (LC-EBA) Anatolia (highest P = 4.9 × 10⁻³); however this model only became adequate as a three-way with an additional minute component (5%) from ‘W. Iran N’ (Fig. 3b). |
|
|
|
Post by Admin on Feb 13, 2024 21:00:26 GMT
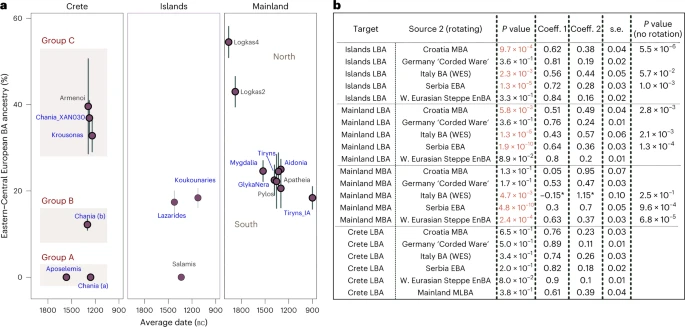
Mobility in the Middle/Late Bronze Age Aegean For the LBA groups and the IA individual, we explored models of mixture from the corresponding ascending group (‘S. Mainland-Islands LN-EBA’ and ‘Crete EMBA’) and several European populations dated between around 3500 and 1000 BC (Supplementary Table 8). Informed by the previous analyses, we restricted the possible second sources to populations such as the EBA herders from the Pontic-Caspian Steppe (here grouped under ‘W. Eurasian Steppe En-BA’ and typically representing WES) and those shown to share a close genetic affinity with them. We first tested these models on ‘Site_Period’ groups, only if the cladality test (qpWave) agreed with grouping them as a homogeneous cluster (Supplementary Figs. 1 and 3a). Within the larger group from Chania, departures from cladality (P « 0.05) were more frequent (~10%) and were predominantly driven from specific individuals lying at the two ends of the EBA-LBA cline in the PCA (Extended Data Fig. 2b). To explore how these reflect significant differences in the admixture modelling, we analysed the group from Chania into the following three subgroups: ‘Chania LBA (XAN030)’, ‘Chania LBA (a)’ (XAN014, XAN028, XAN034) and ‘Chania LBA (b)’ (all the others) (Supplementary Table 8). We found various sources ranging from East Europe, to Central and South Europe adequately fitting most models for the LBA Aegean groups. The smaller and heterogeneous sample of BA Bulgarian individuals or BA Sicily did not fit. Models with Serbia (EBA), Croatia (MBA) and Italy (EMBA) were adequate most of the time, while those with ‘W. Eurasian Steppe En-BA’ (En, Eneolithic) or some Central European source (for example, Germany LN-EBA ‘Corded Ware’) were adequate for all groups at the P ≥ 0.01 cutoff. Therefore, at the moment it is not possible to more closely identify the region(s) from where this genetic affinity was derived. Among the groups of the southern mainland, the estimated coefficients of the WES-related ancestry are overlapping (±1 s.e.) and average to 22.3% (Fig. 4a) but were substantially lower than for Logkas in the northern mainland (43–55% ± 4%). No significant differences were noted for IA Tiryns (±1 s.e.), indicating—albeit with limited evidence—genetic continuity after the end of the BA at least for this site. Similar coefficient ranges as in the southern mainland are observed for the nearby islands and the Cyclades, although the model for the one individual from Salamis shows no WES-related ancestry. In sharp contrast, in Crete, WES-related coefficients vary from 0% to about 40% clustering in three groups with significantly different coefficients. Among the individuals with minimal/no WES ancestry are the earliest, dating to the late seventeenth or sixteenth century BC Aposelemis, whereas the youngest (Krousonas, Armenoi; twelfth century BC) harbour some of the highest amounts. However, within the ancient city of Chania, individuals spanning a short period of about three centuries display the entire range, a pattern consistent with an early phase of mixing between divergent populations. Fig. 4: Proximal two-way qpAdm models for the MLBA groups.  a, Estimated mean coefficient (coeff.) (±1 s.e.) of additional ancestry (WES-related) using as proxy a BA Central European population (‘Germany LN-EBA Corded Ware’). For every group we assumed local ancestry in the models using the ascending population from the corresponding area (that is, EMBA Crete, LN-EBA southern Greek mainland and islands or LN northern mainland (for Logkas). Newly reported LBA groups are annotated in blue letters. Before we applied the modelling on every ‘Site_Period’ group, we performed a test of cladality among all individuals which suggested substructure within the LBA site of Chania in Crete and resulted in three analysis groups. Overall, individuals from LBA Crete are distributed in three groups of non-overlapping WES-related ancestry estimations (A, B and C). Models are supported with P ≥ 0.05, with the exception of Tiryns_IA and Pylos with P = 0.02 and 0.04, respectively. b, Modelling results using the approach of rotating competing sources 2 in the right populations set (R11) (Supplementary Note 2) for Crete, the mainland and the islands. Low P values (<0.01) indicate poor fit of the tested model and are annotated in red. For these models, the P values are compared with the model fit without rotation of the sources. The gradual shift in Crete can be explained with admixture from the mainland but other proximal sources fit equally well. P values and standard errors of mean were calculated by the qpAdm program applying a likelihood ratio test and the 5 cM block jackknifing method, respectively. No correction for multiple testing has been made. See also Extended Data Fig. 2 and Supplementary Tables 8 and 9. To better understand these remarkable ancestry patterns in LBA Crete, we tested competing admixture models by interchanging the candidate second sources in which we now included ‘Mainland MLBA’ that consisted of all the individuals from the third panel of Fig. 4a (both southern and northern). For a comparison, we also tested the same models on the grouped targets ‘Islands LBA’ (Euboea, Aegina, Salamis and Cyclades), ‘S. Mainland’ and ‘N. Mainland’—being aware that such artificial subdivisions of landscapes might not reflect past categorizations. The results are summarized in Fig. 4b. Interchanging the sources resulted in the rejection of some previously adequate sources (for example, ‘Italy BA’ for ‘Islands LBA’). Overall, proximal sources like EBA Serbia, MBA Croatia and BA Italy failed to model both mainland and island groups (P ≤ 5.80 × 10⁻³), whereas models with Central or Eastern European sources remained adequate. However, two-way models with all of the above sources as well as ‘Mainland MLBA’ fit the allele frequencies of all the LBA individuals from Crete (‘Crete LBA’). This also applied when we modelled the two clusters from LBA Crete separately (Fig. 4a and Supplementary Table 9) but for the Crete LBA (group C) with high WES ancestry (individuals XAN030, KRO008, KRO009 and published Armenoi), just one source from ‘Mainland MLBA’ became adequate. |
|


