

Post by Admin on Jul 14, 2022 20:33:28 GMT
Local patterns of isolation and genetic differentiation within Southern Italy
With the aim of directly exploring local patterns of genetic differentiation, we focused more specifically on the genetic structure observed within Southern Italy. Consistently with the global analysis, the PCA applied exclusively on our Southern Italian “local” dataset replicates the distinctiveness observed for the Aspromonte group (Suppl. Figure S5a). Most of the populations from that area indeed depart from the rest of Southern Italy along the first PC, by forming a scattered pattern in which the communities that still preserve the Greco language appear as the most differentiated (i.e. occupying more peripheral positions in the PCA plot). Similarly, ADMIXTURE results for the best value of K = 2 (Suppl. Figure S5b) identify an ancestral genetic component which is maximized in almost all the current Greco-speaking communities (100% Roghudi and Gallicianò, 88% Roccaforte Del Greco, 73% Condofuri) and accounts for 30–60% of ancestry also in the core of the other communities from the same Aspromonte group.
To formally test signals of isolation and drift, we analyzed patterns of within-population genetic variation by calculating the inbreeding coefficient (Fin) and the genome-wide homozygosity (Fhom) indexes, and by analyzing the number and the extension of genomic runs of homozygosity (ROH). Both Fin and Fhom values are averagely higher for the populations from the Aspromonte area compared to the rest of Southern Italy (Suppl. Table S3), and accordingly the distribution of genome-wide homozygosity (Fhom) shows higher variance in inbreeding for the Aspromonte group than for the other Southern Italian populations (Fig. 3a), thus reflecting higher isolation patterns differentiating these communities. Similarly, a much higher number (NSEG) and length (KB) of ROH has been observed on average for the Aspromonte samples from Reggio Calabria, with respect to the tendency to lower number and length of homozygous segments exhibited by the other Southern Italian populations (Fig. 3b).
Figure 3
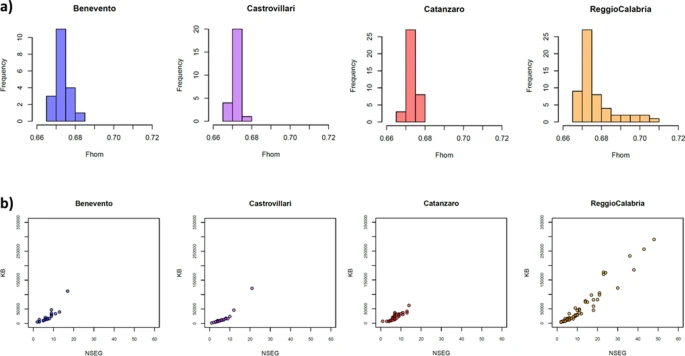
Intra-population patterns of genetic variation in the newly analyzed Southern Italian populations. (a) Distribution of genome-wide homozygosity index Fhom and (b) total length of ROHs (KB) plotted against number of ROHs (NSEG). Color-code as follow: Benevento (blue), Castrovillari (purple), Catanzaro (magenta) and Aspromonte area of Reggio Calabria (orange).
Since levels of isolation correlate also with the degree of relatedness between and within groups46, we further estimated the extent of genome shared identically by descent (IBD) at different classes of length using the fastIBD pipeline implemented in the BEAGLE software. Overall, patterns of genetic relatedness across populations reveal higher within-population compared to between-population sharing for longer bin classes. In particular, for bins ≥ 27 cM almost all the connections are within-population and the few links between-populations appear almost exclusively limited to the communities belonging to the ASPR cluster, consistently with these groups being more closely related to each other. For shorter classes of length among-population connections then extend to all the rest of Southern Italy (Suppl. Figure S6).
To further explore signals of genetic drift and population differentiation and to link this peculiar genetic background with biological functions, we finally used the Southern Italian genetic clusters identified by FineSTRUCTURE to detect loci that may have drifted up in frequency in the isolated Aspromonte group. In particular, we compared the allele frequencies of all variants within the populations belonging to the ASPR cluster against their respective frequencies in the rest of South Italy. More precisely, as suggested by FineSTRUCTURE results (Fig. 2c, Suppl. Figure S3), we considered both the Benevento + Castrovillari (BN + CS) cluster and the one grouping individuals from Catanzaro (CZ) as representative of the “not-isolated” Southern Italian background. We then computed pairwise FST values between the above-mentioned three clusters (i.e. ASPR, CZ and BN + CS) for all the 621,755 SNPs included in our “local” dataset. Finally, we retained the 797 loci scoring in the top 1% of FST distribution in both ASPR vs. CZ and ASPR vs. BN + CS comparisons (Suppl. Figure S7, Suppl. Table S4). Enrichment analysis on the list of corresponding top genes (Suppl. Table S5) shows that the most significantly enriched Gene Ontology (GO) terms are associated with processes of “nervous system development” and with “neuron part”, “cell periphery” and “plasma membrane” of the cellular components (Suppl. Table S6).
With the aim of directly exploring local patterns of genetic differentiation, we focused more specifically on the genetic structure observed within Southern Italy. Consistently with the global analysis, the PCA applied exclusively on our Southern Italian “local” dataset replicates the distinctiveness observed for the Aspromonte group (Suppl. Figure S5a). Most of the populations from that area indeed depart from the rest of Southern Italy along the first PC, by forming a scattered pattern in which the communities that still preserve the Greco language appear as the most differentiated (i.e. occupying more peripheral positions in the PCA plot). Similarly, ADMIXTURE results for the best value of K = 2 (Suppl. Figure S5b) identify an ancestral genetic component which is maximized in almost all the current Greco-speaking communities (100% Roghudi and Gallicianò, 88% Roccaforte Del Greco, 73% Condofuri) and accounts for 30–60% of ancestry also in the core of the other communities from the same Aspromonte group.
To formally test signals of isolation and drift, we analyzed patterns of within-population genetic variation by calculating the inbreeding coefficient (Fin) and the genome-wide homozygosity (Fhom) indexes, and by analyzing the number and the extension of genomic runs of homozygosity (ROH). Both Fin and Fhom values are averagely higher for the populations from the Aspromonte area compared to the rest of Southern Italy (Suppl. Table S3), and accordingly the distribution of genome-wide homozygosity (Fhom) shows higher variance in inbreeding for the Aspromonte group than for the other Southern Italian populations (Fig. 3a), thus reflecting higher isolation patterns differentiating these communities. Similarly, a much higher number (NSEG) and length (KB) of ROH has been observed on average for the Aspromonte samples from Reggio Calabria, with respect to the tendency to lower number and length of homozygous segments exhibited by the other Southern Italian populations (Fig. 3b).
Figure 3
Intra-population patterns of genetic variation in the newly analyzed Southern Italian populations. (a) Distribution of genome-wide homozygosity index Fhom and (b) total length of ROHs (KB) plotted against number of ROHs (NSEG). Color-code as follow: Benevento (blue), Castrovillari (purple), Catanzaro (magenta) and Aspromonte area of Reggio Calabria (orange).
Since levels of isolation correlate also with the degree of relatedness between and within groups46, we further estimated the extent of genome shared identically by descent (IBD) at different classes of length using the fastIBD pipeline implemented in the BEAGLE software. Overall, patterns of genetic relatedness across populations reveal higher within-population compared to between-population sharing for longer bin classes. In particular, for bins ≥ 27 cM almost all the connections are within-population and the few links between-populations appear almost exclusively limited to the communities belonging to the ASPR cluster, consistently with these groups being more closely related to each other. For shorter classes of length among-population connections then extend to all the rest of Southern Italy (Suppl. Figure S6).
To further explore signals of genetic drift and population differentiation and to link this peculiar genetic background with biological functions, we finally used the Southern Italian genetic clusters identified by FineSTRUCTURE to detect loci that may have drifted up in frequency in the isolated Aspromonte group. In particular, we compared the allele frequencies of all variants within the populations belonging to the ASPR cluster against their respective frequencies in the rest of South Italy. More precisely, as suggested by FineSTRUCTURE results (Fig. 2c, Suppl. Figure S3), we considered both the Benevento + Castrovillari (BN + CS) cluster and the one grouping individuals from Catanzaro (CZ) as representative of the “not-isolated” Southern Italian background. We then computed pairwise FST values between the above-mentioned three clusters (i.e. ASPR, CZ and BN + CS) for all the 621,755 SNPs included in our “local” dataset. Finally, we retained the 797 loci scoring in the top 1% of FST distribution in both ASPR vs. CZ and ASPR vs. BN + CS comparisons (Suppl. Figure S7, Suppl. Table S4). Enrichment analysis on the list of corresponding top genes (Suppl. Table S5) shows that the most significantly enriched Gene Ontology (GO) terms are associated with processes of “nervous system development” and with “neuron part”, “cell periphery” and “plasma membrane” of the cellular components (Suppl. Table S6).

 Maria d'Anglona, and Passo di Giacobbe. These sites share a distinct indigenous cultural package, defined by specific grave good assemblages, flexed burial positions, and gender-specific burial orientations. Moreover, our dataset includes skeletons from three Greek colonies: Metapontion, Siris, and Taras. According to ancient written sources, the colonies were founded in the course of the late eighth to sixth centuries BC by Greek settlers from Achaia, Ionia, and Laconia (Strabo, n.d., p. 6.1.14, 6.1.15, 6.3.2). The early colonies gradually grew into full-fledged urban centers, amassed a great amount of wealth owing to the region's fertile farmland, and erected temples and monumental public buildings.