|
|
Post by Admin on Jan 16, 2020 18:52:34 GMT
 Figure 2 Principal component analysis of modern and ancient West Eurasians British and additional ancient samples are projected onto the reference space computed on present-day West Eurasian populations. See Methods for computational details and Supplementary Table 1 for information on the samples. PC, principal component. Site Abbreviations: Tisz. Doma., Tiszaszőlős-Domaháza; B.-au-Bac, Berry-au-Bac; C.-l.-Chau., Cuiry-les-Chaudardes; Falk., Falkensteiner Höhle; Vies. Hof, Viesenhauser Hof; Unterw., Unterwechsel; Halb.-Son., Halberstadt-Sonntagsfeld; Ber.-Moro., Berettyóújfalu-Morotva-liget; Polg.-Fer., Polgár-Ferenci-hát; Debr.-Tócó., Debrecen Tócópart Erdoalja; Komp.-Kig., Kompolt-Kigyósér; Apc-Berek., Apc-Berekalja I.; Salz.-Sch., Salzmuende-Schiebzig. Region: Brit-I, British Isles; C.-Eur., Central European; CH, Switzerland; ES, Spain; FR, France; GER, Germany; GR, Greece; HUN, Hungary; IRL, Ireland; IT, Italy; LU, Luxembourg; SW, Sweden; TR, Turkey. Plei., Pleistocene; H.-G., hunter-gatherer; Vil., Villabruna Cluster. Cultural Horizon: KÖR, Körös; EN, MN and LN, Early, Middle and Late Neolithic, respectively; M, Mesolithic; N, Neolithic; PWC, Pitted Ware Culture; LBK, Linearbandkeramik. To investigate the proportions of Aegean farmer-related ancestry in the British samples we modelled them as mixtures of ANFs and European WHGs using the qpAdm method, which studies ensembles of f4 statistics (Figure 3, Supplementary Figure S8)24. The genomes of all British Mesolithic individuals can be explained almost entirely by WHG ancestry, the remainder (<7.3%) likely stemming from poorly matching portions of the genome. Most of the ancestry in all British Neolithic individuals could be attributed to ANFs (>56%, ~74% on average), indicating a substantial shift in ancestry with the transition to farming. To investigate the proximate source of ANF ancestry in British Neolithic individuals, we examined affinities with Early Neolithic individuals from Iberia and Central Europe. We compare Early over Middle Neolithic individuals as the latter are contemporary with the British Early Neolithic, making them an unlikely direct source. For all British Neolithic individuals considered we inferred more shared drift with Early Neolithic Iberians (Figure 4A, Supplementary Figure S9). However, these f4 statistic-based inferences may be sensitive to levels of WHG admixture, such that the similarity in WHG admixture proportions in Early Neolithic Iberian and British samples, but lower estimates in Central European Early Neolithic individuals, is driving the inference of an Iberian rather than Central European source for Early British farmers. To examine this possibility in more detail we performed a more powerful haplotype-based analysis.  Figure 3 WHG and ANF ancestry components of British and Central European Neolithic populations Relative WHG and ANF ancestry in Early and Middle Neolithic British and continental European populations quantified by qpAdm. Percentages indicate error estimates computed by block jack-knifing with a block size of 5 centimorgans (cM) (ref. ²⁴). See Methods for computational details and Supplementary Table 1 for lists of samples grouped into WHG and the different Neolithic populations. Neo., Neolithic; SouthE, South-East; SouthW, South-West.  Figure 4 Affinities of British and continental Neolithic populations Top, We computed f-statistics of the form f4 (Khomani, test; Central European EN, Iberia EN) for different British EN, MN and LN and continental MN populations to compare shared drift to Central European EN and Iberian EN populations. A positive Z-score > 2 corresponds to a significant affinity to the Iberian EN over Central European EN population. Bottom, Quantification of excess WHG ancestry in British EN compared to the Iberian EN population. We computed qpAdm estimates of WHG and Anatolian and Iberian ANF populations in EN samples from Wales, England and Scotland. See Supplementary Table 1 for lists of samples grouped into WHG and the different Neolithic populations. The three white bars and the coloured boxes indicate how the bars below them are derived. Percentages and bars indicate error estimates computed by block jack-knifing with a block size of 5 cM (ref. ²⁴). Using a chromosome painting approach25 we obtained patterns of haplotype matching between our high coverage British Neolithic sample and a global modern reference panel (Supplementary Materials Section 7). We found similar patterns of donor haplotype matching in the British Neolithic genome to those inferred for other high coverage Neolithic genomes from Ireland and Iberia. These were more similar than the same profiles obtained for high coverage Neolithic genomes from Central Europe (Figure 5a). Inferred ancestry coefficients (see Materials and Methods) further support this connection between the British, Irish and Iberian Neolithic6 and are consistent with the same ancestral populations bringing the Neolithic to Britain and Ireland (Figure 5b,c, Supplementary Table S8). Additional modelling using global modern populations26 as ancestry surrogates suggests this population is best represented today by components found in French and Spanish peoples (Figure 5c, Supplementary Table S9). |
|
|
|
Post by Admin on Jan 16, 2020 22:05:05 GMT
In order to test for a potential second ANF ancestry stream from Central Europe, we explicitly modelled WHG and Early Neolithic populations in qpGraph (see Supplementary Fig. S23 and Supplementary Table S10). The results suggest that the limited Central European Neolithic admixture we find in British Neolithic populations is regionally structured, with populations from England showing the highest levels of admixture, followed by populations from Scotland. We infer no Central European admixture in Neolithic farmers from Wales. However, we caution that the model fits are poor and so these inferences should be considered preliminary. In the version of this Article originally published, there were errors in the colour ordering of the legend in Fig. 5b, and in the positions of the target and surrogate populations in Fig. 5c. This has now been corrected. The conclusions of the study are in no way affected. The errors have been corrected in the HTML and PDF versions of the article. 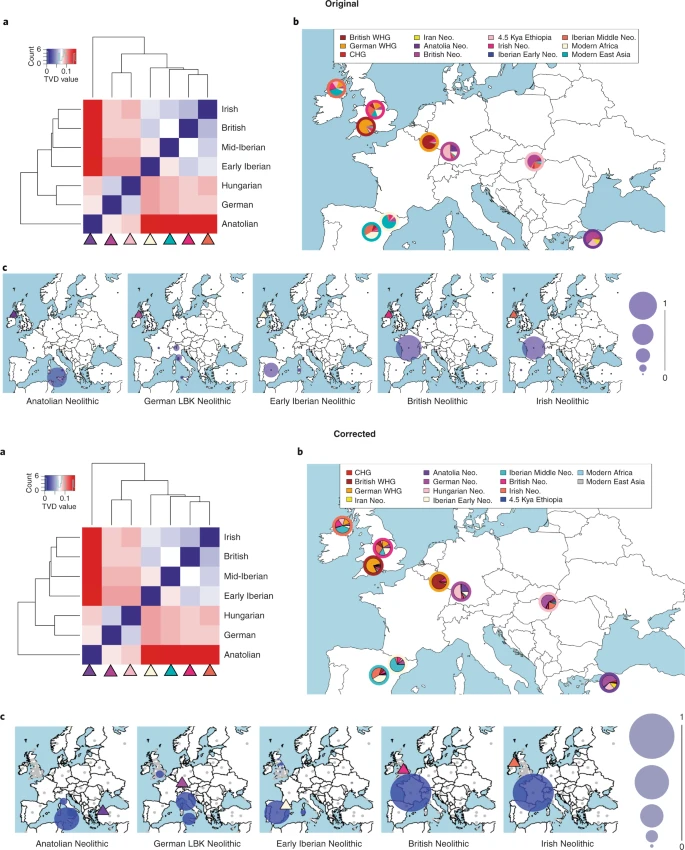 Fig. 5 We inferred some significant geographic structure in WHG admixture proportions among the British Early Neolithic individuals (see Supplementary Table S4 for statistical comparison of inferred WHG admixture proportions); those from Wales retain the lowest levels of WHG admixture, followed by those from South-West and Central England. Neolithic individuals from South-East England and Scotland show significantly higher WHG admixture proportions. These proportions remain stable from the Early into the Middle/Late Neolithic. To infer levels of WHG introgression occurring between Iberian Early Neolithic populations and early British farmers, we estimated admixture proportions using qpAdm24. We detected little excess (~10%) WHG ancestry beyond that already present in Iberian Early Neolithic individuals, supporting little or no additional admixture with British hunter-gatherers, particularly in Wales, South-West and Central England (Figures 3 and and4B;4B; Supplementary Table S4). This result appears to be slightly at odds with the f4 results presented in Supplementary Figure S7, which indicate that some British Neolithic samples share genetic affinities with Cheddar Man over Loschbour, although it is difficult to say in these cases whether this is due to genuine substantial admixture with British WHGs or with other WHGs in northern Europe. We regressed individual WHG ancestry proportions in British Neolithic farmers (shown in Supplementary Figure S8) against latitude and longitude and found a significant positive southwest to northeast cline (Supplementary Figure S15). To further explore WHG introgression in Britain we applied ALDER27 to pairs of Early Neolithic regional samples to estimate the timing of WHG/ANF admixture events (Supplementary Table S3). Only Early Neolithic farmers from western Scotland show evidence of WHG introgression within 10 generations. Two individuals from Raschoille Cave had estimated introgression events occurring 4.0±3.4 generations before they lived, which is sufficiently recent in their past that it likely occurred in Britain. The elevated levels of WHG ancestry we see in Neolithic samples from South East England are older, and therefore probably a result of farmer-forager interactions in mainland Europe. Chronological modelling (using OxCal 4.328) of available direct Early Neolithic radiocarbon data from individuals showing ANF ancestry suggests that continental farmers arrive in Britain by 3975-3722 cal. BCE (95% confidence), 481 years after to 27 years before (95% confidence) the death of our latest Mesolithic individual showing no ANF ancestry (Supplementary Materials Section 6). Our model suggests that continental farmers arrive marginally earlier in the west (although see the discussion in the Supplementary Materials), and rapidly disperse into other regions of Britain (including the Orkney Islands). The latest regional appearance of ANF ancestry is in Central England and occurs 59 to 386 years (95% confidence) after it first appears in Britain. To explore variation in pigmentation of European populations, we predicted pigmentation in higher-coverage Mesolithic and Neolithic Europeans using HIrisplex-S29. We infer that Cheddar Man mostly likely had blue/green eyes, dark brown possibly black hair, and dark or dark to black skin, while our highest coverage early Neolithic individual had brown eyes, black possibly dark brown hair, and dark to intermediate skin (see Supplementary Materials Section 3). Together with the pigmentation prediction outcomes we obtained for Loschbour and La Braña, these results imply that different pigmentation levels coexisted in Europe by around ca.6000 BCE. |
|
|
|
Post by Admin on Jan 17, 2020 2:51:58 GMT
Discussion
The six British Mesolithic genomes examined here are typical of WHGs, indicating that this population spread to the furthest northwestern point of early Holocene Europe after moving from southeastern Europe, or further east, from approximately 12,000 BCE17. This genetic similarity among British and European Mesolithic individuals spans a period in Britain (ca. 8,500-4,000 BCE) that includes the cultural transition to the Late Mesolithic and the separation of Britain from continental Europe. Our analyses indicate that the appearance of Neolithic practices and domesticates in Britain ca. 4,000 BCE was mediated overwhelmingly by immigration of farmers from continental Europe1–2, and strongly reject the hypothesised adoption of farming by indigenous hunter-gatherers as the main process3. British farmers were substantially descended from Iberian Neolithic-related populations whose ancestors had expanded along a Mediterranean route6, 11, although with a minority portion of their ancestry from populations who took the Danubian route12. The affinities we find between Neolithic individuals from the British Isles and modern individuals from France are consistent with populations sharing ancestry with Neolithic groups in Iberia moving into northern France via the Atlantic seaboard and/or southern France, mixing to a limited degree with Neolithic populations from Central Europe before travelling across the Channel1–2, 30.
One explanation for the British Neolithic cline in WHG ancestry is that a single population moved across Britain from a western entry point, and progressively admixed with local hunter-gatherers. This scenario is consistent with the western distribution of megalithic cultures along the Atlantic seaboard31, and is supported by the radiocarbon evidence suggesting a marginally earlier date for the arrival of ANF ancestry in the west of Britain1. However, the lack of evidence for substantive WHG introgression into British Neolithic populations – outside of western Scotland – favours this cline reflecting multiple source populations with variable proportions of WHG admixture having entered different parts of Britain. This interpretation is consistent with archaeological evidence for regional British Neolithic cultures showing links to varied parts of mainland Europe2 and our qpGraph analysis indicating geographically-structured Neolithic Central European admixture. Overall, the regional variation in ancestry of British Neolithic populations likely reflects both differing degrees of admixture between farmers and local foragers (e.g. western Scotland), and multiple continental source populations carrying variable WHG and Neolithic Central European ancestry.
Evidence for only low levels of WHG introgression among British Early Neolithic people is striking given the extensive and complex admixture processes inferred for continental Neolithic populations7, 13–15, 32–33. Low levels of admixture between these two groups on the wave front of farming advance in continental Europe have been attributed to the maintenance of cultural and reproductive boundaries for several centuries after initial contact, before more extensively mixing32. Similarly, isotopic and genetic data from the west coast of Scotland suggest the potential coexistence of genetically distinct hunter-fisher-gatherers and farmers, albeit for a maximum of a few centuries34. However, there is no evidence for a resurgence of WHG ancestry in the British Neolithic, consistent with limited evidence for Mesolithic cultural artefacts in Britain beyond 4000 BC1–2, and with a major dietary shift from marine to terrestrial resources at this time (see Supplementary Materials Section 5)35.
Conclusion
In contrast to other European regions, the transition to farming in Britain occurred with little introgression from resident foragers – either during initial colonization, or throughout the Neolithic. This may reflect low Late Mesolithic population density in Britain and/or an introduction of farming by populations who had mastered the technologies needed to thrive in northern and western continental Europe during the previous two millennia1–2.
Nat Ecol Evol. 2019 May 08
|
|
|
|
Post by Admin on Jan 17, 2020 22:10:12 GMT
The transition from a hunter–gatherer existence to a “Neolithic lifestyle,” which was characterized by increasing sedentarism and the domestication of animals and plants, has profoundly altered human societies around the world [1],[2]. In Europe, archaeological and population genetic views of the spread of this event from the Near East have traditionally been divided into two contrasting positions. Most researchers have interpreted the Neolithic transition as a period of substantial demographic flux (demic diffusion) potentially involving large-scale expansions of farming populations from the Near East, which are expected to have left a detectable genetic footprint [3],[4]. The alternative view (cultural diffusion model; e.g., [5]) suggests that indigenous Mesolithic hunter–gatherer groups instead adopted new subsistence strategies with relatively little, or no, genetic influence from groups originating in the Near East. Genetic studies using mitochondrial DNA (mtDNA) and Y-chromosomal data from modern populations have generated contradictory results, and as a consequence, the extent of the Neolithic contribution to the gene pool of modern-day Europeans is still actively debated [6]–[8]. Studies that suggest that the genetic variation in modern-day Europe largely reflects farming communities of the Early Neolithic period [9]–[11] contrast strongly with others that consider the input from the Near East an event of minor importance and ascribe the European genetic variation and its distribution patterns to the initial peopling of Europe by anatomically modern humans in the Upper Paleolithic [12]–[15]. These patterns are also likely to have been significantly impacted by the early Holocene re-expansions of populations out of southerly refugia formed during the Last Glacial Maximum (∼25,000 y ago) and by the numerous demographic events that have taken place in post-Neolithic Europe. The genetics of prehistoric populations in Europe remain poorly understood, restricting real-time insights into the process of the Neolithic transition [16]–[21]. As a result, most attempts to reconstruct history have been limited to extrapolation from allele frequencies and/or coalescent ages of mitochondrial and Y chromosome haplogroups (hgs) in modern populations. Ancient DNA (aDNA) analyses now provide a powerful new means to directly investigate the genetic patterns of the early Neolithic period, although contamination of specimens with modern DNA remains a major methodical challenge [22]. A previous genetic study of 24 individuals from the early Neolithic Linear Pottery Culture (LBK; 5,500–4,900 calibrated b.c. [cal b.c.]) in Central Europe detected a high frequency of the currently rare mtDNA hg N1a, and proposed this as a characteristic genetic signature of the Early Neolithic farming population [19]. This idea was recently supported by the absence of this particular lineage (and other now more common European hgs) among sequences retrieved from neighboring Mesolithic populations [20],[21]. However, a study of 11 individuals from a Middle/Late Neolithic site on the Iberian Peninsula (3,500–3,000 cal b.c.) did not find significant differences from modern populations, supporting a quite different population genetic model for the Neolithic transition in Iberia [18]. To gain direct insight into the genetic structure of a population at the advent of farming in Central Europe we analyzed a complete graveyard from the Early Neolithic LBK site at Derenburg Meerenstieg II (Harzkreis, Saxony-Anhalt) in Germany. The archaeological culture of the LBK had its roots in the Transdanubian part of the Carpathian Basin in modern-day Hungary approximately 7,500–8,000 y ago and spread during the subsequent five centuries across a vast area ranging from the Paris Basin to the Ukraine [23],[24]. The graveyard samples provide a unique view of a local, closed population and permit comparisons with other specimens of the LBK archaeological culture (the contemporaneous meta-population) and with modern populations from the same geographical area (covering the former range of the LBK), as well as groups across the wider context of Western Eurasia. Our primary aim was to genetically characterize the LBK early farming population: by applying comprehensive phylogeographic and population genetic analyses we were able to locate its origins within the broader Eurasian region, and to trace its potential dispersal routes into Europe.  Results/Discussion We used standard approaches to clone and sequence the mitochondrial hypervariable segment I (HVS-I) and applied quantitative real-time PCR (qPCR) as an additional quality control. In addition, we developed two new multiplex typing assays to simultaneously analyze important single nucleotide polymorphisms (SNPs) within the mtDNA coding region (22 SNPs: GenoCoRe22) and also the Y chromosome (25 SNPs: GenoY25). In addition to minimizing the risk of contamination, the very short DNA fragments (average 60–80 bp) required by this approach maximize the number of specimens that can be genetically typed. We successfully typed 17 individuals for mtDNA, which together with a previous study [19] provided data for 22 individuals from the Derenburg graveyard (71% of all samples collected for genetic analysis; Tables 1 and S1), and significantly extended the genetic dataset of the LBK (n = 42), to our knowledge the largest Neolithic database available. Sequences have been deposited in GenBank (http://www.ncbi.nlm.nih.gov/genbank/; accession numbers HM009339–HM009341, HM009343–HM009355, and HM009358), and detailed alignments of all HVS-I clone sequences from Derenburg are shown in Dataset S1.  Population Genetic Analyses To analyze the Neolithic mtDNA sequence diversity and characterize modern geographical affinities, we applied a range of population genetic analyses including shared haplotype analyses, principal component analyses (PCAs), multidimensional scaling (MDS), geographic mapping of genetic distances, and demographic modeling via Bayesian Serial Simcoal (BayeSSC) analyses (Table 2).  Figure 1. Percentages of shared haplotype matches per population. Populations are plotted on a northwest–southeast axis. Note that the percentage of non-informative matches (orange) is nearly identical to the percentage of all shared haplotypes (red) in most populations, whereas we observe elevated frequencies of informative matches (blue) in Southeast European and Near Eastern population pools, culminating in Iranians. Shared Haplotype Analyses We prepared standardized modern population datasets of equal size (n = ∼500) from 36 geographical regions in Eurasia (n = 18,039; Table S4) to search for identical matches with each LBK haplotype. Out of 25 different haplotypes present in 42 LBK samples, 11 are found at high frequency in nearly all present-day populations under study, a further ten have limited geographic distribution, and the remaining four haplotypes are unique to Neolithic LBK populations (Table S4). The 11 widespread haplotypes are mainly basal (i.e., constituting a basal node within the corresponding hg) for Western Eurasian mitochondrial hgs H, HV, V, K, T, and W. While these haplotypes are relatively uninformative for identifying genetic affiliations to extant populations, this finding is consistent within an ancient population (5,500–4,900 cal b.c., i.e., prior to recent population expansions), in which basal haplotypes might be expected to be more frequent than derived haplotypes (e.g., end tips of branches within hgs). The next ten LBK haplotypes were unequally spread among present-day populations and for this reason potentially contain information about geographical affinities. We found nine modern-day population pools in which the percentage of these haplotypes is significantly higher than in other population pools (p>0.01, two-tailed z test; Figure 1; Table S4): (a) North and Central English, (b) Croatians and Slovenians, (c) Czechs and Slovaks, (d) Hungarians and Romanians, (e) Turkish, Kurds, and Armenians, (f) Iraqis, Syrians, Palestinians, and Cypriotes, (g) Caucasus (Ossetians and Georgians), (h) Southern Russians, and (i) Iranians. Three of these pools (b–d) originate near the proposed geographic center of the earliest LBK in Central Europe and presumably represent a genetic legacy from the Neolithic. However, the other matching population pools are from Near East regions, which is consistent with this area representing the origin of the European Neolithic, an idea that is further supported by Iranians sharing the highest number of informative haplotypes with the LBK (7.2%; Table S4). The remaining pool (a) from North and Central England shares an elevated frequency of mtDNA T2 haplotypes with the LBK, but otherwise appears inconsistent with the proposed origin of the Neolithic in the Near East. It has been shown that certain alleles (here hgs) can accumulate in frequency while surfing on the wave of expansion, eventually resulting in higher frequencies relative to the proposed origin [29],[30]. Several of the other population pools also show a low but nonsignificant level of matches, which may relate to pre-Neolithic distributions or subsequent demographic movements (Figure 1). Of the four unique mtDNA haplotypes, two were from an earlier study of the LBK (16286-16304 and 16319-16343; Table S5 and [19]). The haplotype 16286-16304 has many one- or two-step derivates in all parts of Europe and is therefore rather uninformative for inferring further geographical affinities. The only relatively close neighbor of haplotype 16319-16343 is found in Iraq (16129-16189-16319-16343), in agreement with the Near Eastern affinities of the informative LBK haplotypes. The other two unique LBK haplotypes belong to N1a, the characteristic LBK hg. The frequency of N1a was 13.6% for Derenburg samples (3/22) and 14.3% for all LBK samples published to date (6/42). Notably, N1a has not yet been observed in the neighboring hunter–gatherer populations of Central Europe before, during, or after the Early Neolithic [20] nor in the early Neolithic Cardial Ware Culture from Spain [18]. The Y chromosome hgs obtained from the three Derenburg early Neolithic individuals are generally concordant with the mtDNA data (Table 1). Interestingly, we do not find the most common Y chromosome hgs in modern Europe (e.g., R1b, R1a, I, and E1b1), which parallels the low frequency of the very common modern European mtDNA hg H (now at 20%–50% across Western Eurasia) in the Neolithic samples. Also, while both Neolithic Y chromosome hgs G2a3 and F* are rather rare in modern-day Europe, they have slightly higher frequencies in populations of the Near East, and the highest frequency of hg G2a is seen in the Caucasus today [15]. The few published ancient Y chromosome results from Central Europe come from late Neolithic sites and were exclusively hg R1a [31]. While speculative, we suggest this supports the idea that R1a may have spread with late Neolithic cultures from the east [31]. |
|
|
|
Post by Admin on Jan 18, 2020 18:30:11 GMT
Principal Component Analysis and Multidimensional Scaling Four Neolithic datasets were constructed (Table 2) and compared with 55 present-day European and Near Eastern populations and one Mesolithic hunter–gatherer population [20] in a PCA (Figure 2). The PCA accounted for 39% of the total genetic variation, with the first principal component (PC) separating Near Eastern populations from Europeans (24.9%), and with LBK populations falling closer to Near Eastern ones. However, the second PC (17.4%) clearly distinguished the four Neolithic datasets from both Near East and European populations. An MDS plot (Figure S1) showed similar results, with the Near Eastern affinities of the LBK populations even more apparent.  Figure 2. PCA plot based on mtDNA haplogroup frequencies. The two dimensions display 39% of the total variance. The contribution of each hg is superimposed as grey component loading vectors. Notably, the Derenburg dataset (DEB22) groups well with its meta-population (LBK20), supporting the unique status and characteristic composition of the LBK sample. Populations are abbreviated as follows (Table S6): ALB, Albanians; ARM, Armenians; ARO, Aromuns; AUT, Austrians; AZE, Azeris; BAS, Basques; BLR, Byelorussians; BOS, Bosnians; BUL, Bulgarians; CHE, Swiss; CHM, Mari; CHV, Chuvash; CRO, Croats; CZE, Czechs; DEB22, Derenburg; DEU, Germans; ENG, English; ESP, Spanish; EST, Estonians; FIN, Finns; FRA, French; GEO, Georgians; GRC, Greeks; HG, European Mesolithic hunter–gatherers.; HUN, Hungarians; IRL, Irish; IRN, Iranians; IRQ, Iraqis; ISL, Icelanders; ITA, Italians; JOR, Jordanians; KAB, Kabardinians; KAR, Karelians; KOM, Komis (Permyaks and Zyrian); KUR, Kurds; LBK20, LBK without Derenburg; LBK34, all LBK samples excluding potential relatives; LBK42, all LBK; LTU, Lithuanians; LVA, Latvians; MAR, Moroccans; MOR, Mordvinians; NOG, Nogais; NOR, Norwegians; OSS, Ossetians; POL, Poles; PRT, Portuguese; PSE, Palestinians; ROU, Romanians; RUS, Russians; SAR, Sardinians; SAU, Saudi Arabians; SCO, Scots; SIC, Sicilians; SVK, Slovaks; SVN, Slovenians; SWE, Swedes; SYR, Syrians; TAT, Tatars; TUR, Turkish; UKR, Ukrainians. doi.org/10.1371/journal.pbio.1000536.g002To better understand which particular hgs made the Neolithic populations appear either Near Eastern or (West) European, we compared average hg frequencies of the total LBK (LBK42) and Derenburg (DEB22) datasets to two geographically pooled meta-population sets from Europe and the Near East (Tables 2 and S6; 41 and 14 populations, respectively). PC correlates and component loadings (Figure 2) showed a pattern similar to average hg frequencies (Table 2) in both large meta-population sets, with the LBK dataset grouping with Europeans because of a lack of mitochondrial African hgs (L and M1) and preHV, and elevated frequencies of hg V. In contrast, low frequencies of hg H and higher frequencies for HV, J, and U3 promoted Near Eastern resemblances. Removal of individuals with shared haplotypes within the Derenburg dataset (yielding dataset LBK34) did not noticeably decrease the elevated frequencies of J and especially HV in the Neolithic data. Most importantly, PC correlates of the second component showed that elevated or high frequencies of hgs T, N1a, K, and W were unique to LBK populations, making them appear different from both Europe and Near East. The considerable within-hg diversity of all four of these hgs (especially T and N1a; Table 1) suggests that this observation is unlikely to be an artifact of random genetic drift leading to elevated frequencies in small, isolated populations. The pooled European and Near Eastern meta-populations are necessarily overgeneralizations, and there are likely to be subsets of Near Eastern populations that are more similar to the Neolithic population. Interestingly, both the PCA and the MDS plots identified Georgians, Ossetians, and Armenians as candidate populations (Figures 2 and S1). Mapping Genetic Distances We generated genetic distance maps to visualize the similarity/distance of the LBK and Derenburg populations (datasets LBK42 and DEB22) to all modern populations in the large Western Eurasian dataset (Figure 3). In agreement with the PCA and MDS analyses, populations from the area bounding modern-day Turkey, Armenia, Iraq, and Iran demonstrated a clear genetic similarity with the LBK population (Figure 3A). This relationship was even stronger in a second map generated with just the Neolithic Derenburg individuals (Figure 3B). Interestingly, the map of the combined LBK data also suggested a possible geographic route for the dispersal of Neolithic lineages into Central Europe: genetic distances gradually increase from eastern Anatolia westward across the Balkans, and then northwards into Central Europe. The area with lower genetic distances follows the course of the rivers Danube and Dniester, and this natural corridor has been widely accepted as the most likely inland route towards the Carpathian basin as well as the fertile Loess plains further northwest [23],[32],[33].  Figure 3. Genetic matrilineal distances between 55 modern Western Eurasian populations (Table S6) and Neolithic LBK samples. Mapped genetic distances are illustrated between 55 modern Western Eurasian populations and the total of 42 Neolithic LBK samples (A) or the single graveyard of Derenburg (B). Black dots denote the location of modern-day populations used in the analysis. The coloring indicates the degree of similarity of the modern local population(s) with the Neolithic sample set: short distances (greatest similarity) are marked by dark green and long distances (greatest dissimilarity) by orange, with fainter colors in between the extremes. Note that green intervals are scaled by genetic distance values of 0.02, with increasingly larger intervals towards the “orange” end of the scale. doi.org/10.1371/journal.pbio.1000536.g003Bayesian Serial Simcoal Analysis While an apparent affinity of Neolithic farmers to modern-day Near East populations is revealed by the shared haplotype analyses, PCA, MDS, and genetic distance maps, the population-specific pairwise FST values among ancient populations (hunter–gatherers and LBK) and the modern population pools (Central Europe and Near East) tested were all significant (p>0.05; Table 3), suggesting a degree of genetic discontinuity between ancient and modern-day populations. The early farmers were closer to the modern Near Eastern pool (FST = 0.03019) than hunter–gatherers were (FST = 0.04192), while both ancient populations showed similar differences to modern Central Europe, with the hunter–gatherers slightly closer (FST = 0.03445) than the early farmers (FST = 0.03958). The most striking difference was seen between Mesolithic hunter–gatherers and the LBK population itself (FST = 0.09298), as previously shown [20]. We used BayeSSC analyses to test whether the observed FST values can be explained by the effects of drift or migration under different demographic scenarios (Figure S2). This encompassed comparing FST values derived from coalescent simulations under a series of demographic models with the observed FST values in order to test which model was the most likely, given the data. By using an approximate Bayesian computation (ABC) framework we were able to explore priors for initial starting deme sizes and dependent growth rates to maximize the credibility of the final results. The Akaike information criterion (AIC) was used to evaluate a goodness-of-fit value of the range of models in the light of the observed FST values. In addition, a relative likelihood estimate for each of the six models given the data was calculated via Akaike weights (ω). The highest AIC values, and therefore the poorest fit, were obtained for models representing population continuity in one large Eurasian meta-population through time (Models H0a and H0b; Table 4). Of note, the goodness of fit was better with a more recent population expansion (modeled at the onset of the Neolithic in Central Europe) and hence higher exponential growth rate (H0a). The model of cultural transmission (H1), in which a Central European deme including Neolithic farmers and hunter–gatherers coalesced with a Near Eastern deme in the Early Upper Paleolithic (1,500 generations, or ∼37,500 y ago), resulted in intermediate goodness-of-fit values (H1a and H1b; Table 4; Figure S2). The best goodness-of-fit values were retrieved for models of demic diffusion (model H2; Table 4) with differing proportions of migrants (25%, 50%, and 75% were tested) from the Near Eastern deme into the Central European deme around the time of the LBK (290 generations, ∼7,250 y ago; Table 4). Notably, the models testing 50% and 75% migrants returned the highest relative likelihood values (42% and 52%, respectively), and therefore warrant further investigation. However, while the demic diffusion model H2 produced values that approximated the observed FST between Neolithic farmers and the Near Eastern population pool, none of the models could account for the high FST between hunter–gatherers and early farmers or early farmers and modern-day Central Europeans. The models we tested represent major oversimplifications and it should be noted that modeling human demographic history is notoriously difficult, especially given the complex history of Europe and the Near East over this time scale. The fact that no model explained the observed FST between ancient and modern-day populations particularly well suggests that the correct scenario has not yet been identified, and that there is also an obvious need for sampling of material from younger epochs. Additionally, sampling bias remains an issue in aDNA studies, and this is particularly true for the chronologically and geographically diverse hunter–gatherer dataset. In the light of the models tested (see also [19],[20]), we would suggest that the basis of modern European mtDNA diversity was formed from the postglacial re-peopling of Europe (represented here by the Mesolithic hunter–gatherers) and the genetic input from the Near East during the Neolithic, but that demographic processes after the early Neolithic have contributed substantially to shaping Europe's contemporary genetic make up. |
|

