Results
We analyzed 714 samples to estimate genetic diversity in each of the four Romanian provinces (Additional file 1: Table S1). We observed high mtDNA haplotype diversity in the Wallachian population. Analyzing the control region, we detected 189 haplotypes and k = 4.530 nucleotide differences, on average. The results are summarized in Additional file 3: Table S2.
We observed similar haplotype and nucleotide diversity values for all Romanian provinces, with a slightly lower nucleotide diversity in the Dobrudja population and higher haplotype diversity in Transylvania. We observed significant deviations from neutrality tests according to Tajima’s D and Fu’s [30] for all Romanian provinces (Additional file 3: Table S2).
We observed length heteroplasmy in HVSI generated by a T to C transition in the poly-C tract between nucleotide positions 16184 and 16193 in 82 individuals (11.48%). In addition to length heteroplasmy, we found two sequence heteroplasmies in HVSI at position 16084 T/C in one sample and at position 16237 T/C in a second sample.
The resampling analysis for the Dobrudja sample using a 1000 replicate bootstrap indicated that the mean statistics for our data in the vector that we analyzed was 3.833. The bootstrap bias was only -0,0152 and its standard error was about 1.1364. The 95% confidence for mean statistic: the lower bound was 2.08 and the upper bound was 6. The histogram of men of bootstrap samples was nearly normal considering the great number of bootstrap replications, as depicted in the Additional file 4: Figure S4.
As expected, we were able to classify the huge majority of individuals from the four Romanian populations into nine Eurasian mitochondrial haplogroups (H, U, K, T, J, HV, V, W, and X). All mtDNA data are summarized in Additional file 1: Table S1.
The Romanian populations also exhibited sequences that belonged to the most frequent Asian haplogroups (haplogroups A, C, D, I, M, and N) and African haplogroup L. We detected haplogroups A, C, D, and I in the Romanian sample, with an overall frequency of 2.24%, consistent with the frequency in other European populations. We observed a relatively high frequency of Asian haplogroups M and N in Wallachia, Dobrudja, and Moldavia, but not in Transylvania, which also lacked the M haplogroup. The haplogroup X, entirely represented by subhaplogroup X2, was present at the highest frequency in Transylvania.
The overall frequency of haplogroup H (40.98%), the most common haplogroup in Europe [31], was consistent with the frequency observed in most European populations, and varied from a relatively high frequency in Transylvania to a lower frequency in Dobrudja, as presented in Fig. 1. Two subhaplogroups, H1 and H2, were quite frequent (>5%), while H3 had a frequency of 0.54%, comparable to previous estimates [13, 32].
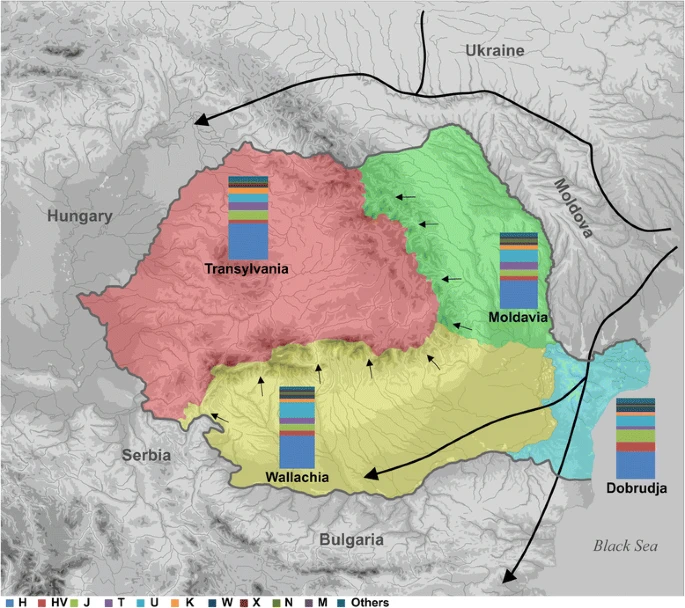
Fig. 1
Map of Romania showing the approximate migration routes and the mtDNA haplogroup distribution in the Romanian provinces. The map depicts the geographic distribution of mtDNA haplogroups in the Romanian provinces as reported in Additional file 2: Table S3: Wallachia (yellow), Dobrudja (blue), Moldavia (green) and Transylvania (red). Arrows indicate the approximate migration routes running east to west direction that seemed to be used throughout the history since Neolithic period to Middle Ages. The map was constructed by M.C. and R.C
Our data indicated that haplogroup U is the second most frequent in all analyzed populations but is noticeably less frequent in Transylvania than in other areas (Fig. 1). In our sample, we detected the subhaplogroups U1, U6, and U7 at a general frequency of 1.4%, 0.14% and 0.14%, respectively. Within haplogroup U, the most ancient and prevalent subhaplogroup in Europe [33], U5 had the highest frequency (47.94% within haplogroup U) in all four provinces.
In Walachia, Moldavia, and Transylvania, we detected similar HV haplogroup frequencies to those observed in other European countries, but we observed the highest frequency in the Dobrudja population. With respect to haplogroups N, M, X, and V, we found different frequency distributions between Transylvania and the other three provinces, as depicted in Additional file 2: Table S3 and Fig. 1.
To explore the genetic affinities of Romanian populations with neighboring populations, we conducted a PCA based on the frequencies of mitochondrial haplogroups (Fig. 2). The first component (PC) accounted for 17.34% of the total haplogroup variation (30.68%) and separated the European populations into roughly three clusters, with the Romanian provinces forming an individual group with Transylvania close to the center of the axis. The second PC accounted for 13.38% of the total haplogroup variation and did not clearly distinguish populations, although the Romanian provinces formed a single cluster, with Wallachia slightly dissociated from these provinces at the end of this vector. Component loadings of PC1 indicated high correlation coefficients for M, U1, and U5 (0.689, 0.840, and -0.759, respectively), supporting the grouping of the analyzed populations (Fig. 2).
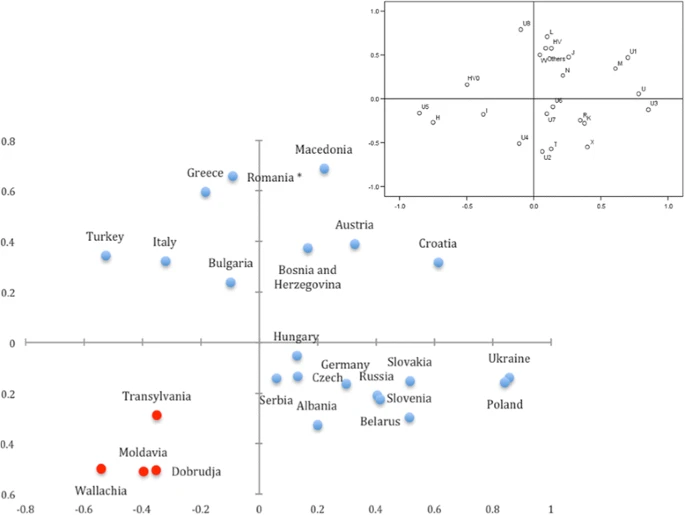
Fig. 2
Principal Component Analysis of mitochondrial haplogroup frequencies of the neighboring and Romanian provinces populations. The Romanian provinces in the present study are represented in red dots. The Romanian population marked with the asterisk sign refers to previously published data as in the Additional file 2: Table S3. The upper right plot shows the correlation of each haplogroup to the first and second axes of PCA
The high frequencies of the haplogroup M (excepting Transylvania) and U5, as well as the lower frequencies of subhaplogroup U1 reveal a pattern that could explain the distribution of Romanian populations on the PCA plot. Component loadings of PC2 indicated a high correlation coefficient for X, which is consistent with the observed high frequencies of the haplogroup X in the Wallachian, Dobrudjan, and Moldavian provinces.
To further visualize the relationships among Romanian populations analyzed here and European and Near Eastern populations, we estimated pairwise F ST based on the mitochondrial haplogroup frequencies for 19 neighboring populations, including Romanian mtDNA data from previous studies, or 41 populations from all of Europe and the Near East (data shown in Additional file 2: Table S3). For both analyses, the pairwise population F ST values were not statistically significant (p = 0.00000 ± 0.0000, F ST test), indicating no differentiation among Romanian provinces (Additional file 5: Table S4). In a statistical analysis, we only found statistically significant differentiation (p = 0.00000) between these provinces and the Caucasus, Egypt, or Turkey populations.
Based on MDS plots including the geographical neighbors or 41 populations, we found that Transylvania is more closely related to Central European populations than to the other Romanian provinces, which are more closely related to the Balkan populations (Fig. 3 and Additional file 6: Figure S1).


