|
|
Post by Admin on May 23, 2020 21:14:46 GMT
B. Airborne saliva droplet’s transport at different conditions According to several governments, strict recommendations were made for people to keep a distance of at least 6 feet (2 m). The above advice was announced to the public as a safe social distancing to prevent airborne disease transmission (such as COVID-19) from one person to another. This study shows 2 m is a safe approximate distance in the case where there is no wind, i.e., at wind speed ≈0 km/h, at 20 °C, relative humidity of 50%, and a ground surface temperature of 15 °C (Fig. 7). The ground surface temperature (GST) of 15 °C is somehow arbitrary because, in winter/spring season, the ground surface temperature is lower than the air temperature and the opposite in the summer/autumn season. Therefore, we considered GST = Tair − 5 °C. However, the 5 °C may vary from region to region and also depends on the soil properties. We aimed to approximate as much as possible a real situation in winter/spring seasons. Further investigation is required to quantify the effects of GST,35 as well as relative humidity and ambient air temperature.  FIG. 7. A human cough: saliva droplet’s disease-carrier particles cannot travel more than 2 m in space at approximately zero wind speed. The environment is at ambient temperature, pressure, and relative humidity of 20 °C, 1 atm, and 50%, respectively, with the ground temperature at 15 °C and mouth temperature at 34 °C. Figure 7 shows the evolution of human saliva droplets, taking into account the dispersion, evaporation, breakup, and droplet settling. After 49 s, all droplets did not exceed a horizontal distance of 1 m away from the mouth. At the time of 49 s, some droplets appear at 0.77 m above the ground. At the time of 10 s, one can witness the circulation of the droplet cloud, which can be explained by its closeness to the body that plays the role of a stationary wall of no-slip like the ground surface. Also critical is that the droplets take about 15 s to fall below the human waist level, which is considered as a safe vertical distance. In the case of no wind, young children will be most vulnerable in the close vicinity of the falling droplet cloud. At 4 km/h wind speed blowing from left to right in the direction of the human cough [see Fig. 8(a)], the saliva liquid droplets can travel up to 6 m away from the mouth in a period of 5 s. The saliva droplets fly as a cloud of droplets sheared by the wind, which causes the cloud deformation under the turbulent dispersion forces. Complex phase change and transport phenomena such as evaporation and droplet breakup occur at different rates depending on the environmental conditions and on the intensity of the cough. After 5 s from the occurrence of cough, the droplet cloud loses mass, and minimum size reduces progressively until total disappearance at a critical time >5 s. Figure 8(a) enlightens another interesting phenomenon, which is the vertical stretching of the droplet cloud while moving away from the mouth where some droplets nearly reach the ground at about t = 5 s. Moreover, at this low wind speed, we observe that the saliva droplet cloud remained below the horizontal line situated 1.63 m below the mouth.  FIG. 8. A human cough: saliva droplet’s disease-carrier particles may travel in the air medium to unexpected considerable distances depending on the environmental conditions. This figure shows the effect of wind speed on the saliva droplet and transport under dispersion and evaporation. Wind blowing from left to right at speeds of 4 km/h (a) and 15 km/h (b). The environment is at ambient temperature, pressure, and relative humidity of 20 °C, 1 atm, and 50%, respectively, with the ground temperature at 15 °C. At the same environmental conditions, but with the wind speed increasing from ≈4 km/h to ≈15 km/h, we observe a different saliva droplet kinematics [Fig. 8(b)]. Under this wind speed of 15 km/h, the saliva droplets move away faster and reach 6 m in 1.6 s with an accelerating dispersion rate. Similarly, evaporation is accompanied by mass reduction in the saliva droplets, which we will discuss quantitatively in Sec. III C. Additionally, at a speed of 15 km/h, we observe that the droplet cloud is sheared and stretched along an axis, making an angle of about 45° with the horizontal line situated at 1.63 m height. The results for 15 km/h reveal that saliva droplets exist above 1.63 m height due to dispersion for all times between approximately 0.4 s and 1.6 s. The droplet cloud [Figs. 8(a) and 8(b)] will affect both adults and children of different heights. The 1.63 m assumption leaves shorter adults and children at even higher risk.  FIG. 9. A human cough: mechanisms of airborne saliva droplet’s transport, breakup, dispersion, and evaporation. This figure shows different cloud kinematics (elongation and rotation) depending on the wind shearing force; the gravitational or settling forces; and the evaporation rates. Wind blowing from left to right at speeds of (a) 4 km/h and (b) 15 km/h. The environment is at ambient temperature, pressure, and relative humidity of 20 °C, 1 atm, and 50%, respectively, with the ground temperature at 15 °C. We have also examined the kinematics of airborne disease-carrier saliva droplets (Fig. 9). Different saliva droplet cloud kinematics may occur at different rates such as elongation, drifting, and rotation. The cloud kinematics is very complex and has several driving forces, which are the wind shearing rate, gravitational acceleration, turbulent dispersion, interaction forces manifested by breakup or coalescence, and stress forces manifested by a droplet’s phase change or evaporation. At a low wind speed of 4 km/h [Fig. 9(a)], the saliva droplet cloud is advected in the wind direction with an increase in anticlockwise rotation between 0.1 s and 5 s. However, at a higher wind speed of 15 km/h [Fig. 9(b)], the saliva droplet cloud is advected in the wind direction with an increase in clockwise rotation between 0.1 s and 1.6 s and a 45° angle with the horizontal line at z = 1.63. The above transport evolution is explained by a reversal of the competition between some of the force ratios, e.g., wind shearing, dispersion, and settling forces. A detailed study of droplet kinematics is underway but is beyond the scope of the present study. |
|
|
|
Post by Admin on May 23, 2020 22:10:13 GMT
C. Quantitative analysis We have examined the saliva droplet diameter, which represents 10% of droplets being smaller than their corresponding initial size, D10 in Fig. 10. For all environmental conditions including different wind speeds, the D10 saliva droplet diameter decreases with time but at different rates with all values varying between 45 μm and 79 µm. As the wind speed increases from ≈0 km/h to 15 km/h, faster and smaller D10 occurs. Of course, at higher wind speeds, the curve of D10 might disappear at a certain time because the droplet cloud has reached the outlet of the existing computational domain that is 6 m long along the cough flow direction. The evaporation process mainly causes the reduction in the D10 saliva droplet diameter but is also accompanied by droplet breakup and coalescence that may occur at different rates and as a function of the wind shearing intensity and the turbulent dispersion force.  FIG. 10. Variation of saliva droplet diameter, which represents 10% of droplets being smaller than their corresponding initial size. Nevertheless, the quantification of D10 does not constitute a critical parameter in terms of airborne virus disease transmission compared to the maximum saliva droplet size. Bigger droplets may carry smaller virus particles and thus constitute more danger or risk in terms of airborne disease transmission between humans. Thus, the maximum saliva droplet diameter was quantified and plotted in Fig. 11 as a function of time. The maximum saliva droplet diameter Dmax decreased with time from 111 μm to 82 µm at different rates. As the wind speed increases, the Dmax reduction is observed to be faster. The latter effect is due to the higher shear rate of the wind, which accelerates droplet evaporation.  FIG. 11. Variation of the maximum saliva droplet diameter, Dpmax, with time. Another important quantifying factor is the liquid penetration distance (Fig. 12). It describes the maximum distance traveled by a saliva liquid droplet made of 95% initial mass. From 0 s to 10 s, at a wind speed of 0 km/h, the saliva droplets do not exceed the safe social distancing of 2 m. However, at higher speeds of 4 km/h and 15 km/h, the droplet penetration distance reaches 6 m in about 5.4 s and 1.6 s, respectively.  FIG. 12. Liquid penetration distance: maximum distance traveled by a saliva liquid droplet made of 95% initial mass. We have also examined the total percentage of saliva droplet’s mass reduction with reference to the initial mass of 7.7 mg saliva ejected from the human cough (Fig. 13). At 4 km/h, the total mass reduction occurs more slowly than the case of 15 km/h. This finding indicates that at moderate wind speed, exposure to the droplet cloud can be longer, thus potentially increasing virus transmission risk. In Figs. 11 and 13, the last points are dropping from the distributions because the droplets have approached the outlet, which is the limit of the computational domain at 6 m. Similar data trends are observed in the literature when investigating evaporation of water droplets.  FIG. 13. Saliva droplet’s mass reduction with reference to the initial mass. IV. CONCLUSIONS AND RECOMMENDATIONS 1. Without the surrounding wind speed, the droplets will fall to the ground in a short distance from the person exhaling or coughing. The present analysis shows that the range may not exceed 1 m. A tiny number of particles may travel slightly further longer. Still, their trajectory beyond 1 m will already be at a height significantly below half a meter dropping toward the ground. Thus, these droplets may not constitute a risk regarding facial contact of adults at this distance. 2. At wind speeds from 4 km/h to 15 km/h, we found that saliva droplets can travel to distances up to 6 m with a decrease in concentrations and liquid droplet size in the wind direction. Our findings imply that depending on the environmental conditions, the 2 m social distance may not suffice. Further research is required to quantify the influence of other parameters such as the environment relative humidity and temperature among others. 3. The droplet cloud will affect both adults and children of different heights. Shorter adults and children could be at higher risk if they are located within the trajectory of falling droplets. 4. At a lower wind speed, the total mass reduction occurs more slowly compared to a higher speed, which may prolong the exposure of a human to the droplets if the subject is located within the droplet’s envelope. Overall, the results show that in open spaces, airborne droplet carriers can travel significantly further than the 2 m recommended distance due to the wind speed. Several areas need further investigation to examine the impact of the above findings: •A recent letter discussed the COVID-19 outbreak associated with air conditioning in a restaurant in Guangzhou, China.37 Therefore, it would be worth mentioning generalizing the current analysis to an indoor setting. •We need to understand the droplet evaporation more deeply, especially at different environmental conditions. •We should also carry out further research to determine the droplet size at the origin. Droplet evaporation depends on the time it takes for the droplet to travel from the mouth to a particular position. •The violent cough of patients with respiratory diseases will affect droplet generation and secretions of fluids on airway surfaces and heighten coughing frequency.38 These factors need to be further quantified. •Further research is also required to assess the probability of viral transmission vs droplet. This study shows that the droplet concentration can be significant up to considerable distances from the origin of the cough. The issues arising from the past and the recent pandemic require a holistic approach to elucidate the open scientific questions and address the practical challenges. Such an approach would require closer interaction between bio-medicine, engineering fluid physics, and social sciences. |
|
|
|
Post by Admin on Jun 16, 2020 18:51:54 GMT
Over the past few weeks as states began to loosen restrictions, we have been discussing if and how to safely start services again. But the coronavirus is far from gone. As we try and figure out how to hold services while protecting our members, one question is of particular concern: How common is airborne spread of the virus?  How to spread a virus Respiratory infections are generally spread in three possible ways: from direct contact, from droplets and from airborne particles. Contact transmission occurs when a person touches an object that has live virus on it – called a fomite – and gets sick. Droplets are small particles of mucus or saliva that come from a person’s mouth or nose when they cough or talk. They range in size from 5 microns to hundreds of microns in diameter - a red blood cell to a grain of sand. Most droplets, particularly large ones, fall to the ground within seconds and don’t usually travel more than 1 or 2 meters. If a person coughed on you and you got sick, that would be droplet transmission. Airborne transmission happens because of airborne particles known as droplet nuclei. Droplet nuclei are any bit of mucus or saliva smaller than 5 microns across. People produce droplet nuclei when they talk, but they can also be formed when small droplets evaporate and shrink in size. Many of these droplets shrink so much that they begin to float before they hit the ground, thus becoming aerosols. People produce thousands of these droplet nuclei per second while talking and the aerosolized particles can contain live viruses and float in the air for hours. They are easy to inhale, and if they contain live virus, can get people sick. The ability of droplet nuclei to transmit the coronavirus has a massive impact on if and how places like my church can reopen.  Early on in the pandemic, experts at the Centers for Disease Control and Prevention and the World Health Organization were most concerned about the coronavirus being transmitted from surfaces and from large droplets. But the more research is done on SARS-CoV-2, the more evidence there is that airborne transmission is occurring although it is controversial. Both the CDC and WHO are now recommending that the general population wear masks, but for people going about their lives and wondering how to reopen public areas across the world, the question remains: Just how important is airborne transmission? Airborne longevity in the lab To get infected, a person needs to come in contact with live virus. If the virus dies before a person can inhale it, they won’t get sick. To test how well SARS-CoV-2 can live in the air, researchers use special equipment to create aerosolized virus and keep it airborne for long periods of time. Researchers can then take samples of the virus and see how long it stays alive in an aerosol. An early study from researchers at the National Institute of Health kept the virus airborne for four hours and found live virus the whole time. A subsequent pre-print study that I was part of found that the coronavirus can stay alive for up to 16 hours in the air. Neither the initial study nor the one that I was involved with measured the impact of temperature, humidity, ultraviolet light or pollution on survival of the virus in aerosols. There is evidence that simulated sunlight can inactivate 90% of SARS-CoV-2 viruses in saliva on surfaces or in aerosols within seven minutes. These studies suggest that the virus would be rapidly inactivated outdoors, but the risk of transmission indoors would remain.  Evidence from the real world Laboratory studies can provide valuable insight, but real world scenarios point to the true risk from airborne transmission. Reports from China, Singapore and Nebraska have found the virus in patient rooms and at very low levels in the ventilation system of hospitals where COVID-19 patients were treated. The report from China also found evidence of the virus at the entrance of a department store. So far, this sampling has been done using polymerase chain reaction tests which look for pieces of viral DNA, not live virus. They can’t tell researchers if what they are finding is infectious. For direct evidence of the risks of airborne transmission, we can look to a few case studies in the U.S. and abroad. One study tracked how a single infected person at a call center in South Korea infected 94 other people. There is also the widely reported of case of one infected person at a restaurant in Guangzhou, China, spreading the virus to nine other people because of the airflow created by an air conditioning unit in the room. Perhaps most striking, especially for myself as we contemplate how to reopen our church, is the example of the church choir in Skagit County, Washington. A single individual singing at a choir practice infected 52 other people. Singing and loud vocalization in general can produce a lot of aerosols, and evidence shows that some people are super-emitters of aerosols even during normal speech. It’s likely that some infections in this incident occurred from droplets or direct contact, but the fact that one person was able to infect so many people strongly suggests that airborne transmission was the driving factor in this outbreak. A paper published just last week compared the success of mitigation measures – like social distancing or mask wearing – to try and determine how the virus is spreading. The authors concluded that aerosol transmission was the dominant route. This conclusion is hotly debated in the scientific community, but this study and others do show the effectiveness of masks in slowing the spread of COVID-19. What does this mean for reopening and for individuals? The evidence strongly suggests that airborne transmission happens easily and is likely a significant driver of this pandemic. It must be taken seriously as people begin to venture back out into the world. Thankfully, there is an easy, if not perfect way you can reduce airborne transmission: masks. Since people can spread the virus when they are pre-symptomatic or asymptomatic, universal mask wearing is a very effective, low-cost way to slow down the pandemic. Since the primary risk is indoors, increasing ventilation rates and not recirculating air inside buildings would remove the virus from the indoor environment faster. My church has decided to reopen, but we are only planning to allow limited numbers of people in the church and spreading them throughout the sanctuary to maintain social distancing. And at least for now, everyone is required to wear masks. Especially while singing. |
|
|
|
Post by Admin on Jul 9, 2020 6:33:47 GMT
This week, Morawska and aerosol scientist Donald Milton at the University of Maryland, College Park, supported by an international group of 237 other clinicians, infectious-disease physicians, epidemiologists, engineers and aerosol scientists, published a commentary1 in the journal Clinical Infectious Diseases that urges the medical community and public-health authorities to acknowledge the potential for airborne transmission. They also call for preventive measures to reduce this type of risk. The researchers are frustrated that key agencies, such as the World Health Organization (WHO), haven’t been heeding their advice in their public messages.  In response to the commentary, the WHO has softened its position, saying in a press conference on 7 July that it will issue new guidelines about transmission in settings with close contact and poor ventilation. “We have to be open to this evidence and understand its implications regarding the modes of transmission, and also regarding the precautions that need to be taken,” said Benedetta Allegranzi, technical leader of the WHO task force on infection control. For months, the WHO has steadfastly pushed back against the idea that there is a significant threat of the coronavirus being transmitted by aerosols that can accumulate in poorly ventilated venues and be carried on air currents. The agency has maintained that the virus is spread mainly by contaminated surfaces and by droplets bigger than aerosols that are generated by coughing, sneezing and talking. These are thought to travel relatively short distances and drop quickly from the air. This type of guidance has hampered efforts that could prevent airborne transmission, such as measures that improve ventilation of indoor spaces and limits on indoor gatherings, say the researchers in the commentary: “We are concerned that the lack of recognition of the risk of airborne transmission of COVID-19 and the lack of clear recommendations on the control measures against the airborne virus will have significant consequences: people may think that they are fully protected by adhering to the current recommendations, but in fact, additional airborne interventions are needed for further reduction of infection risk.” This is particularly important now, as government-mandated lockdowns ease and businesses reopen. “To control [the pandemic], we need to control all the means of infection,” says Morawska, who first contacted the WHO with her concerns and published a summary of the evidence2 in early April. But this conclusion is not popular with some experts because it goes against decades of thinking about respiratory infections. Since the 1930s, public-health researchers and officials have generally discounted the importance of aerosols — droplets less than 5 micrometres in diameter — in respiratory diseases such as influenza. Instead, the dominant view is that respiratory viruses are transmitted by the larger droplets or through contact with droplets that fall on surfaces or are transferred by people’s hands. When SARS-CoV-2 emerged at the end of 2019, the assumption was that it spread in the same way as other respiratory viruses and that airborne transmission was not important. The WHO is following the available evidence, and has moderated its earlier opposition to the idea that the virus might spread through aerosols, according to Allegranzi. She says that although the WHO acknowledges that airborne transmission is plausible, current evidence falls short of proving the case. She adds that recommendations for physical distancing, quarantine and wearing masks in the community are likely go some way towards controlling aerosol transmission if it is occurring.  Age-old debate The debate over transmission routes has big implications for efforts to stop the virus from spreading. Smaller, lighter aerosols can linger and accumulate in the air and travel long distances on air currents. But studies going back to those of engineer William Wells in the 1930s have suggested that large droplets fall out of the air within about 2 metres. When SARS-CoV-2 emerged, health officials recommended frequent hand washing and maintaining a physical distance to break droplet and contact transmission routes. And some researchers and clinicians say these approaches are enough. Contact-tracing data support those measures, says Kate Grabowski, an infectious-disease epidemiologist at Johns Hopkins University in Baltimore, Maryland. “The highest-risk contacts are those that are individuals you share a home with or that you’ve been in a confined space with for a substantial period of time, which would lead me to believe it’s probably driven mostly by droplet transmission,” she says, although she says that aerosol transmission might occur on rare occasions. Many researchers concerned about airborne transmission point to the example of a fateful choir rehearsal that took place an hour’s drive from Seattle, Washington, on 10 March. Sixty-one members of the Skagit Valley Chorale gathered for a practice that lasted two-and-a-half hours. Despite there being hand sanitizer at the door, and choir members refraining from hugs and handshakes, at least 33 choristers contracted SARS-CoV-2, and two eventually died. Investigators concluded that the virus could have spread in aerosols produced by singing, and a ‘super-emitter’ who produced more aerosol particles than is typical, although they couldn’t rule out transmission through objects or large droplets3. But Morawska has modelled the conditions in the rehearsal hall and says there is no need to invoke the idea of a superspreader4. Inadequate ventilation, the long exposure time and the singing were sufficient to explain the number of people who became infected. And no amount of ventilation could have reduced the risk to an acceptable level for the two-and-a-half-hour rehearsal, she says. In another case, researchers used a tracer gas to show that aerosols carried on currents from an air-conditioning unit in a restaurant in Guangzhou, China, were to blame for an outbreak affecting ten diners from three separate families. None of the staff or patrons seated near other air-conditioning units were infected5. Meanwhile, a tour-bus passenger in Hunan province in China infected 8 of the 49 people on the bus. One of those sat 4.5 metres away from the infected person and entered and exited the bus through a different door. “That excludes the possibility of contacting each other or [being] in very close contact,” says Yang Yang, an epidemiologist at the University of Florida in Gainsville who is co-authoring a report on the case. “I think there is enough evidence for us to be very concerned in indoor environments, especially in confined spaces,” he says. 1. Morawska, L. & Milton, D. Clin. Infect. Dis. doi.org/10.1093/cid/ciaa939 (2020). 2. Morawska, L. & Coa, J. Environ. Int. 139, 105730 (2020). 3. Hamner, L. et al. Morb. Mortal. Wkly Rep. 69, 606–610 (2020). 4. Buonanno, G., Morawska, L. & Stabile, L. Preprint at medrXiv doi.org/10.1101/2020.06.01.201189845. Li, Y. et al. Preprint at medrXiv doi.org/10.1101/2020.04.16.20067728v1 (2020). |
|
|
|
Post by Admin on Dec 7, 2020 21:26:38 GMT
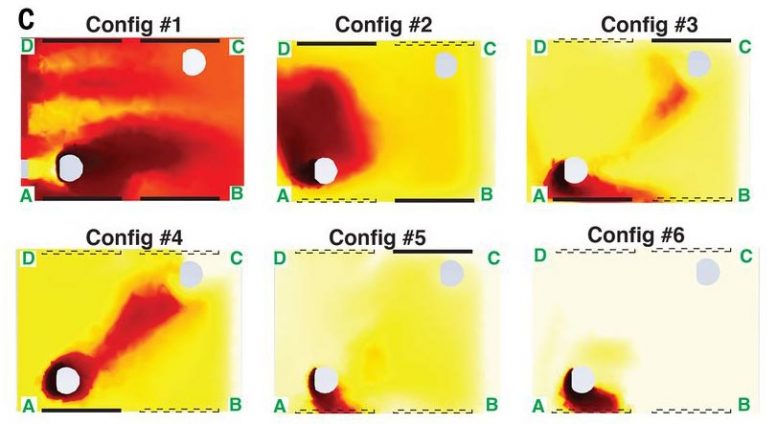 A new study looks at how airflow patterns inside the passenger cabin of a car might affect the transmission of SARS-CoV-2 and other airborne pathogens. Using computer simulations, the study looked at the risk of aerosol particles being shared between a driver and a passenger in different window configurations. Redder shades indicate more particles. Risk was shown to be higher with windows closed (top left), and decreasing with each window opened. The best case was having all windows open (bottom right). Credit: Breuer lab / Brown University A new study uses computer simulations to track airflows inside a car’s passenger cabin, providing potential strategies — some of them counterintuitive — for reducing the risk of transmitting airborne diseases. A new study of airflow patterns inside a car’s passenger cabin offers some suggestions for potentially reducing the risk of COVID-19 transmission while sharing rides with others. The study, by a team of Brown University researchers, used computer models to simulate the airflow inside a compact car with various combinations of windows open or closed. The simulations showed that opening windows — the more windows the better — created airflow patterns that dramatically reduced the concentration of airborne particles exchanged between a driver and a single passenger. Blasting the car’s ventilation system didn’t circulate air nearly as well as a few open windows, the researchers found. “Driving around with the windows up and the air conditioning or heat on is definitely the worst scenario, according to our computer simulations,” said Asimanshu Das, a graduate student in Brown’s School of Engineering and co-lead author of the research. “The best scenario we found was having all four windows open, but even having one or two open was far better than having them all closed.” Das co-led the research with Varghese Mathai, a former postdoctoral researcher at Brown who is now an assistant professor of physics at the University of Massachusetts, Amherst. The study is published in the journal Science Advances. 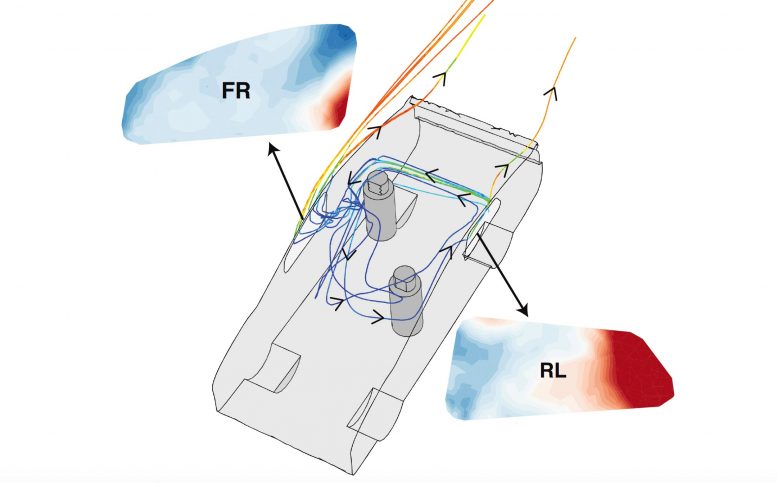 Car Windows Airflow A study published recently in Science Advances looks at how airflow patterns inside the passenger cabin of a car might affect the transmission of SARS-CoV-2 and other airborne pathogens. The simulations produced some potentially counterintuitive findings. For example, one might expect that opening windows directly beside each occupant might be the simplest way to reduce exposure. The simulations found that while this configuration is better than no windows down at all, it carries a higher exposure risk compared to putting down the window opposite each occupant. “When the windows opposite the occupants are open, you get a flow that enters the car behind the driver, sweeps across the cabin behind the passenger and then goes out the passenger-side front window,” said Kenny Breuer, a professor of engineering at Brown and a senior author of the research. “That pattern helps to reduce cross-contamination between the driver and passenger.” Credit: Breuer lab / Brown University The researchers stress that there’s no way to eliminate risk completely — and, of course, current guidance from the U.S. Centers for Disease Control (CDC) notes that postponing travel and staying home is the best way to protect personal and community health. The goal of the study was simply to study how changes in airflow inside a car may worsen or reduce risk of pathogen transmission. The computer models used in the study simulated a car, loosely based on a Toyota Prius, with two people inside — a driver and a passenger sitting in the back seat on the opposite side from the driver. The researchers chose that seating arrangement because it maximizes the physical distance between the two people (though still less than the 6 feet recommended by the CDC). The models simulated airflow around and inside a car moving at 50 miles per hour, as well as the movement and concentration of aerosols coming from both driver and passenger. Aerosols are tiny particles that can linger in the air for extended periods of time. They are thought to be one way in which the SARS-CoV-2 virus is transmitted, particularly in enclosed spaces. Part of the reason that opening windows is better in terms of aerosol transmission is because it increases the number of air changes per hour (ACH) inside the car, which helps to reduce the overall concentration of aerosols. But ACH was only part of the story, the researchers say. The study showed that different combinations of open windows created different air currents inside the car that could either increase or decrease exposure to remaining aerosols. Because of the way air flows across the outside of the car, air pressure near the rear windows tends to be higher than pressure at the front windows. As a result, air tends to enter the car through the back windows and exit through the front windows. With all the windows open, this tendency creates two more-or-less independent flows on either side of the cabin. Since the occupants in the simulations were sitting on opposite sides of the cabin, very few particles end up being transferred between the two. The driver in this scenario is at slightly higher risk than the passenger because the average airflow in the car goes from back to front, but both occupants experience a dramatically lower transfer of particles compared to any other scenario. The simulations for scenarios in which some but not all windows are down yielded some possibly counterintuitive results. For example, one might expect that opening windows directly beside each occupant might be the simplest way to reduce exposure. The simulations found that while this configuration is better than no windows down at all, it carries a higher exposure risk compared to putting down the window opposite each occupant. “When the windows opposite the occupants are open, you get a flow that enters the car behind the driver, sweeps across the cabin behind the passenger and then goes out the passenger-side front window,” said Kenny Breuer, a professor of engineering at Brown and a senior author of the research. “That pattern helps to reduce cross-contamination between the driver and passenger.” It’s important to note, the researchers say, that airflow adjustments are no substitute for mask-wearing by both occupants when inside a car. And the findings are limited to potential exposure to lingering aerosols that may contain pathogens. The study did not model larger respiratory droplets or the risk of actually becoming infected by the virus. |
|

