Post by Admin on Jul 25, 2020 23:51:20 GMT
Six reference-quality genomes reveal evolution of bat adaptations
David Jebb, Zixia Huang, […]Emma C. Teeling
Nature volume 583, 578–584(2020)
With more than 1,400 species identified to date2, bats (Chiroptera) account for about 20% of all extant mammal species. Bats are found around the world and successfully occupy diverse ecological niches1. Their global success is attributed to an extraordinary suite of adaptations1 including powered flight, laryngeal echolocation, vocal learning, exceptional longevity and a unique immune system that probably enables bats to better tolerate viruses that are lethal to other mammals (such as severe acute respiratory syndrome-related coronavirus, Middle East respiratory syndrome-related coronavirus and Ebola virus)3. Bats therefore represent important model systems for the study of extended healthspan4, enhanced disease tolerance3, vocal communication5 and sensory perception6. To understand the evolution of bats and the molecular basis of these traits, we generated reference-quality genomes for six bat species as part of the Bat1K global genome consortium1 (http://bat1k.com) in coordination with the Vertebrate Genome Project (https://vertebrategenomesproject.org). These six bat genera span both major suborders Yinpterochiroptera (R. ferrumequinum and R. aegyptiacus) and Yangochiroptera (P. discolor, M. myotis, P. kuhlii, M. molossus)7 (Supplementary Table 1), represent extremes in bat longevity8, possess major adaptations in bat sensory perception1 and can better survive viral infections as compared with other mammals3.
Genome sequencing and assembly
To obtain genome assemblies of high contiguity and completeness, we developed pipelines that incorporate state-of-the-art sequencing technologies and assembly algorithms (Supplementary Notes 1, 2). In brief, we generated PacBio continuous long reads, 10x Genomics Illumina read clouds, Bionano optical maps and chromosome conformation capture (Hi-C) Illumina read pairs for each bat species (Fig. 1a). We assembled the PacBio reads into contigs using a customized assembler we termed DAmar, a hybrid of the earlier Marvel9, Dazzler and Daccord10,11 systems. Next, we used 10x Illumina read-cloud data to correct base errors and phase haplotypes, arbitrarily picking one haplotype in a phased block. Finally, we used Bionano optical maps and then Hi-C data to produce long-range scaffolds (Extended Data Fig. 1a, b, Supplementary Note 2). For all six bat species, this resulted in assemblies with high contiguity: 96–99% of each assembly is in chromosome-level scaffolds (N50 values of 92–171.1 Mb) (Fig. 1b, Extended Data Figs. 1c, d, 2a). When compared with previously published bat genomes12,13,14,15,16,17,18,19, our assemblies have higher contig N50 values—ranging from 10.6 to 22.2 Mb—and therefore, these are two orders of magnitude more contiguous than bat genomes assembled from short-read data alone (Fig. 1b, Extended Data Fig. 1d, Supplementary Tables 2, 3, Supplementary Note 2). Similarly, our genomes are estimated to have near-100% gene completeness (see ‘Gene annotation’) (Fig. 1c, d, Supplementary Table 4, Supplementary Note 3.1). Furthermore, analysis of 197 nonexonic ultraconserved elements20 indicates a high completeness of nonexonic genomic regions. This analysis also revealed three cases of marked sequence divergence of ultraconserved elements in vespertilionid bats—something rarely observed in these elements, which are highly constrained amongst placental mammals (Extended Data Fig. 2b–d, Supplementary Figs. 1–3, Supplementary Table 5, Supplementary Note 3.2). In summary, these genomes are comparable to the best reference-quality genomes that have so far been generated for any eukaryote with a gigabase-sized genome21.
Fig. 1: Assembly and annotation of the genomes of six bat species.
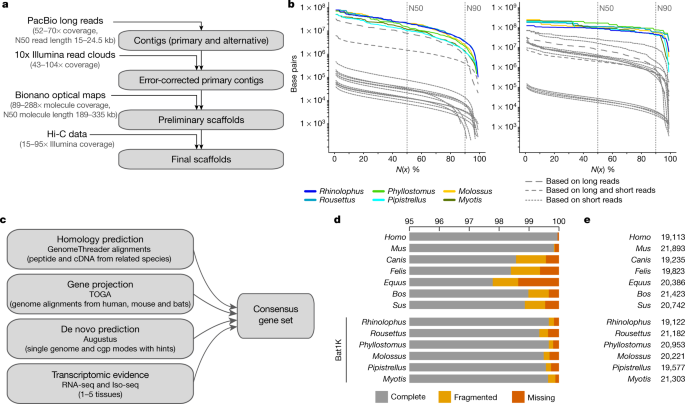
a, Genome assembly strategy and data produced. b, Comparison of assembly contiguity. N(x) % graphs show contig (left) and scaffold (right) sizes (y-axis), in which x per cent of the assembly consists of contigs and scaffolds of at least that size. Coloured lines refer to species with Bat1K assemblies. Extended Data Figure 1 labels all previous bat assemblies (shown as grey lines here). c, Overview of our strategy to annotate coding genes combining various types of evidence. cgp, comparative gene prediction. d, Comparison of the completeness of gene annotations, as a percentage of 4,101 mammalian genes from BUSCO. e, Total number of annotated genes.
Gene annotation
To comprehensively annotate protein-coding genes, we integrated different types of genetic evidence—including short-read (RNA sequencing (RNA-seq)) and long-read (isoform sequencing (Iso-Seq)) transcriptomic data from our bat species, gene projections by TOGA, aligned protein and cDNA sequences of related mammals, and de novo gene predictions (Fig. 1c). For the six bat species, we annotated between 19,122 and 21,303 protein-coding genes (Fig. 1e). Using the 4,104 mammalian genes in the ‘Benchmarking Universal Single-Copy Orthologs’ (BUSCO)22 set, we achieved 99.3–99.7% completeness (Fig. 1d); this shows that our assemblies and annotations are highly complete in protein-coding sequences (Extended Data Fig. 3a). Importantly, the completeness of our gene annotations is higher than available annotations of dog, cat, horse, cow and pig, and is only surpassed by those of human and mouse, which have received extensive manual curation (Fig. 1d, Supplementary Table 4). Thus, reference-quality genome assemblies combined with multiple types of gene evidence can generate high-quality and near-complete gene annotations of bats. This strategy can be extended to other species to improve genome assembly and annotation. All individual evidence and final gene sets can be visualized in the Bat1K genome browser (https://genome-public.pks.mpg.de) and downloaded from bds.mpi-cbg.de/hillerlab/Bat1KPilotProject/.
Genome sizes and transposable elements
At about 2 Gb in size, bat genomes are generally smaller than genomes of other placental mammals1 (which are typically 2.5–3.5 Gb). By annotating transposable elements in our genomes (Supplementary Note 3.3), we found that smaller genome size is related to lower transposable element content (Extended Data Fig. 3b). Recently inserted transposable elements in the bat genomes are extremely variable in terms of their type and number, as compared to other mammals (Extended Data Fig. 3c). In vespertilionid bats, we detected recent activity of rolling-circle and DNA transposon classes that have been largely dormant in other mammals for over 40 million years23. In summary, bats exhibit substantial diversity in transposable element content, and diverse transposable element classes show evidence of recent activity.
The phylogenetic origin of Chiroptera
Identifying the evolutionary origin of bats within the mammalian clade Laurasiatheria is a key prerequisite for any comparative analyses. However, the phylogeny of Laurasiatheria and—in particular—the origin of bats is a long-standing and unresolved phylogenetic question24, as multiple phylogenetic and systematic studies support alternative topologies25. These incongruent results have been attributed to the challenge of identifying the two (presumably short) internal branches that link the four key clades that diverged in the Late Cretaceous period26—that is, Chiroptera, Cetartiodactyla, Perissodactyla and (Carnivora + Pholidota) (Fig. 2, Supplementary Table 1).
Fig. 2: Phylogenetic analysis of Laurasiatheria.

We inferred a mammalian phylogram using a supermatrix of 12,931 concatenated genes and the maximum likelihood method of tree reconstruction (topology 1 in Supplementary Fig. 4). All nodes received 100% bootstrap support. The divergence of Chiroptera and Fereuungulata is highlighted with a red dot. The mammalian superordinal groups are denoted as follows: green, Laurasiatheria; blue, Euarchontoglires; orange, Xenarthra; yellow, Afrotheria.
We revisited this question, leveraging the high completeness of our gene annotations. We extracted a comprehensive dataset of 12,931 orthologous protein-coding genes using TOGA (21,468,943 aligned nucleotides in length and 7,911,881 parsimony-informative sites) and 10,857 orthologous conserved noncoding elements (5,234,049 aligned nucleotides and 1,234,026 parsimony-informative sites) from 48 mammalian genomes (Supplementary Note 4.1). We concatenated each of these datasets, identified the optimal model of sequence evolution with ModelFinder27 (Supplementary Table 6), inferred the species tree under maximum likelihood using the model-partitioned dataset with IQ-TREE28, rooted using Atlantogenata29, and obtained 1,000 bootstrap replicates to estimate branch support (Supplementary Note 4.2). For each protein-coding gene, we also compared the optimal gene tree inferred under maximum likelihood to the species tree, using the Robinson–Foulds distance to identify gene alignments with possibly incorrect homology statements30 (Supplementary Note 4.2.2). Our analysis of concatenated protein-coding genes identified the origin of bats within Laurasiatheria with 100% bootstrap support across the entire tree (Fig. 2). Omitting the top-scoring 100 and 500 genes (based on Robinson–Foulds distance) from the phylogenetic data produced the same tree topology, which suggests a small effect of homology error on the inferred phylogeny (Extended Data Fig. 4a, b). The tree inferred from the conserved noncoding element data identified the same phylogenetic position of bats, and differed from that shown in Fig. 2 only in the position of Perissodactyla (most closely related to Carnivora + Pholidota rather than to Cetartiodactyla) (Extended Data Fig. 5a). Therefore, both coding and noncoding regions of the genome support an early split between Eulipotyphla and the rest of the laurasiatherians (that is, Scrotifera); within Scrotifera, Chiroptera is the sister clade to Fereuungulata (Cetartiodactyla + Perissodactyla + Carnivora + Pholidota). This tree challenges the Pegasoferae hypothesis31, which groups bats with Perissodactyla, Carnivora and Pholidota, but agrees with a previous study of concatenated phylogenomic data32. Evolutionary studies of 102 retrotransposons, which considered incomplete lineage sorting, also supported a sister-group relationship between Chiroptera and Fereuungulata, but differ from the present study in supporting a sister-group relationship between Carnivora and Cetartiodactyla25,26.
Next, we considered potential phylogenetic problems with our data and methods. First, as the number of homologous sites increases in phylogenomic datasets, so too does bootstrap support33—sometimes even for an incorrect tree34. Therefore, we estimated the maximum likelihood support of each protein-coding gene (n = 12,931) for the 15 bifurcating trees that represent all possible topologies of the 4 key clades (Supplementary Fig. 4), with Eulipotyphla as the outgroup and the clade subtrees as in Fig. 2. We found that the best-supported tree is identical to the tree estimated from our concatenated protein-coding gene set (Fig. 2; tree 1 with 1,007/10,822 genes, described in Extended Data Fig. 5b and Supplementary Note 4.2.1) and shows the sister-group relationship between Chiroptera and Fereuungulata, which is also supported by the conserved noncoding elements (Extended Data Fig. 5a). Second, model misspecification (owing to a poor fit between phylogenetic data and the model of sequence evolution used) or loss of the historical signal35 can cause biases in phylogenetic estimates36. To assess whether these factors may have confounded our phylogenetic estimate (Fig. 2), we examined the 12,931 alignments of protein-coding genes for evidence of violating the assumption of evolution under homogeneous conditions (assumed by the phylogenetic methods used here) and for evidence that the historical signal has decayed almost completely (owing to multiple substitutions at the same sites; Supplementary Note 4.2). A total of 488 gene alignments, comprising 1st and 2nd codon sites from all 48 taxa (241,098 sites and 37,588 parsimony-informative sites), were considered optimal for phylogenetic analysis and were concatenated into a data matrix (Supplementary Table 7). Maximum likelihood trees were generated but resulted in an ambiguous phylogenetic estimate (Extended Data Fig. 5c, topology 13 in Supplementary Fig. 4, Supplementary Note 4.2). Therefore, we analysed these 488 genes individually using SVDquartets37, a single-site coalescence-based method that provides an alternative to phylogenetic analysis of a concatenation26. The inferred optimal tree again supported Chiroptera as sister group to Fereuungulata (Extended Data Fig. 5d, topology 1 in Supplementary Fig. 4), which is the most-supported position from all of our analyses and data partitions. Taken together, multiple lines of evidence from across the genome provide the highest support for Chiroptera as basal within Scrotifera (Fig. 2).
David Jebb, Zixia Huang, […]Emma C. Teeling
Nature volume 583, 578–584(2020)
With more than 1,400 species identified to date2, bats (Chiroptera) account for about 20% of all extant mammal species. Bats are found around the world and successfully occupy diverse ecological niches1. Their global success is attributed to an extraordinary suite of adaptations1 including powered flight, laryngeal echolocation, vocal learning, exceptional longevity and a unique immune system that probably enables bats to better tolerate viruses that are lethal to other mammals (such as severe acute respiratory syndrome-related coronavirus, Middle East respiratory syndrome-related coronavirus and Ebola virus)3. Bats therefore represent important model systems for the study of extended healthspan4, enhanced disease tolerance3, vocal communication5 and sensory perception6. To understand the evolution of bats and the molecular basis of these traits, we generated reference-quality genomes for six bat species as part of the Bat1K global genome consortium1 (http://bat1k.com) in coordination with the Vertebrate Genome Project (https://vertebrategenomesproject.org). These six bat genera span both major suborders Yinpterochiroptera (R. ferrumequinum and R. aegyptiacus) and Yangochiroptera (P. discolor, M. myotis, P. kuhlii, M. molossus)7 (Supplementary Table 1), represent extremes in bat longevity8, possess major adaptations in bat sensory perception1 and can better survive viral infections as compared with other mammals3.
Genome sequencing and assembly
To obtain genome assemblies of high contiguity and completeness, we developed pipelines that incorporate state-of-the-art sequencing technologies and assembly algorithms (Supplementary Notes 1, 2). In brief, we generated PacBio continuous long reads, 10x Genomics Illumina read clouds, Bionano optical maps and chromosome conformation capture (Hi-C) Illumina read pairs for each bat species (Fig. 1a). We assembled the PacBio reads into contigs using a customized assembler we termed DAmar, a hybrid of the earlier Marvel9, Dazzler and Daccord10,11 systems. Next, we used 10x Illumina read-cloud data to correct base errors and phase haplotypes, arbitrarily picking one haplotype in a phased block. Finally, we used Bionano optical maps and then Hi-C data to produce long-range scaffolds (Extended Data Fig. 1a, b, Supplementary Note 2). For all six bat species, this resulted in assemblies with high contiguity: 96–99% of each assembly is in chromosome-level scaffolds (N50 values of 92–171.1 Mb) (Fig. 1b, Extended Data Figs. 1c, d, 2a). When compared with previously published bat genomes12,13,14,15,16,17,18,19, our assemblies have higher contig N50 values—ranging from 10.6 to 22.2 Mb—and therefore, these are two orders of magnitude more contiguous than bat genomes assembled from short-read data alone (Fig. 1b, Extended Data Fig. 1d, Supplementary Tables 2, 3, Supplementary Note 2). Similarly, our genomes are estimated to have near-100% gene completeness (see ‘Gene annotation’) (Fig. 1c, d, Supplementary Table 4, Supplementary Note 3.1). Furthermore, analysis of 197 nonexonic ultraconserved elements20 indicates a high completeness of nonexonic genomic regions. This analysis also revealed three cases of marked sequence divergence of ultraconserved elements in vespertilionid bats—something rarely observed in these elements, which are highly constrained amongst placental mammals (Extended Data Fig. 2b–d, Supplementary Figs. 1–3, Supplementary Table 5, Supplementary Note 3.2). In summary, these genomes are comparable to the best reference-quality genomes that have so far been generated for any eukaryote with a gigabase-sized genome21.
Fig. 1: Assembly and annotation of the genomes of six bat species.
a, Genome assembly strategy and data produced. b, Comparison of assembly contiguity. N(x) % graphs show contig (left) and scaffold (right) sizes (y-axis), in which x per cent of the assembly consists of contigs and scaffolds of at least that size. Coloured lines refer to species with Bat1K assemblies. Extended Data Figure 1 labels all previous bat assemblies (shown as grey lines here). c, Overview of our strategy to annotate coding genes combining various types of evidence. cgp, comparative gene prediction. d, Comparison of the completeness of gene annotations, as a percentage of 4,101 mammalian genes from BUSCO. e, Total number of annotated genes.
Gene annotation
To comprehensively annotate protein-coding genes, we integrated different types of genetic evidence—including short-read (RNA sequencing (RNA-seq)) and long-read (isoform sequencing (Iso-Seq)) transcriptomic data from our bat species, gene projections by TOGA, aligned protein and cDNA sequences of related mammals, and de novo gene predictions (Fig. 1c). For the six bat species, we annotated between 19,122 and 21,303 protein-coding genes (Fig. 1e). Using the 4,104 mammalian genes in the ‘Benchmarking Universal Single-Copy Orthologs’ (BUSCO)22 set, we achieved 99.3–99.7% completeness (Fig. 1d); this shows that our assemblies and annotations are highly complete in protein-coding sequences (Extended Data Fig. 3a). Importantly, the completeness of our gene annotations is higher than available annotations of dog, cat, horse, cow and pig, and is only surpassed by those of human and mouse, which have received extensive manual curation (Fig. 1d, Supplementary Table 4). Thus, reference-quality genome assemblies combined with multiple types of gene evidence can generate high-quality and near-complete gene annotations of bats. This strategy can be extended to other species to improve genome assembly and annotation. All individual evidence and final gene sets can be visualized in the Bat1K genome browser (https://genome-public.pks.mpg.de) and downloaded from bds.mpi-cbg.de/hillerlab/Bat1KPilotProject/.
Genome sizes and transposable elements
At about 2 Gb in size, bat genomes are generally smaller than genomes of other placental mammals1 (which are typically 2.5–3.5 Gb). By annotating transposable elements in our genomes (Supplementary Note 3.3), we found that smaller genome size is related to lower transposable element content (Extended Data Fig. 3b). Recently inserted transposable elements in the bat genomes are extremely variable in terms of their type and number, as compared to other mammals (Extended Data Fig. 3c). In vespertilionid bats, we detected recent activity of rolling-circle and DNA transposon classes that have been largely dormant in other mammals for over 40 million years23. In summary, bats exhibit substantial diversity in transposable element content, and diverse transposable element classes show evidence of recent activity.
The phylogenetic origin of Chiroptera
Identifying the evolutionary origin of bats within the mammalian clade Laurasiatheria is a key prerequisite for any comparative analyses. However, the phylogeny of Laurasiatheria and—in particular—the origin of bats is a long-standing and unresolved phylogenetic question24, as multiple phylogenetic and systematic studies support alternative topologies25. These incongruent results have been attributed to the challenge of identifying the two (presumably short) internal branches that link the four key clades that diverged in the Late Cretaceous period26—that is, Chiroptera, Cetartiodactyla, Perissodactyla and (Carnivora + Pholidota) (Fig. 2, Supplementary Table 1).
Fig. 2: Phylogenetic analysis of Laurasiatheria.
We inferred a mammalian phylogram using a supermatrix of 12,931 concatenated genes and the maximum likelihood method of tree reconstruction (topology 1 in Supplementary Fig. 4). All nodes received 100% bootstrap support. The divergence of Chiroptera and Fereuungulata is highlighted with a red dot. The mammalian superordinal groups are denoted as follows: green, Laurasiatheria; blue, Euarchontoglires; orange, Xenarthra; yellow, Afrotheria.
We revisited this question, leveraging the high completeness of our gene annotations. We extracted a comprehensive dataset of 12,931 orthologous protein-coding genes using TOGA (21,468,943 aligned nucleotides in length and 7,911,881 parsimony-informative sites) and 10,857 orthologous conserved noncoding elements (5,234,049 aligned nucleotides and 1,234,026 parsimony-informative sites) from 48 mammalian genomes (Supplementary Note 4.1). We concatenated each of these datasets, identified the optimal model of sequence evolution with ModelFinder27 (Supplementary Table 6), inferred the species tree under maximum likelihood using the model-partitioned dataset with IQ-TREE28, rooted using Atlantogenata29, and obtained 1,000 bootstrap replicates to estimate branch support (Supplementary Note 4.2). For each protein-coding gene, we also compared the optimal gene tree inferred under maximum likelihood to the species tree, using the Robinson–Foulds distance to identify gene alignments with possibly incorrect homology statements30 (Supplementary Note 4.2.2). Our analysis of concatenated protein-coding genes identified the origin of bats within Laurasiatheria with 100% bootstrap support across the entire tree (Fig. 2). Omitting the top-scoring 100 and 500 genes (based on Robinson–Foulds distance) from the phylogenetic data produced the same tree topology, which suggests a small effect of homology error on the inferred phylogeny (Extended Data Fig. 4a, b). The tree inferred from the conserved noncoding element data identified the same phylogenetic position of bats, and differed from that shown in Fig. 2 only in the position of Perissodactyla (most closely related to Carnivora + Pholidota rather than to Cetartiodactyla) (Extended Data Fig. 5a). Therefore, both coding and noncoding regions of the genome support an early split between Eulipotyphla and the rest of the laurasiatherians (that is, Scrotifera); within Scrotifera, Chiroptera is the sister clade to Fereuungulata (Cetartiodactyla + Perissodactyla + Carnivora + Pholidota). This tree challenges the Pegasoferae hypothesis31, which groups bats with Perissodactyla, Carnivora and Pholidota, but agrees with a previous study of concatenated phylogenomic data32. Evolutionary studies of 102 retrotransposons, which considered incomplete lineage sorting, also supported a sister-group relationship between Chiroptera and Fereuungulata, but differ from the present study in supporting a sister-group relationship between Carnivora and Cetartiodactyla25,26.
Next, we considered potential phylogenetic problems with our data and methods. First, as the number of homologous sites increases in phylogenomic datasets, so too does bootstrap support33—sometimes even for an incorrect tree34. Therefore, we estimated the maximum likelihood support of each protein-coding gene (n = 12,931) for the 15 bifurcating trees that represent all possible topologies of the 4 key clades (Supplementary Fig. 4), with Eulipotyphla as the outgroup and the clade subtrees as in Fig. 2. We found that the best-supported tree is identical to the tree estimated from our concatenated protein-coding gene set (Fig. 2; tree 1 with 1,007/10,822 genes, described in Extended Data Fig. 5b and Supplementary Note 4.2.1) and shows the sister-group relationship between Chiroptera and Fereuungulata, which is also supported by the conserved noncoding elements (Extended Data Fig. 5a). Second, model misspecification (owing to a poor fit between phylogenetic data and the model of sequence evolution used) or loss of the historical signal35 can cause biases in phylogenetic estimates36. To assess whether these factors may have confounded our phylogenetic estimate (Fig. 2), we examined the 12,931 alignments of protein-coding genes for evidence of violating the assumption of evolution under homogeneous conditions (assumed by the phylogenetic methods used here) and for evidence that the historical signal has decayed almost completely (owing to multiple substitutions at the same sites; Supplementary Note 4.2). A total of 488 gene alignments, comprising 1st and 2nd codon sites from all 48 taxa (241,098 sites and 37,588 parsimony-informative sites), were considered optimal for phylogenetic analysis and were concatenated into a data matrix (Supplementary Table 7). Maximum likelihood trees were generated but resulted in an ambiguous phylogenetic estimate (Extended Data Fig. 5c, topology 13 in Supplementary Fig. 4, Supplementary Note 4.2). Therefore, we analysed these 488 genes individually using SVDquartets37, a single-site coalescence-based method that provides an alternative to phylogenetic analysis of a concatenation26. The inferred optimal tree again supported Chiroptera as sister group to Fereuungulata (Extended Data Fig. 5d, topology 1 in Supplementary Fig. 4), which is the most-supported position from all of our analyses and data partitions. Taken together, multiple lines of evidence from across the genome provide the highest support for Chiroptera as basal within Scrotifera (Fig. 2).