|
|
Post by Admin on Jan 2, 2021 4:58:39 GMT
Introduction
It is now well-established that gene flow occurred among various ancient hominin groups over the past several hundred thousand years. The most well-studied example of archaic gene flow is the interbreeding that occurred when humans migrated out of Africa and came into contact with Neanderthals in Eurasia roughly 50,000 years ago [1, 2]. This event left a genetic legacy in modern humans that persists today; indeed, 1–3% of the DNA of living humans descended from non-African populations, such as Europeans or East Asians, can be traced to Neanderthals [3]. We also now know that an extinct sister group to the Neanderthals, the Denisovans, intermixed with early modern humans in Asia, leaving behind genomic fragments that comprise 2–4% of the DNA of modern Oceanian humans [4–6].
Many other admixture events have been proposed, creating a complex web of ancient hominin interactions across time and space. These events include gene flow between Neanderthals and Denisovans (Nea↔Den) [2, 7]; between Neanderthals and ancient humans who left Africa over 100 thousand years ago(Hum→Nea) [8]; between an unknown diverged or “super-archaic” hominin (possibly Homo erectus) and Denisovans (Sup→Den) [2, 9]; and between other unknown archaic hominins and various human populations in Africa (Sup→Afr) [10–12]. (In the above notation, used throughout this paper, the arrowheads indicate the inferred direction of gene flow, up to the limits of the data and inference method.).
As the network of interactions grows more complex, it becomes more difficult to test for gene flow or identify introgressed regions using standard methods [13]. In one prominent example, a positive value has been observed for a “D statistic” based on Neanderthals, Denisovans, African modern humans, and the chimpanzee reference genome [2], indicating an excess of allele sharing between Neanderthals and African humans, as compared with Denisovans and Africans. However, this observation potentially could be explained by gene flow between Neanderthals and Africans, boosting their allele sharing, or from super-archaic hominins into Denisovans, reducing Denisovan/African allele sharing. Notably, the D statistic is highest at sites where the derived allele is fixed or at high-frequency in Africans, implying that many of the excess shared alleles are quite old, and supporting the scenario of super-archaic introgression into Denisovans [2]. At the same time, however, many genomic windows with low Neanderthal-Africa divergence nevertheless have high Neanderthal-Denisovan divergence, which is best explained by Hum→Nea gene flow [8]. In this case, each hypothesis has support from multiple studies [8, 9, 14], suggesting that both the Hum→Nea and Sup→Den events likely occurred. But more generally, it can be difficult to resolve conflicting evidence of this kind using summary statistics alone.
Furthermore, even when there is strong evidence for the existence of gene flow, it remains challenging to identify particular introgressed genomic regions. This problem is considerably more difficult for the Sup→Den and Hum→Nea events than for the Nea→Hum or Den→Hum events, both because they are hypothesized to have occured much longer ago [2, 8], causing the introgressed haplotypes to be more broken up by recombination, and because no sequence is available for the super-archaic hominin. The small numbers of sequenced Neanderthal and Denisovan genomes are a further limitation. Current approaches for predicting introgressed regions, including the conditional random field (CRF) [3, 6] and the S* statistic [15, 16] (as well as the variant Sprime [17]), are not ideal for detecting these ancient events, having been optimized for the easier problem of identifying more recent introgression into humans. Furthermore, these methods only use a few summary statistics. When the genomic signal is more subtle, it may be necessary to incorporate all the data using a model-based method.
In this paper, we describe a powerful and highly general new method, called ARGweaver-D, that samples ancestral recombination graphs (ARGs) [18–20] conditional on a generic demographic model, including population divergence times, size changes, and migration events. After introducing ARGweaver-D, we present simulation studies showing it can successfully detect Nea→Hum introgression, even when using a limited number of genomes, and that it also has power for older migration events, including Hum→Nea, Sup→Den, and Sup→Afr events. Finally, we apply this method to modern-day Africans and ancient hominins, and characterize both new and previously reported cases of introgression between humans and archaic hominins.
|
|
|
|
Post by Admin on Jan 2, 2021 22:54:44 GMT
Results ARGweaver-D can sample ARGs conditional on an arbitrary demographic model ARGweaver-D is a major extension of ARGweaver [21] that can infer ARGs conditional on a user-defined population model. This model can consist of an arbitrary number of present-day populations that share ancestry in the past, coalescing to a single panmictic population by the most ancestral discrete time point. Population sizes can be specified separately for each time interval in each population. Migration events between populations can also be added; they are assumed to occur instantaneously, with the time and probability defined by the user. Typically, a suitable demographic model for use with ARGweaver-D can be obtained from the literature or by applying a method such as ∂a∂i [22] or G-PhoCS [14] in a preprocessing step. As previously described [21], ARGweaver is a Markov chain Monte Carlo (MCMC) sampler, in which each iteration consists of removing a branch from every local tree in the ARG (“unthreading”), followed by the “threading” step, which resamples the coalescence points for the removed branches. This threading step is the core algorithmic operation in ARGweaver, and is accomplished using a hidden Markov model (HMM), in which the set of states at each site represents all possible coalescence points in the local tree. In ARGweaver (which assumes a single panmictic population), each of these states is defined by a branch and time. However, in ARGweaver-D, each state has a third property, which we call the “population path.” The population path represents the set of populations assigned to the new branch throughout its time span. The modified threading algorithm is illustrated and further described in Fig 1, and additional details are provided in S1 Text. ARGweaver-D is built into the ARGweaver source code, which is available at: github.com/CshlSiepelLab/argweaver.  Fig 1. Illustration of the “threading” operation under a model with two populations and a single migration band. Horizontal dashed lines indicate time points for coalescence and recombination. User-specified migration and population divergence times are rounded to the nearest “half time-point”. Migration occurs instantaneously with a user-specified prior rate pM (1% in this work). Here, one haploid lineage has been removed and is being rethreaded (dotted black line), while the other three (solid black lines) are held fixed. Dots on top of each lineage indicate potential coalescence points with the new branch, with black indicating a population path with no migration, and blue indicating a migrant population path. Recombination events (red Xs) occur immediately before positions b2, b3, and b4, with the dotted red line indicating recoalescence of the broken branch. Notice that the newly threaded lineage enters an introgressed state at position b2 and leaves it at b4. After running ARGweaver-D, it is straightforward to identify predicted introgressed regions; they are encoded in each sampled ARG as lineages that follow a migration band. By examining the set of ARGs produced by the MCMC sampler, ARGweaver-D can compute posterior probabilities of introgression across the genome. As will be seen below, this computation can be done in a variety of ways—for example, as overall probabilities of migration anywhere in the tree, or probabilities of a specific sampled genome having an ancestral lineage that passes through a particular migration band. In addition, for a diploid individual, probabilities of heterozygous or homozygous introgression can be separately computed. Throughout this paper, we use a threshold of p ≥ 0.5 to define predicted introgressed regions, and compute total rates of called introgression for a diploid individual as an average across each haploid lineage. |
|
|
|
Post by Admin on Jan 3, 2021 23:32:51 GMT
ARGweaver-D can accurately identify archaic introgression in modern humans We first performed a set of simulations to assess the power and accuracy of ARGweaver-D in identifying Neanderthal introgression into modern humans. These simulations realistically mimic human and archaic demography, as well as variation in mutation and recombination rates (see Methods). We compared the performance with the CRF algorithm [3]; Fig 2 summarizes the results. Overall, ARGweaver-D has improved performance over the CRF, with improvements being subtle for long segments but becoming more pronounced for shorter segments. This gain in power occurs despite the fact that the CRF used a much larger panel of African samples than was used by ARGweaver-D. (CRF used 43 African individuals, but ARGweaver-D used only 2 to save computational cost; both methods used 2 diploid Neanderthals). 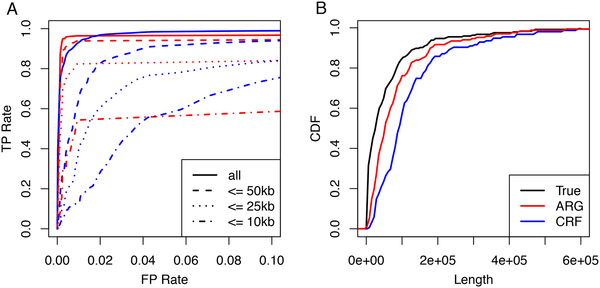 Fig 2. Performance on Nea→Hum simulations. A: Receiver operating characteristic (ROC) curves showing basewise performance of ARGweaver-D (red) and the CRF (blue) on simulated data. The two methods predicted introgression in the same simulated European individuals, but the CRF made use of the full reference panel (43 diploid Africans), whereas ARGweaver-D only used only two diploid Africans. Different line patterns correspond to different maximum segment lengths. B: Length distributions of real and predicted introgressed regions for data in panel A. Next, we predicted introgressed regions in two non-African human samples from the Simons Genome Diversity Panel (SGDP), a European (Basque) and a Papuan. The ARGweaver-D model used is illustrated in Fig 3; but only the “Recent migration” bands were included. We compared to calls from the CRF method, although it is important to note that the two methods were run with different data sets: ARGweaver-D again used many fewer African individuals (2) than CRF (43), but in this case ARGweaver-D used both the Altai and Vindija Neanderthal, whereas the CRF results were obtained with only the Altai. Because the Vindija Neanderthal is a better proxy for the introgressing Neanderthal, ARGweaver-D likely has better power to detect Neanderthal introgression in this comparison. The results are summarized in Fig 4. Overall, the two methods identify many overlapping regions, but each method also produces a substantial fraction not called by the other method (between 15-40%). Both methods show a strong depletion of introgression on the X chromosome, especially in the Basque individual.  Fig 3. Population model assumed for inference using ARGweaver-D. Population sizes (constant per branch) are shown in parentheses. The model is invariant to the population sizes of the single-lineage chimpanzee and super-archaic hominin branches. Migration events are shown by arrows between populations; solid arrows are used for previously proposed events and dashed arrows for new events. All parameters except tmig and tdiv are held constant at the specified values. |
|
|
|
Post by Admin on Jan 4, 2021 6:35:11 GMT
Fig 4 highlights that more Neanderthal than Denisovan sequence is detected in the Papuan, despite that Papuans are expected to have a higher level of introgression from Denisovans compared to Neanderthal [23]. This observation can be explained by lower power to detect Denisovan introgression, due to the different levels of divergence between introgressing archaic individuals compared to sequenced archaic individuals; previous literature has shown that the sequenced Denisovan is highly diverged from the introgressing Denisovan [2], and that the Vindija Neanderthal is more closely related to the introgressing Neanderthal than the Altai Neanderthal [9]. In fact, this information is embedded in the ARGs and is reflected in the coalescence times between humans and archaic individuals in regions where these humans are introgressed. For example, the average coalescence time for introgressed lineages between Vindija and Papuan is 262kya; for Altai and Papuan is 326kya, and for Deniosvan and Papuan is 396ka. For the Basque individual, we also see a smaller average coalescence time with the Vindija (236kya) than the Altai (292kya).  Fig 4. Average nucleotide coverage of predicted introgressed regions in four modern human individuals. Colors indicate ARGweaver-D predictions and stripes indicate CRF predictions; colors and stripes together indicate regions called by both methods. The CRF calls were only produced for non-African individuals, so for Mandenka and San, only ARGweaver-D results are shown. Genome sequences were from the Simons Genome Diversity Panel (SGDP). Notably, ARGweaver-D calls nearly 0.5% introgression from the Neanderthal into each of the African individuals. These calls are likely explained by a combination of false positives and back-migration into Africa from Europe. However, another possibility is that some regions introgressed into Neanderthals from ancient humans [8] may be assigned the wrong direction by ARGweaver-D. With few samples, it can be difficult to determine the direction of migration between two sister populations. Indeed, when we simulate migration in both directions, but perform inference in ARGweaver-D using only a Nea→Hum migration band, we find that ∼8% of Hum→Nea bases are identified as Nea→Hum (See S1 Text). This difficulty in resolving directionality is our primary motivation for excluding non-African samples in our later analysis of older migration events (see next section). |
|
|
|
Post by Admin on Jan 4, 2021 23:19:45 GMT
ARGweaver-D can detect older introgression events We next carried out a series of simulations to assess ARGweaver-D’s power to detect more ancient introgression events. For this purpose, we simulated the modern human samples using a model of African human population history, and as such did not include the migration from Neanderthals or Denisovans into non-African humans. These simulations included three migration events: one from modern humans into Neanderthals (Hum→Nea), one from a “super-archaic” unsampled hominin into Denisovans (Sup→Den), and one from the super-archaic hominin into Africans (Sup→Afr). (Note that although both the Sup→Afr and Sup→Den events are simulated from the same super-archaic population, they are meant to represent introgression from any unsampled, diverged hominin population, not necessarily the same one.) These simulations included many realistic features: ancient sampling dates for the archaic hominins, variation in mutation and recombination rates, randomized phase, and levels of missing data modeled after the SGDP and ancient genomes that we use for analysis (see Methods). Each set of simulations contained all three types of migration, and ARGweaver-D was applied with multiple migration bands, with the goal of detecting all migration events in a single run. We analyzed these data sets with ARGweaver-D using the model depicted in Fig 3, but including only the “old migration” bands. As we do not have good prior estimates for the migration time (tmig) or super-archaic divergence time (tdiv), we tried four values of tmig (50kya, 150kya, 250kya, 350kya) and two values of tdiv (1Mya, 1.5Mya). We generated data sets under all 8 combinations of tmig and tdiv, and then analyzed each data set with ARGweaver-D under all 8 models, in order to assess the effects of model misspecification on the inference. We find that the power to detect super-archaic introgression is clearly higher when the divergence is higher (tdiv = 1.5Mya), but, as expected, the choice of tdiv does not affect the power to detect Hum→Nea introgression (Fig 5). In addition, for all events, we find that power decreases as the true migration time increases (from top to bottom in Fig 5).  Fig 5. Simulation results. Each panel represents a set of simulations generated with a different value of tmig (rows) and tdiv (columns). Within each panel, each bar gives the basewise true positive rate for a particular migration event, using a posterior probability threshold of 0.5. The color of each bar represents the value of tmig assumed for the inference model (orange = 50kya, red = 150kya, purple = 250kya, blue = 350kya). Shaded bars represent an assumption of tdiv = 1.5Mya for inference, whereas solid bars represent tdiv = 1.0Mya. Because the archaic hominin fossils are older than 50kya, results for tmig = 50kya (top) are only applicable for introgression into humans. Looking at each group of bars in Fig 5 shows the results on the same simulated data, using different parameters in the ARGweaver-D model. The blue and purple bars tend to be higher, showing that power is often better when an older migration time is used in the model, even when the true migration time is recent. Similarly, power is often better for detecting super-archaic introgression when tdiv is set to 1Mya (solid), rather than 1.5Mya (striped), in the ARGweaver-D model. Overall, ARGweaver-D has reasonably good power to detect super-archaic introgression when the divergence time is old, but power is more limited as the divergence time decreases. The power to detect Sup→Afr is always lower than the power to detect Sup→Den, as the African population size is much larger, making introgression more difficult to distinguish from incomplete lineage sorting. For the Hum→Nea event, we have around 50% power if the migration time is 150kya, and around 30% power when it is 250kya. False positive rates were < 1% at a posterior probability threshold of 0.5 (S1 Fig). In addition, two additional migration bands in the ARGweaver-D model served as controls for false positive predictions: one from the super-archaic population to Neanderthal (Sup→Nea), and another from humans into Denisova (Hum→Den). Events in these bands were also called at < 1% for all models. In addition, the rate of mis-classification of migration type was very low for all event types (S2 Fig). In particular, the model can easily distinguish between Hum→Nea and Sup→Den events, despite that both produce similar D statistics [8, 9]. Notably, the simulated data sets were generated with a human recombination map, but the ARGweaver-D model assumed a simple constant recombination rate (S1 Text). We observe somewhat better performance when ARGweaver-D uses the true recombination map, but it is unrealistic to assume the true map is known for the archaic hominins. In addition, we find that the performance of the method does not improve as more African samples are added, so we focus here on an analysis with two African samples only (four haploid genomes). In a separate simulation study, we find that the method is reasonably robust to errors in the assumed population size, although the false positive rate does increase if the population size of the population receiving migration is underestimated by more than 20%, with FP rates approaching 5% for Hum→Nea when the assumed Nenderthal population size is 25% of the true value. Further details of these simulation studies are provided in S1 Text. |
|

