|
|
Post by Admin on Feb 9, 2021 22:38:30 GMT
 Fig. 3 Evidence of association, Denisovan introgression, and selection in the WARS2-TBX15 region. (A) Association P values (right y-axis) with lip thickness ratio 2 and the location and frequency (left y-axis) of introgressed haplotypes inferred in the CANDELA data. Filled dots indicate the SNPs retained for introgression analysis. Dots are plotted accordingly to the significance of their association and have been colored to reflect r2 with the index SNP for association with that trait (rs3790553). The location of the index SNPs associated previously with ear morphology (15), chin dimples (7), and forehead shape (10) is indicated. SNPs associated with facial features in the European meta-analysis (18) are outside the region shown here. The green bins show the introgressed region, and their height displays the allelic frequency and their shade refers to the confidence level at which the tract was called (pale, 20%; dark, 90%). The dashed lines denote the bounds of the Denisovan introgression region previously estimated with the same approach used here (green) (31) or using a Conditional Random Field approach (purple) (32). (B) Standardized PBS scores obtained for genotyped SNPs when contrasting Native Americans (NAM) to CHB + CEU (red triangles) or Greenland Inuits (GI) to CHB + CEU (blue triangles). The location of the TBX15 and WARS2 genes is indicated by black arrows along with various annotations inferred from human embryonic tissue (27) (the color key for combined craniofacial annotations can be found in table S6).  Fig. 4 Features of four genomic regions newly associated with face features in the CANDELA sample and replicating in Europeans. Regional association P values (index SNP is labeled) are shown at the top. Regulatory annotations from human embryonic tissue (27) (combined chromatin states at various Carnegie stages and craniofacial-specific enhancers and superenhancers; the color key for combined craniofacial annotations is in table S6) are provided below each association plot. A heatmap of pairwise LD (r2) in the region is shown at the bottom of each panel. Similar plots for the other previously unidentified regions, detected in the CANDELA sample but not replicating in the European meta-analysis, are shown in Supplementary Notes. Association in 1p12 involves SNPs in a region with evidence of adaptive introgression from archaic humans SNPs in 1p12 overlapping the WARS2/TBX15 gene region were associated here with two measures of lip thickness ratio [Figs. 1 and 2; lip thickness ratio referring to the thickness of the upper lip relative to total lip thickness: upper lip thickness/(upper + lower lip thickness); see table S1]. This genomic region has been previously reported to be associated with features of the outer ear (15) and face (7, 10, 18), but this is the first time it is associated with lip thickness. SNPs in 1p12 have also been implicated in GWASs of anthropometric traits and fat distribution (29). The WARS2/TBX15 gene region has been reported to show a strong signal of selection in Greenland Inuit, as evidenced by extreme Population Branch Statistics (PBS) values (30). This observation has been interpreted as resulting from adaptation to a low environmental temperature (30). Furthermore, the selection signal in this region was shown to overlap with a tract of introgression from archaic humans, most likely Denisovans (31), pointing to the possibility of adaptive introgression. We evaluated evidence for Denisovan introgression in the WARS2/TBX15 gene region in the CANDELA data using a Hidden Markov Model approach (31). We inferred two overlapping introgressed tracts called at confidence levels 20 to 99%, with decreasing size (Fig. 3 and fig. S3). At 99% confidence, the largest and most frequent (34%) introgression tract inferred in the CANDELA data almost exactly matches the 28-kb tract previously inferred in Greenlandic Inuits and various Asian and Native American populations (31). This tract is included within a longer tract of introgression reported previously using an alternative (Conditional Random Field) approach (Fig. 3) (32). We also estimated PBS values in Native American populations related to the ancestral populations contributing to admixture in Latin Americans (14). As previously observed in Greenlandic Inuit (30), we found extreme PBS values in that region, peaking in the tract of Denisovan introgression (Fig. 3). Notably, the SNPs showing significant association with lip thickness in the CANDELA data overlap with the signal of selection and the tract of Denisovan introgression (Fig. 3). The index SNP (rs3790553) is included in the introgressed haplotype inferred at 50% confidence. By contrast, SNPs previously associated with ear morphology (15) and facial features (10, 18) are located over 90 kb away from the tract of Denisovan introgression and have an association r2 with this tract < 0.23 (Fig. 3). Furthermore, the derived allele at rs3790553 is carried by 91% of the introgressed haplotypes, while the ancestral allele of that SNP is carried by 99.7% of the chromosomes in which the introgression tract was not inferred. This level of association was not seen for any of the index SNPs reported in previous GWAS implicating the WARS2/TBX15 region. We examined the effect of the Denisovan haplotype on the profile traits evaluated in the CANDELA sample and found five significant associations (P values < 10−3; fig. S4). Among these, a positive effect is seen on lip thickness ratio and upper lip protrusion, while a negative effect is seen on lower lip thickness and protrusion. There is also a positive effect (albeit not significant) on upper lip thickness. These opposite effects of the Denisovan haplotype on the upper v. lower lips effectively add up in the lip thickness ratio measures, consistent with them showing strongest associations. Features of loci not significantly associated in previous face morphology GWASs As shown in Fig. 2, among the 32 genomic regions showing association, 9 have not been genome-wide significant in previous GWASs of nonpathological facial features. We sought replication of the index SNPs from these nine regions in a recent facial morphology GWA meta-analysis that included data for over 10,000 Europeans (18). Traits examined in the meta-analysis consist of pairwise distances between 13 landmarks placed on 3D images. Although we placed in the CANDELA 2D photos the same nine right-profile landmarks used in the European meta-analysis, only 3 of the 59 measurements we obtained correspond to distances included in the European meta-analysis. Considering this limited overlap, we examined association P values in the full set of 36 right-profile distances measured in the European meta-analysis (Table 1). One of our nine index SNPs is not polymorphic in Europeans; therefore, we could not evaluate replication for this SNP. Of the eight index SNPs that are polymorphic in Europeans, four showed replication P values exceeding a Bonferroni-corrected threshold for significance for at least one facial distance (Table 1). Although most of the distances with significant association in the European meta-analysis do not correspond to those showing association in the CANDELA data, they often share landmarks. For example, SNP rs75976055 is associated here with a measure of columella size incorporating the Subnasale landmark (table S1), and the strongest replication P value (5 × 10⁻⁵) was observed in the European meta-analysis for the distance between the Subnasale and Labial inferius landmarks. Figure 4 shows regional association plots for the four previously unidentified facial morphology loci with evidence of replication in the European meta-analysis. In 3q13.32, SNPs in the IGSF11 (immunoglobulin superfamily member 11) region show significant association with nose roundness (and suggestive association with columella inclination). The index SNP in this region (rs7633584) is located within an intron of IGSF11. IGSF11 is a cell adhesion molecule playing a role in osteoclast differentiation and bone resorption (33), but no association with morphological features has been reported previously. In 7p21.1, an SNP significantly associated with columella inclination is intronic to HDAC9 (Histone deacetylase 9). HDAC9 is an enzyme involved in gene expression regulation through histone acetylation. SNPs in this gene region have been suggestively associated with the vertical position of the sublabial sulcus, relative to the central midface (5). The region of association identified here overlaps with two craniofacial-specific enhancers (Fig. 4). Although HDAC9 does not appear to be expressed in developing mouse craniofacial tissues, many enhancers located within HDAC9 have been shown to form long-range interactions with the neighboring TWIST1 gene during the development of limbs and pharyngeal arches in mice (34). TWIST1 is a transcription factor important in limb and craniofacial development (34), and mutations of TWIST1 have been shown to result in Saethre-Chotzen syndrome, defined by its facial and cranial gestalt (OMIM #101400). These observations suggest that the effect of SNPs showing association with profile traits in the CANDELA individuals could be mediated through regulatory elements within HDAC9 controlling TWIST1 expression during craniofacial development. SNPs in 7q31.31 associated with jaw protrusion overlap CPED1 (Cadherin-like and PC-esterase domain containing 1), a gene of unknown function. The index SNP in this region (rs6950680) is intronic to CPED1, with a number of regulatory elements active in embryonic craniofacial tissue being present within CEPD1 (Fig. 4). Variants in this region have been associated with height (35) and bone mineral density (36). Of potential relevance, the WINT16 gene is located less than 30 kb downstream of CEPD1. WINT signaling, in concert with other morphogenetic signaling pathways, plays critical roles in embryonic development, including midfacial morphogenesis, and has been implicated in orofacial clefting (37). Last, in 8q22.2, we find that 597 SNPs overlapping VPS13B (vacuolar protein sorting 13 homolog B) are significantly associated with columella size. Mutations in VPS13B have been reported to cause Cohen syndrome (OMIM #216550), a recessive multisystem disorder with characteristic facial dysmorphism that can include a high nasal bridge, prominent nose, short philtrum, and malar hypoplasia. Below, we describe mouse follow-up analyses we carried out for this gene region. The five loci with no evidence of replication in the European meta-analysis include genes and regulatory features of potential relevance for craniofacial development. These are discussed in Supplementary Notes. |
|
|
|
Post by Admin on Feb 10, 2021 4:04:27 GMT
Mouse follow-up of the VPS13B hit Since nose development and structure in humans and mice share features and as soft tissues constituting the nose are tightly integrated with the nasal aperture, we conducted geometric morphometric analyses of the facial region of mice skulls to evaluate the potential impact of Vps13b variants. We first carried out geometric morphometric analyses in a recently described mouse Vps13b-KO model of Cohen syndrome (38), compared to matched wild-type (WT) controls (Supplementary Notes). We found that Vps13b genotype has a significant phenotypic effect and explains 11% of the total Procrustes variance in facial and palatal shape (Supplementary Notes and table S3-2). The magnitude of this effect is two times stronger in males (Procrustes distance = 0.030) than in females (Procrustes distance = 0.017). The changes mainly involve the nasal region, resulting in an elongation and widening of the nasal tip and the dorsal aspect of the maxillae (Fig. 5A and movie S1). Concomitant with these changes, there is a narrowed and elevated palate.  Fig. 5 Vps13b and mouse craniofacial shape. (A) Shape changes in the Vps13b KO mutant male mice relative to WT. Effect is predicted according to the expected marginal means at the populational average centroid size. Darker colors represent strong positive (blue) or negative (brown) deviation from the WT, given in Procrustes distance. Positive distance represents expansion from the WT, whereas negative distance represents contraction from the WT. Mesh warping is amplified by a factor of 2 to facilitate the visualization (see also movie S1). (B) Regional association plot for the VPS13 homologous region in chromosome 15 among outbred mice. Significantly associated SNPs are shown as green dots (FDR < 5%). Ensembl annotations for genes (brown) and enhancers active in embryonic facial prominence (orange) are shown at the top. (C) Phenotypic effect associated with allele dosage at the Vps13b index SNP among outbred mice. Skull zones with an expansion/contraction relative to the mean shape are shown in brown/blue (see also movie S2). To facilitate visualization, shape variation has been magnified by ×20. In addition to characterizing craniofacial variation in the Vps13b-KO mice, we reexamined data from a GWAS on cranioskeletal variation in outbred mice (39). The published analysis did not report a significant association of univariate craniofacial phenotypes with SNPs in the Vps13b region (39). However, reanalyzing these data using a multivariate mixed model, we found that 22 SNPs in a 1.82-Mb region of chromosome 15 overlapping Vps13b (Fig. 5B) are significantly associated with craniofacial variation (FDR < 5%). SNPs in this region affect the protrusion/shrinkage of the nasal region, in a similar manner as seen for the Vps13b-KO mice (Fig. 5C and movie S2). |
|
|
|
Post by Admin on Feb 10, 2021 20:27:43 GMT
DISCUSSION
Craniofacial form is largely determined during embryonic development through the concerted actions of cranial neural crest cells, mesodermally derived mesenchyme, and ectoderm. The cranial neural crest cell population is the major driver of facial outgrowth and differentiates into the cartilage and bony elements of the face (among other tissues) that principally determine facial structure (40). There has been considerable interest in understanding the role that cranial neural crest genes play in species-specific differences in facial structure, much of which appears to be determined by genetic variation in enhancers that regulate key genes in this cell type (41). Furthermore, neural crest cell–dependent facial form is dictated early in development by signals received from the developing forebrain as well as the overlying ectoderm (42), implying that any a priori assumptions about tissue-specific functions of genes controlling variation in facial form should be avoided. GWASs provide a hypothesis-free approach to pinpointing important genetic variation underlying population-level craniofacial shape differences.
Our previous study on the CANDELA cohort focused on 14 categorical traits scored onto a few discrete categories. Here, we consider a much larger set of phenotypes (a total of 59), and we assessed these quantitatively, based on landmarks and semi-landmarks placed on face profile pictures. Although examined on the same study cohort, the different phenotyping approach used here adds substantial power to the GWA analyses. Statistically, quantitative traits are more informative than categorical ones. Focusing the landmarking on the profile also has several advantages. The landmarks are relatively prominent and easy to assess, and the process is less susceptible to external factors, such as head rotation. In addition to the main landmarks, we also use a set of semi-landmarks to capture in fuller detail variation along the facial contour.
The number of previously reported face GWAS hits replicated here, despite major differences across studies in phenotyping approaches and phenotype definitions, is noticeable: a total of 23, including 7 of the regions that have been repeatedly associated with facial features in previous studies. The fact that we detect significant genetic effects at genome regions previously associated with facial features different from those examined here is consistent with the view that many loci involved in craniofacial development have various effects on facial morphology and that certain facial traits can be affected by overlapping sets of genes (10). Although stochastic effects and differences in facial phenotype characterization across studies could explain the lack of replication of some of the loci associated previously, the genetic architecture of facial morphology in human populations probably also plays a role. Evidence for the impact of genetic structure on facial variation across human populations was observed here in the form of an effect of continental and subcontinental genetic ancestry on profile features, pointing to the existence of trait alleles with differentiated frequencies between continents, as well as between different areas within continents. A prominent example of such continental differentiation in trait allele frequency is the EDAR region associated here (and in the literature) with measures of facial flatness and jaw protrusion (4). The associated EDAR variants are essentially absent in Europe, and therefore, this effect is not detectable in Europeans (4). Similarly, SNPs associated at one of the previously unidentified genome regions identified here are not polymorphic in Europeans, and therefore, we could not test for replication in the European meta-analysis. This variable genetic architecture of facial features across human populations emphasizes the need for further studies in non-Europeans for a fuller characterization of the genetic basis of facial variation in modern humans.
Natural selection appears to have played a major role in the evolution of craniofacial morphology in many mammalian species, particularly in relation to various environmental adaptations, including diet (19). Natural selection has also long been proposed to have played a role on the evolution of the human face (20). However, thus far, there is little evidence for genomic signatures of selection at human face morphology loci (18). From this perspective, it is interesting that we find an overlap of the signal of association of lip thickness ratio at the WARS2/TBX15 region with a signal of selection, also coinciding with a tract of Denisovan introgression (30, 31). There is increasing evidence for adaptive archaic introgression in modern humans, particularly for pigmentation and immune response genes, and for the phenotypic effects of these introgressed tracts being mediated through their regulatory impact on the genome (43). It has thus been suggested that the strong signal of selection seen in the WARS2/TBX15 region could have been driven by adaptation to a cold environment (30). Archaic humans are thought to have been adapted to cold conditions by the time they encountered modern humans migrating from less extreme latitudes, and this could have favored adaptive introgression around WARS2/TBX15 (31). Consistent with the possibility of adaptive pressure to a cold environment, association studies have implicated the WARS2/TBX15 region in body fat distribution, height, and waist-hip ratio (29). However, the SNPs associated with these body features do not overlap with the tract of Denisovan introgression (31). Similarly, SNPs in 1p12 previously associated with ear and face features are located some distance away from the tract of introgression (10, 15, 18) and are not in LD with it (Fig. 3). The Denisovan haplotype has a low frequency in Europeans and a high frequency in East Asians and is nearly fixed in Native Americans (31), and we observe it at a frequency of ~50% in the CANDELA data (in line with the European/Native American admixture of these samples), thus facilitating the detection of any associated phenotypic effects. It is possible that the facial trait association that we see in the CANDELA data for SNPs in 1p12 could relate to an impact of variants in this region on facial fat distribution (perhaps as part of a broader effect on body fat distribution) in East Asians and Native Americans and that this could have been relevant in adaptation to a cold environment. The WARS2/TBX15 region includes a bivalent transcription factor as well as a superenhancer (Fig. 3), hallmarks of critical patterning transcription factors responsible for specifying tissue/cell-type identity (44), in this case active during early human craniofacial development. It will therefore be important to directly examine the role of variants in the WARS2/TBX15 regions (including the Denisovan haplotype) on gene expression regulation and to evaluate the impact of any such changes in gene expression on body fat distribution.
Of the previously unidentified face morphology loci we detected, evidence is most compelling for VPS13B, mutations of which result in Cohen syndrome. Consistent with the effect on columella size that we detect in the CANDELA individuals, patients with Cohen syndrome typically exhibit a beak-shaped, prominent nose (OMIM #216550). In agreement with these phenotypic effects in humans, here we show that mice deficient in Vps13b present a cranioskeletal dysmorphology that includes anteriorly lengthened nasal bones. Other cranioskeletal changes with similarities across humans and mice have been reported for rare mutations at a number of loci, for instance, in Williams syndrome (45). These homologous changes probably reflect genetic effects on related cranial neural crest–derived bony elements of the skull (45). Furthermore, our confirmation that common variants of Vps13b affect midfacial morphology mice establishes a specific role for this gene in craniofacial development, beyond the various phenotypic effects associated with VPS13B mutations and Cohen syndrome. VPS13B is a widely expressed transmembrane protein, and on the basis of its homology to the yeast VPS13 protein, it is thought to function in vesicle-mediated transport and sorting of proteins within the cell. By forming a complex with the small guanosine triphosphatase RAB6 at the Golgi, VPS13B strongly colocalizes with the cis-Golgi matrix protein GM130 and is required to maintain Golgi integrity (46). VPS13B also plays a role in Golgi protein glycosylation (47) and has been identified as a tethering factor functioning in transport from early endosomes to recycling endosomes (47). Facial dysmorphism is a common feature of disorders of glycosylation (48) and likely reflects the importance of glycosylation as a modulator of many extracellular signaling pathways that are highly active during embryogenesis.
The observation of an effect of Vps13b on morphology in outbred mice suggests that variation in this gene could play a role in natural craniofacial variation in Mus as well as Homo. In this context, it seems relevant that the VPS13B region has been highlighted in genome scans for selective sweeps both in dog breeds (49) and in comparisons of Neanderthal and modern human sequences (50). This suggests that certain gene regions affecting facial variation within species could also have played a role in craniofacial differentiation across species. This appears to be the case for the SUPT3H/RUNX2 region. We initially detected an association of SNPs in this gene region with nose bridge breadth (15). Subsequently, an effect for SNPs in SUPT3H/RUNX2 on nose morphology (10) and chin dimples (7) has been reported, and here we find an association of this region with forehead protrusion. The ratio of glutamines to alanines in a functional domain of RUNX2 was shown to correlate with facial length in Carnivora (51), and this glutamine/alanine ratio has recently been shown to also correlate with facial length in anthropoid primates (52). It will therefore be of interest to more broadly examine the extent to which the loci being implicated in human facial variation could play a role in natural variation in other species, as well as in the differentiation of facial features between taxa. Of particular interest for our species is the role that these genes could have played in the differentiation of anatomically modern humans from more archaic forms, which might also provide insights into the evolutionary forces involved.
|
|
|
|
Post by Admin on Feb 10, 2021 22:20:33 GMT
Latin Americans show wide-spread Converso ancestry and imprint of local Native ancestry on physical appearance
Abstract
Historical records and genetic analyses indicate that Latin Americans trace their ancestry mainly to the intermixing (admixture) of Native Americans, Europeans and Sub-Saharan Africans. Using novel haplotype-based methods, here we infer sub-continental ancestry in over 6,500 Latin Americans and evaluate the impact of regional ancestry variation on physical appearance. We find that Native American ancestry components in Latin Americans correspond geographically to the present-day genetic structure of Native groups, and that sources of non-Native ancestry, and admixture timings, match documented migratory flows. We also detect South/East Mediterranean ancestry across Latin America, probably stemming mostly from the clandestine colonial migration of Christian converts of non-European origin (Conversos). Furthermore, we find that ancestry related to highland (Central Andean) versus lowland (Mapuche) Natives is associated with variation in facial features, particularly nose morphology, and detect significant differences in allele frequencies between these groups at loci previously associated with nose morphology in this sample.
Introduction
The history of Latin America has involved extensive admixture between Native Americans and people arriving from other continents, particularly Europe and Africa1,2,3. Most genetic studies carried out to date have examined this process mainly in relation to variation in overall Native American, European and Sub-Saharan African ancestry across regions and between individuals2,3,4; with small and geographically-restricted East Asian ancestry also reported5,6,7. In addition, some genetic analyses have sought to detect regional ancestry within the three major continental components, i.e. the sub-continental origins for individuals having contributed to admixture in Latin America. For instance, mtDNA and Y-chromosome data suggest that historical admixture in North West Colombia involved local Native women, and that some immigrant men carried haplogroups common in Jewish populations8. The inference that historical admixture of Latin Americans in specific regions involved Natives with a relatively close genetic affinity to those currently living in the same areas was subsequently supported using genome-wide autosomal data9,10. Recent genome-wide SNP studies (GWAS), partly implementing haplotype-based analyses, have further expanded the notion that the demographic shifts of the last few generations have not entirely erased signals of historical population structure in Latin America6,11,12,13,14,15. A finer characterization of the admixture history of Latin America would benefit from a more extensive sampling across the region, as well as from further methodological improvements (including fully haplotype-based analyses and improved modelling approaches) and a wider survey of reference population samples (from areas potentially contributing to Latin American admixture).
The broad significance of characterizing these fine-grained patterns of human genetic diversity in Latin America is emphasized by the realization that geographically-restricted genetic variation is potentially a key component of the genetic architecture of common human phenotypes, including disease16. Furthermore, studies of regional human genome diversity, and its bearing on phenotypic variation, have so far been strongly biased towards European-derived populations17. The study of populations with non-European ancestry is essential if we are to obtain a more complete picture of human diversity. Latin America represents an advantageous setting in which to examine regional genetic variation and its bearing on human phenotypic diversity18, considering that the extensive admixture resulted in a marked genetic and phenotypic heterogeneity2,3,19. Relative to disease phenotypes, the genetics of physical appearance can be viewed as a model setting with distinct advantages for analyzing patterns of genetic and phenotypic variation. Many physical features are relatively simple to evaluate, show substantial geographic diversity and are highly heritable. We have previously shown that variation at a range of physical features correlates with continental ancestry in Latin Americans19 and have identified genetic variants with specific effects for a number of features20,21,22.
Here we apply fully haplotype-based methods that have been shown to provide higher resolution than allele-based approaches for examining patterns of human population sub-structure23, for example recently enabling a fine-grained analysis of the population structure and demographic history of the British Isles24. We present a novel model-based technique for ancestry estimation with a substantial increase in accuracy compared to the technique used in the aforementioned study. We applied this technique to the largest Latin American sample available to date, and an extensive set of reference population samples, in order to delineate patterns of sub-continental genetic diversity across Latin America. Our results demonstrate a striking geographical correspondence between Native ancestry components in Latin Americans and the genetic structure of present-day Native groups. We also match non-Native ancestry components to precise regions of Europe at a sub-country level and unearth ancestry related to present-day groups from the East/South Mediterranean, Africa and East Asia. We infer the timings of these genetic contributions and relate them to historically-attested migrations, for example providing compelling new evidence of widespread ancestry from undocumented migrants during the colonial era. We further show how differences in Native and European sub-continental ancestry components are associated with variation in physical appearance traits in Latin Americans, highlighting the impact of regional genetic variation on human phenotypic diversity.
|
|
|
|
Post by Admin on Feb 10, 2021 23:15:06 GMT
Results Overview of the data We examined data for over 500,000 autosomal SNPs typed in more than 6,500 individuals born in Brazil, Chile, Colombia, Mexico and Peru (denoted the CANDELA sample, Supplementary Fig. 1). To infer ancestry in this sample, we also collated data for 2,359 individuals from 117 reference populations (including 430 newly genotyped individuals from 42 populations) representing five major bio-geographic regions: Native Americans; Europeans; East/South Mediterraneans; Sub-Saharan Africans and East Asians (Fig. 1a, Supplementary Table 1, Supplementary Fig. 2). Analysis of these data using the allele-based approach ADMIXTURE25 shows major limitations for characterising sub-continental ancestry (Supplementary Note 1), similar to what has been observed with other datasets23,26. We therefore performed fully haplotype-based analyses. We first grouped the reference population individuals into 56 homogeneous clusters based on patterns of haplotype sharing, primarily using the program fineSTRUCTURE23, followed by secondary refinements (see Methods, Supplementary Tables 2 and 3). We inferred the proportion of the genome in each CANDELA individual that is most closely related to each of these 56 surrogate clusters, using a novel approach we term SOURCEFIND (see Methods). In contrast to another haplotype-based approach that implements a Non-Negative least squares (NNLS) regression24,27, SOURCEFIND uses a Bayesian model that eliminates contributions that cannot be reliably distinguished from background noise. Simulations show that SOURCEFIND has greater accuracy than NNLS (Supplementary Note 2). For ease of visualization, we collapsed the ancestry components inferred from the 56 surrogate clusters into 35 groups, based on the genetic relatedness of the clusters (Supplementary Fig. 3). Average continental and sub-continental ancestries from SOURCEFIND and ADMIXTURE are provided in Supplementary Note 3. 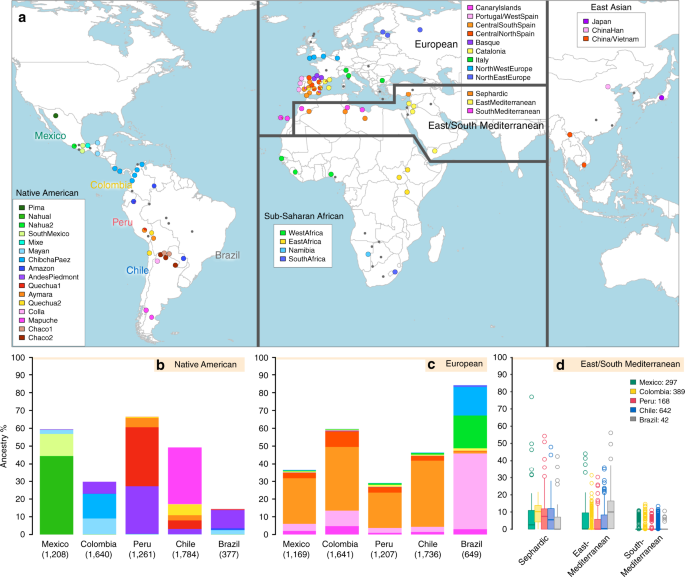 Fig. 1 Reference population samples and SOURCEFIND ancestry estimates for the five Latin American countries examined. a Colored pies and grey dots indicate the approximate geographic location of the 117 reference population samples studied. These samples have been subdivided on the world map into five major bio-geographic regions: Native Americans (38 populations), Europeans (42 populations), East/South Mediterraneans (15 populations), Sub-Saharan Africans (15 populations) and East Asians (7 populations). The coloring of pies represents the proportion of individuals from that population included in one of the 35 reference groups defined using fineSTRUCTURE (these groups are listed in the color-coded insets for each region; Supplementary Fig. 2). The small dark grey dots indicate reference populations not inferred to contribute ancestry to the CANDELA sample. b–d refer to the CANDELA dataset. b, c show, respectively, the average estimated proportion of sub-continental Native American and European ancestry components in individuals with >5% total Native American or European ancestry in each country sampled; the stacked bars are color-coded as for the reference population groups shown in the insets of (a). d shows boxplots of the estimated sub-continental ancestry components for individuals with >5% total Sephardic/East/South Mediterranean ancestry. In this panel colors refer to countries as for the colored country labels shown in (a). Following standard convention for boxplots, the center line denotes the median, the box boundaries represent the first and the third quartiles, and the whiskers range to 1.5 times the inter-quartile range on either side. Outlying points are plotted individually Patterns of Native American ancestry in the CANDELA dataset Anthropological studies indicate that Pre-Columbian Native population density varied greatly across the Americas, impacting on the extent of Native American ancestry observed across Latin America2. Native ancestry in the CANDELA sample varies considerably between countries, and we also observe a marked geographic differentiation in sub-continental Native ancestry within each country, with a strong correspondence with the genetic structure of the Native American reference groups (Figs. 1 and 2). Allele-based analyses have previously documented that broad patterns of Native American population structure are detectable in admixed Latin Americans10,14. Our haplotype-based analyses significantly extend these results by enabling the inference of 25 Native American ancestry components across Latin America (Supplementary Fig. 3), which we combined into 16 components for visualization (Figs. 1b and 2a). In Mexicans we find a predominant Nahua sub-component (most prevalent across northern and central Mexico) and two smaller sub-components, one related to Natives of south Mexico and another to Mayans (seen mainly in Mexicans from Yucatan), similar to previous reports14,28. In Peruvians we observe a predominant Quechua component (in central Peru), a sub-component related to Andean-Piedmont Natives (concentrating in Northern Peru) and a smaller Aymara sub-component (seen mostly in Southern Peruvians). In Chileans the predominant Native sub-component is most closely related to the Mapuche from Southern South America, while smaller components, related to those observed in Peruvians, are observed in Northern Chileans. In Colombians Native ancestry is most similar to Chibchan-Paezan Natives from Colombia and lower Central America, particularly in Northwestern Colombians. Other components are most closely related to the Central American Maya and, in Southern Colombians, to the Peruvian Andean Piedmont component. The overlap in Native Ancestry between Peru and neighboring Chile (to the south) and Colombia (to the north) is consistent with the high population density of the Central Andes in pre-Columbian America, possibly associated with major cultural developments in the region (at its peak the Inca Empire extended from southern Colombia to northern Chile29). Finally, Andean-Piedmont ancestry from North-eastern Peru represents the major Native American contribution in the Brazilian sample (Fig. 2; Supplementary Fig. 4). Considering the low Native American ancestry in this sample compared to the other countries sampled (Fig. 1b; most Brazilians examined originate from an area of high recent European immigration19) and the lack of better surrogates for the Native American ancestors of current-day Brazilians (Fig. 1a), this affinity suggests a common ancestral origin between the ancestors of these Brazilians and other populations from the Amazon basin. Our results provide a high-resolution picture of Native variation across the Americas, emphasizing the genetic continuity between pre-Columbian groups and the Native component of present-day admixed populations across the region. Fig. 2 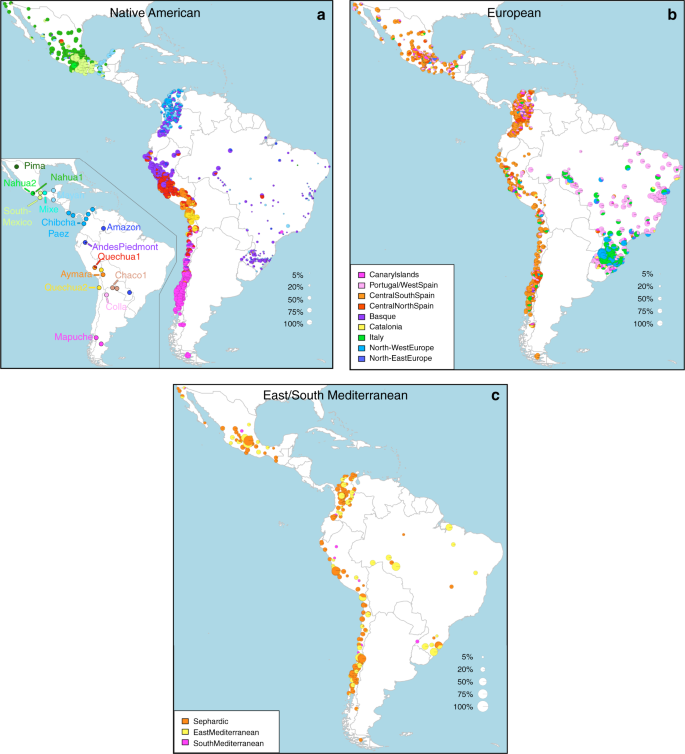 Geographic variation of ancestry sub-components in Latin American individuals. a Native American, b European, and c East/South Mediterranean. Each pie represents an individual, with pie location corresponding to birthplace. Since many individuals share birthplace, jittering has been performed based on pie size and how crowded an area is. Pie size is proportional to total ancestry from all sources depicted in that specific figure, and only individuals with >5% of such total ancestry are shown. Coloring of pies represents the proportion of each sub-continental component estimated for each individual (color-coded as in Fig. 1; Chaco2 does not contribute >5% to any individual and was excluded). Pies in (c) have been enlarged to facilitate visualization Patterns of European ancestry in the CANDELA dataset Importantly, SOURCEFIND distinguishes between closely-related ancestry components from the Iberian Peninsula, as well as from the East and South Mediterranean (including individuals self-identified as Sephardic; i.e. Iberian Jews; Supplementary Note 2). The distribution of European ancestry in the CANDELA sample shows a sharp differentiation between Brazil and the Spanish American countries (Fig. 1c). In Brazil the predominant European sub-component matches mostly the Portugal/West-Spain reference group while in Mexico, Colombia, Peru and Chile it is mostly Central/South-Spanish ancestry that is inferred (Figs. 1c and 2b). This differentiation closely matches colonial history. The European settlement of what is now Latin America involved two main areas of colonial expansion, as agreed in the Tordesillas treaty of 1494. This treaty established that territories west of a meridian somewhat east of the Amazon river-mouth were ascribed to Spain, while territories east of this meridian were attributed to Portugal3,30. Portuguese migration thus concentrated in Eastern South America, gradually expanding beyond the Tordesillas meridian until achieving Brazil’s current political borders, which at independence, remained a single political entity. Conversely, Spanish immigrants settled mainly in territories of Central America and Western South America, which at independence fragmented into separate countries3. The relatively small contribution inferred here for the Basque and Catalan agrees with historical information documenting that Spanish migrants to the Americas originated mainly in Southern and Central Spain31. In addition to Portugal/West-Spain ancestry the Brazilian sample also shows substantial genetic components most closely related to the Italian and German reference groups, and these concentrate in the South of the country (Fig. 2b). This pattern is consistent with the documented migration to Southern Brazil of large numbers of Germans and Italians starting in the late 19th century30. |
|

