|
|
Post by Admin on May 29, 2021 3:24:01 GMT
Results Pigmentation features examined Our study sample is part of the CANDELA cohort ascertained in five Latin American countries (Brazil, Colombia, Chile, Mexico and Peru; Supplementary Table 1)16. Information on skin, hair and eye (iris) pigmentation (Figs. 1 and 2) was obtained for 6357 individuals. Skin pigmentation, measured using reflectometry by the melanin index (MI), showed extensive variation. The MI ranged from 20 to 65 (mean = 34.98 and SD = 5.34). The lightest mean pigmentation was observed in Brazil (32.04) and the darkest mean pigmentation in Mexico (36.32) (Fig. 1a). We have previously reported genome-wide association analyses of categorical hair color in the CANDELA sample18. The most prevalent colors were black and brown, which account for ~80% of this sample. These were also the most prevalent categories across countries, except in Brazil where ~50% of individuals had dark blond/light brown or blond hair (Fig. 1b). Eye color was classified into 5 ordinal categories (1-blue/gray, 2-honey, 3-green, 4-light brown, 5-dark brown/black) by direct observation of the volunteers. The most common categories were dark brown/black and light brown, comprising ~85% of the sample (Fig. 1c). The lighter eye color categories (blue/gray and green) were more common in Brazil (~40%) than in in the other countries (≤10%). Fig. 1 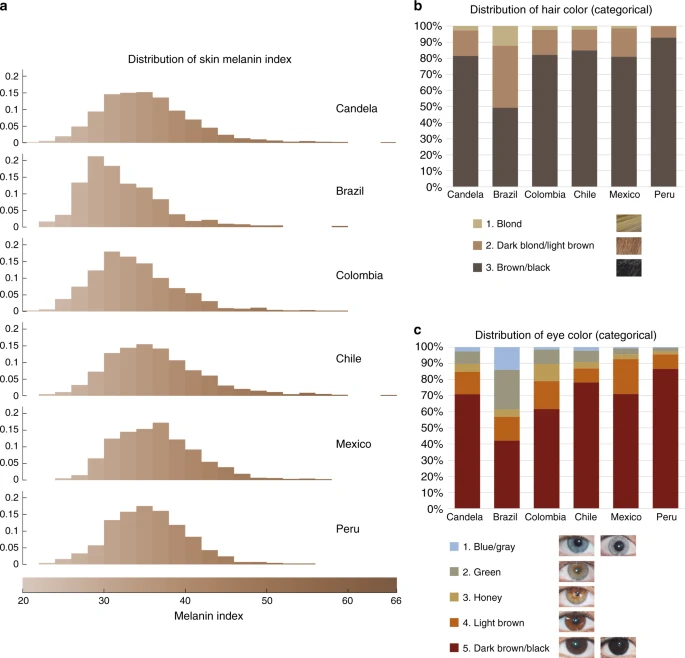 Distribution of skin, hair and eye pigmentation in the CANDELA sample. a Frequency distribution of skin melanin index (MI). Histograms are shown for the full CANDELA sample and for each country sample separately. To facilitate relating MI values to skin color, the MI values (x-axis) were converted to approximate RGB values (scale at the bottom, Supplementary Figure 16). b Stacked bar plots showing the frequency (percent) of the three hair color categories. Bar colors correspond approximately to the sample images for each category shown at the bottom (with the ordinal numbering used in the association analyses shown next to each category). c Stacked bar plots showing the frequency (percent) of eye color categories. Bar colors correspond approximately to the sample images of eyes as shown at the bottom (with the ordinal numbering used in the association analyses shown next to each category). Categories 1 and 5 are composite categories, respectively of blue/gray and dark brown/black and examples of each of the sub-type are shown Fig. 2 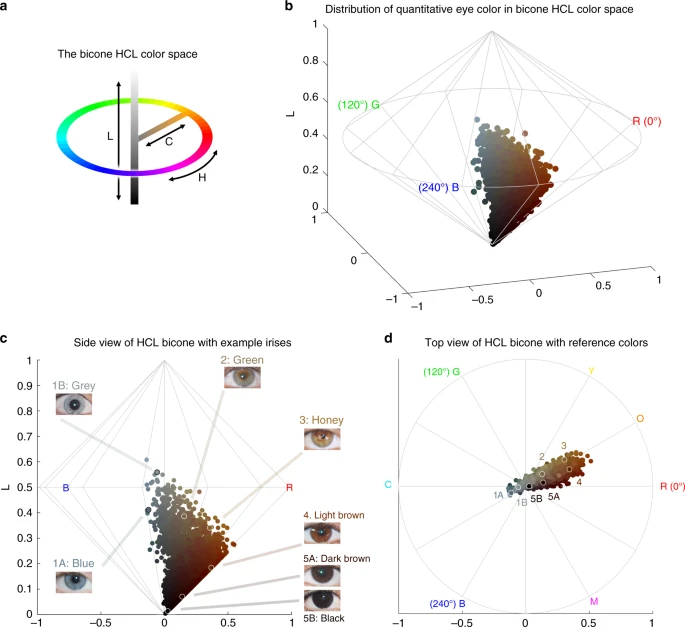 Quantitative assessment of eye pigmentation in the CANDELA sample. a Three-dimensional distribution of quantitatively assessed iris colors in the bicone HCL (hue, chroma, lightness) color space. Each dot corresponds to a CANDELA individual and its color represents the average iris color for that person. The color space has a polar coordinate system, where the vertical axis represents L (lightness/brightness, from dark = 0 to light = 1), the horizontal distance from the central axis represents C (chroma/saturation, from desaturated = 0 to fully saturated = 1), and H (hue/ tone) represents the angle when a vertical plane is rotated along the central axis (the three primary colors red (R), green (G) and blue (B) being situated at angles of 0°, 120° and 240° respectively). b The full range of the HCL color space, showing how the three color components vary in the space. Hue varies as a color circle, coming back to red at 360°. The unlabeled axes represent the Cartesian equivalents for the C and H variables, which define a polar coordinate system, as shown in panel a. c Side view of the bicone in a showing how the L (lightness/brightness) and C (chroma/saturation) of eye colors vary among CANDELA volunteers. The position of the dots corresponding to the average eye colors of the sample images in Fig. 1c are indicated. d Top view of the bicone in a showing how H varies among the eye colors of CANDELA volunteers. The position of the dots corresponding to the average color of the sample images in Fig. 1c are highlighted by white circles. In addition to the primary RGB colors, the secondary colors orange (O), yellow (Y), cyan (C) and magenta (M) are shown at their corresponding H angles In addition to eye color categories, we obtained quantitative variables related to perceived eye color from the analysis of digital photographs, using the HCL color space (hue, chroma, lightness) (Fig. 2 and Supplementary Figure 1–3). Hue (H) measures variation in color tone, whereas chroma (C) and lightness (L) measure saturation and brightness, respectively (Fig. 2a, b). The frequency distributions of these variables are shown in Supplementary Figure 4. In contrast to the eye color categories, these quantitative color variables capture variation not only in the blue/gray to brown spectrum (mainly captured by H and L), but also variation within the brown spectrum (mainly captured by C) (Fig. 2c, d): while individuals with the highest L values exhibited mainly blue/gray eyes, individuals with the highest C values exhibited eye colors with the lightest shades of brown (i.e., light brown or honey, Fig. 2c). As H is a circular variable, it was standardized and converted to cos(H) before testing for association (see Methods). In what follows we contrast results for all the pigmentation phenotypes examined in the CANDELA individuals. All the pigmentation phenotypes examined are significantly (P values < 0.001) and positively correlated (Supplementary Table 2A). Strongest correlation was observed between hair and categorical eye color (r = 0.50), while there is lower correlation of these two traits with skin pigmentation (r = 0.30 and r = 0.31, respectively). Lighter pigmentation of hair, skin and eyes is also significantly (P values < 0.001) correlated with the genetic estimates of European ancestry (r ranging between 0.31 and 0.39, Supplementary Table 2B). Categorical eye color was strongly correlated with the L digital eye color variable (r = −0.78), but moderately correlated with cos(H) and almost uncorrelated with C (r of 0.40 and −0.08, respectively), highlighting the considerable amount of variation in the quantitative variables not captured by the eye color categories. Individuals were genotyped on Illumina Omni Express BeadChip. After quality control, we retained 674,971 single-nucleotide polymorphisms (SNPs) and 6236 individuals for the genetic analyses. Average continental admixture proportions in these individuals were estimated as: 48% European, 46% Native American and 6% African (Supplementary Figure 5). Based on a kinship matrix obtained from the SNP data19, we estimated a narrow-sense heritability for skin color of 0.85 (SE 0.05) and of 1 (SE 0.05) for both hair and eye color. Similarly, quantitative eye color variables showed high heritability estimates (between 0.79 and 1.00, SE 0.06) (Supplementary Table 3). High heritabilities for pigmentation traits have also been estimated from family data20,21. |
|
|
|
Post by Admin on May 29, 2021 21:03:50 GMT
Association analyses The primary genome-wide association tests (Table 1) (using 8,896,142 genotyped and imputed SNPs) were performed using multivariate linear regression, as implemented in PLINK v1.922. We used an additive genetic model adjusting for age, sex and the first six principal components (PCs; Supplementary Figure 6A) obtained from genome-wide SNP data. Following up the primary GWAS results, and to account for phenotypic variation explained by known pigmentation loci, we performed GWAS analyses conditioned on six well-established pigmentation SNPs, which explain a large proportion of the phenotypic variance seen in our sample (Supplementary Table 5 and Methods): rs16891982 (SLC45A2), rs12203592 (IRF4), rs10809826 (TYRP1), rs1800404 (OCA2), rs12913832 (HERC2) and rs1426654 (SLC24A5). The association statistics showed no evidence of residual population stratification, except for skin pigmentation (genomic inflation factor λ = 1.11) (Supplementary Table 4A and Supplementary Figure 6B). We interpret this as resulting from a relatively high polygenicity of skin pigmentation, rather than from residual population stratification, as has been suggested by other studies2,4,23,24. Consistent with this view, an analysis based on the Tail Strength statistic25 indicates modest but significant polygenicity for all the traits examined, with the highest values being observed for skin pigmentation (see Supplementary Table 4A and Methods). Table 1 Features of index SNPs in genome regions associated with pigmentation traits in the CANDELA sample
Region	SNP	Candidate gene	SNP annotation	Skin	Hair	Eye	L (brightness)	C (saturation)	cos(H) (hue)
1q32	rs3795556	DSTYK	3’ UTR	2.1E-01	9.1E-01	6.8E-01	6.9E-03	4.0E-09	2.3E-01
5p13	rs16891982a,b	SLC45A2	F374L	1.3E-117	6.3E-66	1.3E-15	4.0E-17	5.4E-07	1.8E-04
6p25	rs12203592b	IRF4	Intronic	3.2E-10	2.0E-13	1.3E-12	3.2E-14	1.1E-03	4.5E-02
9p23	rs10809826a,b	TYRP1	Intergenic	1.1E-03	3.3E-02	1.0E-10	5.0E-16	2.0E-08	1.2E-02
10q26	rs11198112	EMX2	Intergenic	1.7E-10	6.1E-01	3.6E-01	4.9E-01	7.7E-01	4.9E-01
11q14	rs7118677a,c	GRM5	Intronic	1.1E-09	3.1E-06	6.1E-01	7.5E-01	4.8E-01	5.5E-01
11q14	rs1042602	TYR	S192Y	9.1E-10	2.3E-06	7.5E-01	3.9E-01	3.6E-02	7.8E-01
11q14	rs1126809a,c	TYR	R402Q	2.5E-09	6.2E-06	1.2E-04	5.3E-06	7.4E-02	7.7E-04
15q13	rs4778219c	OCA2	Intronic	8.3E-01	7.4E-01	4.7E-02	8.9E-02	6.2E-01	2.0E-01
15q13	rs1800407c	OCA2	R419Q	6.5E-09	5.5E-02	1.1E-02	7.2E-02	1.4E-07	4.8E-06
15q13	rs1800404b	OCA2	Synonymous/TFB	5.0E-11	7.0E-03	1.3E-11	5.0E-19	1.2E-06	4.1E-02
15q13	rs12913832b	HERC2	Intronic	1.0E-17	7.9E-105	1.0E-200	1.0E-200	5.7E-07	1.3E-92
15q13	rs4778249a,c	HERC2	Intronic	2.5E-06	1.2E-03	1.4E-10	2.5E-20	4.2E-15	5.1E-01
15q21	rs1426654b	SLC24A5	T111A	1.6E-130	1.0E-18	1.0E-26	7.9E-50	6.3E-45	4.4E-01
16q24	rs885479	MC1R	R163Q	1.9E-07	5.4E-02	5.6E-01	9.6E-01	8.0E-01	9.0E-01
19p13	rs2240751	MFSD12	Y182H	1.7E-10	8.2E-01	3.1E-01	9.6E-01	1.2E-01	9.1E-01
20q13	rs17422688	WFDC5	H97Y	5.2E-01	6.9E-01	8.2E-01	2.0E-01	9.0E-01	2.0E-08
22q12	rs5756492	MPST	Intronic	4.6E-03	9.9E-01	2.7E-02	9.5E-03	5.0E-08	1.5E-01
Novel genomic regions are in bold. Genome-wide significant P values (<5 × 10−8)

MI: melanin index, L: lightness, C: chroma, H: hue
aThese SNPs were obtained through imputation. Their imputation quality ‘info’ metric was ≥0.975, the median value being 0.993. The other SNPs were obtained from chip genotyping, and their ‘concordance’ metric was >0.9, the median value being 0.981
bThese SNPs have been robustly associated with pigmentation traits in previous studies, and they explain a large proportion of the phenotypic variance in our sample (see Methods). These six SNPs were therefore used to condition the GWAS in subsequent analyses
cThe independence of association signals of these SNPs from the main index SNPs in the same regions was confirmed by conditioned analyses
Across all traits, we detected genome-wide significant association (P values < 5 × 10⁻⁸) at SNPs in 12 genome regions (Table 1, Fig. 3 and Supplementary Figure 7). As expected from the gain of power provided by conditioning on known pigmentation loci with large effects in our sample, P values from the conditioned analyses (Supplementary Table 5) are smaller for each loci than those obtained in the unconditioned analyses (Table 1). This includes well-established pigmentation SNPs not used in conditioning (rs1042602 in TYR, rs885479 in MC1R; Table 1, Supplementary Table 5), which are expected to represent confirmed associations (the association P value for rs885479 in MC1R with skin pigmentation was only suggestive in the unconditioned analyses but became genome-wide significant in the conditioned analyses). Furthermore, in the unconditional analysis the novel association in DSTYK was genome-wide significant only with eye color variable C, but in the conditional analysis this association is also genome-wide significant for eye color variable L. Fig. 3 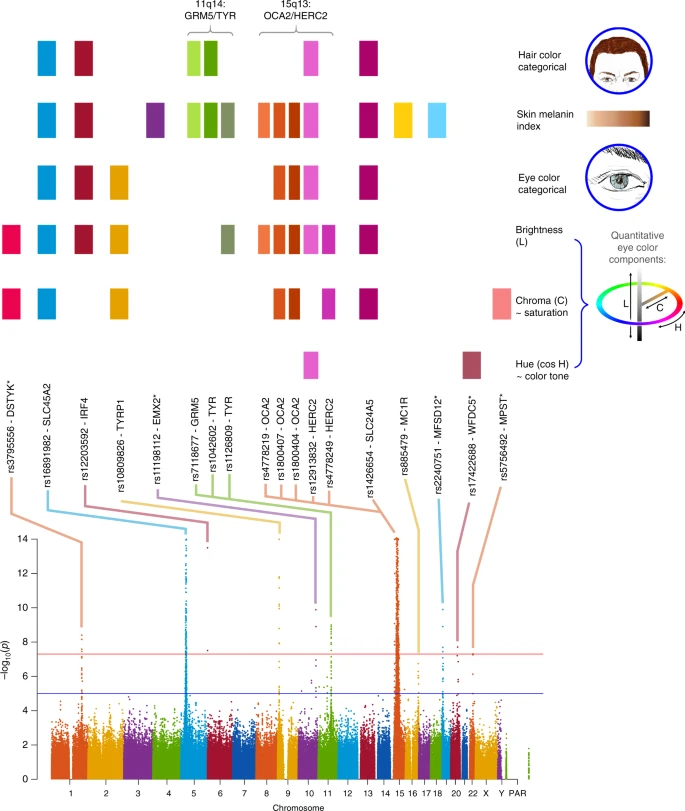 Summary of GWAS findings. Results are presented for six pigmentation traits: skin melanin index (MI, quantitative), categorical hair color, categorical eye color, and three quantitative eye color variables extracted from digital photographs: L (lightness/brightness), C (chroma/saturation) and cos H (cos hue/tone). These traits are represented on the right. The HCL color space with the three axes of variation is shown in the inset. To provide a global summary of the results, a composite Manhattan plot is presented at the bottom combining significant signals for all the traits. Horizontal lines indicate the suggestive (blue line, P value = 1 × 10⁻⁵) and significant (red line, P value = 5 × 10⁻⁸) thresholds. The y-axis was truncated at –log10(P value) = 14. Index SNPs in each region are listed above the Manhattan plot. The association of these SNPs with specific traits is represented by colored boxes at the top: a box is shown if a SNP is associated with that trait (Table 1). Box colors correspond to colors assigned to each chromosome in the Manhattan plot, with slight variation when multiple independent hits were observed on the same chromosome. |
|
|
|
Post by Admin on May 30, 2021 6:17:02 GMT
Altogether, skin pigmentation showed association with SNPs in eight regions, of which: (i) five have been robustly replicated in previous studies in Europeans or East Asians26,27,28,29; (ii) one (19p13) has recently been associated with skin pigmentation in Africans5, but at different SNPs than seen here; and (iii) one (10q26) has not been previously reported. SNPs at four of the skin pigmentation regions were also found to be significantly associated with eye and hair color (in 5p13, 6p25, 15q13 and 15q21; Table 1). In addition, eye color shows association with SNPs in four other regions (in 1q32, 9p23, 20q13 and 22q12), of which three (in 1q32, 20q13 and 22q12) have not previously been reported. The genomic regions associated with categorical eye color showed stronger association with the quantitative eye color variables (Table 1), consistent with the greater statistical power for association testing of the quantitative color variables extracted from the digital photographs, compared with the categorical variables. Other than these primary genome-wide SNP association tests, we performed two types of secondary analyses. Firstly, we examined association for each index SNP in the newly associated regions (i.e., the variant with the lowest P value within a region) in each country sample separately, and combined results as a meta-analysis (Supplementary Figure 8). For all SNPs, significant effects were in the same direction in all country samples, the variability of effect reflecting sample size. Secondly, we combined all phenotypes in a single multivariate association analysis, seeking to exploit the correlation between traits (Supplementary Table 6). As expected, index SNPs with effects across phenotypes were found to be significantly associated in this combined analysis (P value < 5 × 10⁻⁸), whereas SNPs that only affected one trait were not associated at genome-wide significance, consistent with a reduced power under this scenario30. We evaluated the presence of multiple, independent, signals of association at each genomic region highlighted in the primary GWAS by performing step-wise regression (using the same model as in the primary analyses), conditioning on the index SNP at each region (Table 1). Evidence of genome-wide significant association was abolished for all regions except 11q14 and 15q13, where a total of three and five independent signals were detected, respectively (Table 1). These two regions include, respectively, the GRM5/TYR and OCA2/HERC2 genes. SNPs in these regions have been robustly associated with pigmentation traits by previous analyses, including a number of GWAS and candidate gene studies4,27,31,32,33,34,35,36,37,38,39,40,41,42,43,44,45,46,47,48,49,50,51,52. However, since the SNPs examined in those reports often differ, the independence of these SNPs’ effects has not been systematically evaluated. Consistent with our findings, two independent signals of association in 11q14 have been reported in a GWAS for skin pigmentation in the African/European admixed population of Cabo Verde32. Seven of the eight independently associated SNPs detected here impact on skin pigmentation (the exception being rs4778249 in15q13). In addition to the effect on skin pigmentation of the three associated SNPs in GRM5/TYR, two (rs1042602 and rs7118677) were also associated with hair pigmentation, and one (rs1126809) with eye color (Table 1). The five independently associated SNPs in OCA2/HERC2 impact on eye color variation, with one of these SNPs also impacting on hair color (rs12913832). Genome annotations suggest that these eight independently associated SNPs could have separate functional relevance (Table 1). Four occur in exons, of which three result in non-conservative amino-acid substitutions and one (rs1800404) encodes a synonymous substitution (in exon 10 of OCA2) and is located in a conserved binding site for transcription factor YY1 (known to regulate pigmentation in animal models33). The allele associated with lighter skin pigmentation at rs1800404 has also been associated with a shorter OCA2 gene transcript that is missing exon 10 and codes for a protein missing a transmembrane region5. The other four independently associated SNPs are located in introns of GRM5/TYR or OCA2/HERC2. For one of these (rs12913832), intronic within HERC2, there is strong experimental evidence indicating that it regulates transcription of the neighboring OCA2 gene34. Figure 4 summarizes the allelic effects and derived population allele frequencies for the 18 index SNPs identified here. Most of these show large differences between continental populations, with the frequency in the CANDELA sample being intermediate, consistent with its admixed ancestry. For all but three SNPs (rs3795556, rs11198112 and rs4778219), the derived allele is associated with lower pigmentation. Fig. 4 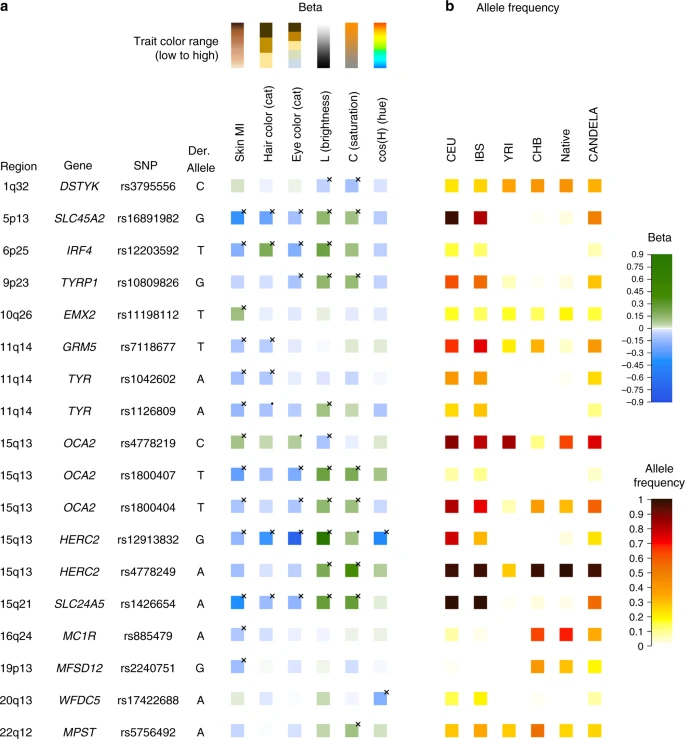 Phenotypic effects (regression beta-coefficients) and derived allele frequencies for the 18 index SNPs showing independent association in the CANDELA sample (Table 1). In a traits are shown at the top, with illustrative color ranges. Beta-coefficients have been standardized to facilitate comparison across traits. Positive betas are shown in green and negative betas in blue (with color intensity reflecting beta values as indicated on the scale to the right). Significant betas are marked with a cross. In b allele frequencies are shown for the CEU, IBS, CHB and YRI samples from the 1000 Genomes Project Phase 3, the CANDELA sample and Native Americans (from Reich et al.17 and Chacon-Duque et al.79). On the right is shown the color scale used to represent allele frequencies (Supplementary Table 7) |
|
|
|
Post by Admin on May 30, 2021 22:42:26 GMT
Interaction of SNPs independently associated with pigmentation We examined interaction between the index SNPs of Table 1 by testing regression models including all possible pairs of SNPs, adjusting for age, sex and the first six PCs, as in our primary association analysis. A number of significant interactions were detected at a multiple-testing corrected P value threshold of 3.3 × 10⁻⁴ (Fig. 5). A different pattern of interactions was observed for skin, relative to hair or eye pigmentation. In the case of skin pigmentation, significant interactions were seen mainly between SNPs that, individually, have strong effects (in SLC45A2, SLC24A5, HERC2/OCA2 and TYR/GRM5). By contrast, for hair and eye color, SNPs in the regions with strongest individual effects (SLC45A2, SLC24A5 and HERC2/OCA2) showed significant interaction with SNPs at most other pigmentation-associated regions. This included regions that individually do not have a significant effect on a particular trait (e.g., MC1R and MFSD12 with hair or eye pigmentation, respectively). These results are in line with other analyses of epistasis for pigmentation traits35,36. Fig. 5 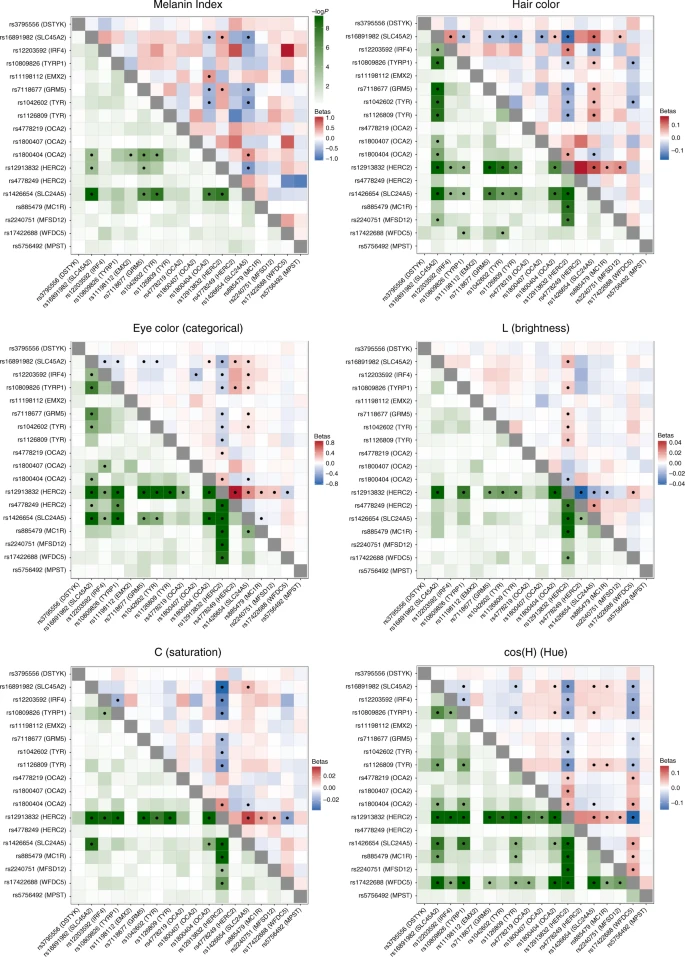 Candidate genes in genome regions showing novel association signals The 10q26 region that is newly associated with skin pigmentation shows genome-wide significant association with a linkage disequilibrium (LD) block of SNPs spanning ~100 Kb, within an intergenic region of ~400 Kb (Fig. 6). Genome annotations indicate that this region overlaps an open chromatin segment that is highly conserved evolutionarily and includes several transcription factor binding sites (Supplementary Figure 9). The derived allele for the index SNP (rs11198112) is associated with darker skin pigmentation, in contrast to the effect of the majority of variants associated with skin pigmentation (Fig. 4). The derived allele is segregating at low to moderate frequency across many populations, but reaches its highest frequency (>50%) in Native Amazonians and Melanesians (Supplementary Figure 10). The index SNP is included in the binding site for transcription factor EBF1 (early B-cell factor). If the effect of this SNP is mediated through regulation of nearby genes, of potential interest is the gene encoding for the EMX2 transcription factor (empty spiracles homeobox 2), which flanks the associated region (Fig. 6). Mouse experiments have shown that Emx2 regulates the expression of Mitf (a key regulator of melanocyte development and survival) as well as of Tyr and Tyrp-1 (two melanocyte-specific genes responsible for melanin production)37. In addition, this gene has been recently associated to tanning response in Europeans38. Fig. 6 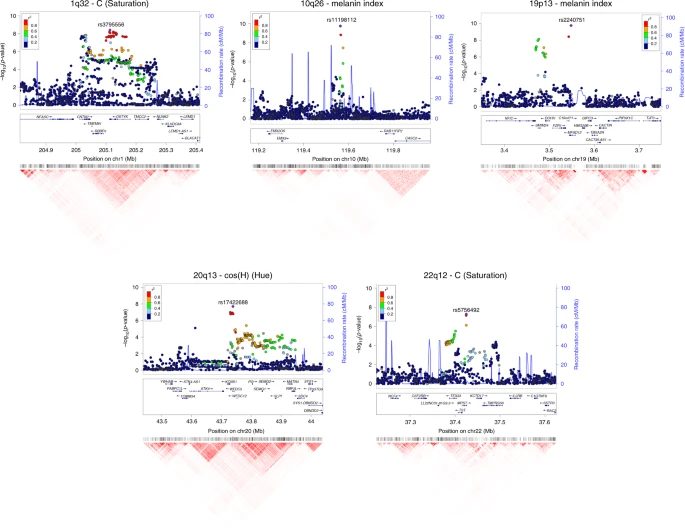 Regional association (LocusZoom) plots for SNPs in the five genomic regions showing novel genome-wide significant associations to pigmentation traits. Chromosomal location and trait are specified in the title of each panel. In each region, index SNPs (Table 1) are highlighted with a purple diamond. Colors for other SNPs represent the strength of LD between that SNP and the index SNP (in the 1000 Genomes AMR data). Local recombination rate in the AMR data is shown as a continuous blue line (scale on the right y-axis). Genes in each region, their intron–exon structure, direction of transcription and genomic coordinates (in Mb, using the NCBI human genome sequence, Build 37, as reference) are shown in the middle of each panel. At the bottom is shown a pairwise LD heatmap across all SNPs in a region (using r2, ranging from red indicating r2 = 1 to white indicating r2 = 0) SNPs showing genome-wide significant association in the 19p13 region span ~100 Kb and show strongest association for SNP rs2240751 located in the third exon of the major facilitator superfamily domain containing 12 (MFSD12) gene (Table 1, Fig. 6). Variants in this region have recently been associated with skin pigmentation in Sub-Saharan Africans5. The index SNP in the CANDELA data (rs2240751) leads to a tyrosine for histidine substitution at amino-acid 182 of MFSD12 (Y182H), which is common in East Asians and Native Americans but rare elsewhere (Fig. 4, Supplementary Table 7, Supplementary Figure 11). This variant occurs in a highly conserved sequence (as indicated by Genomic Evolutionary Rate Profiling (GERP) and Site-specific Phylogenetic (SiPhy) metrics) and the replacement of a polar for a basic amino acid could affect the function of the protein, as indicated by low Sorting Intolerant from Tolerant (SIFT; <0.01) and high Polymorphism Phenotyping v2 (PolyPhen2; >0.99) scores. Functional analyses indicate that MFSD12 is involved in lysosomal biology and that it can alter pigmentation coloration in animal models5. Since MFSD12 is highly expressed in melanocytes relative to other cell types5, and is also expressed in human skin (Supplementary Figure 12C), we examined the cellular expression of MFSD12 in normal human skin using immunohistochemistry. MFSD12 was detected in the cytoplasm of a subpopulation of melanocytes in the epidermis (Fig. 7), possibly reflecting expression of this protein at a particular maturation stage of skin melanocytes. By contrast, no expression was detected in hair bulb melanocytes of anagen scalp hair follicles. Fig. 7 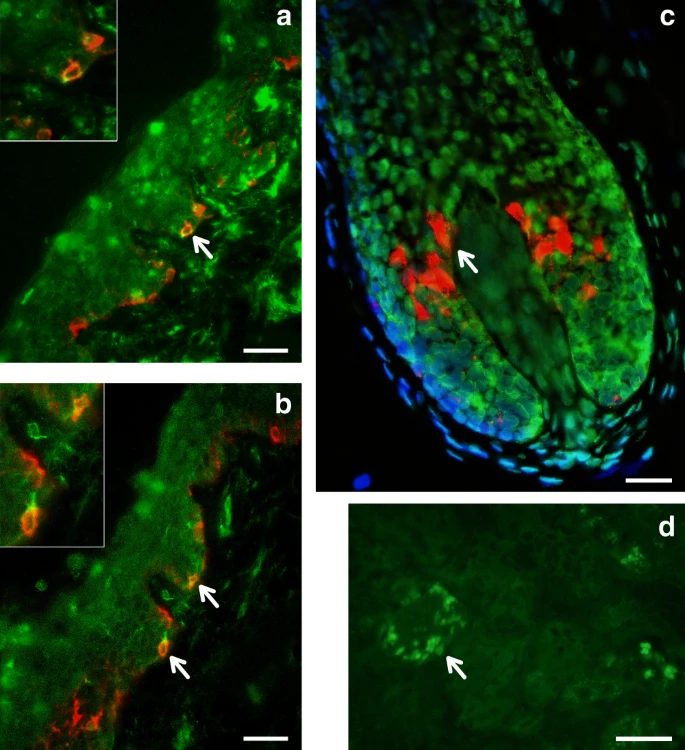 Immunohistochemical analysis of MFSD12 protein expression in the epidermis of human scalp. MFSD12 expression (green fluorescence) was detected in multiple skin cell types (a, b). MFSD12 expression levels were higher in melanocytes (identified with an anti-melanocyte antibody in red fluorescence) than in adjacent keratinocytes (green only). Co-localization of both MFSD12 and the melanocyte-specific protein gp100 expression can be seen in yellow/orange fluorescence (arrow). Insets show higher magnification views of arrowed MFSD12-expressing melanocytes in skin epidermis. c A proportion of keratinocytes in scalp hair follicle from the same tissue also expressed MFSD12(green only). By contrast with the skin, MFSD12 expression was not detected in hair melanocytes (i.e., seen as red fluorescence only indicating gp100 protein expression). d Positive control (human kidney). Note MFSD12 expression in kidney tubular cells (arrow). Scale bars: a, b = 50 µM. c = 15 µM, d = 30 µM Of the three novel regions associated with quantitative digital eye color variables, the one in 1q32 is characterized by substantial LD over a region of ~300 Kb (Fig. 6) and is associated with the L and C variables (Table 1 and Fig. 4). Strongest association is seen for markers overlapping the DSTYK gene (dual serine/threonine and tyrosine protein kinase), the index SNP (rs3795556) being located in the 3’ untranslated region of the DSTYK transcript. Expression studies have shown that MITF regulates the expression of DSTYK in melanocytes39. The 20q13 region associated with the cos(H) variable shows strong LD over a region of ~200 Kb. Strongest association is seen for SNPs overlapping the WFDC5 gene (WAP Four-Disulfide Core Domain 5, Fig. 6), with the index SNP (rs17422688) leading to a histidine for tyrosine substitution (H97Y) in a highly conserved region (based on GERP and SiPhy conservation metrics). This amino-acid change is predicted to affect protein function, as implied by low SIFT (0.03) and high PolyPhen2 (0.81) scores. WFDC5 is highly expressed in skin tissues (Supplementary Figure 12D). Several WAP Four-Disulfide Core Domain genes have been shown to be expressed in the human iris40. SNPs in 22q12 associated with the C variable show LD over a region of ~100 Kb (Fig. 6). The index SNP (rs5756492) is located in the second intron of the gene encoding Mercaptopyruvate sulfurtransferase (MPST), an enzyme playing a role in cyanide detoxification41 and cellular redox regulation42. MPST is expressed in the skin (Supplementary Figure 12E) and the human iris40. |
|
|
|
Post by Admin on May 31, 2021 4:52:04 GMT
Evidence for selection at pigmentation-associated regions Previous studies have detected signatures of selection around several pigmentation genes10,11,43. In agreement with those analyses, we found strong signals of selection in Europeans (CEU) and East Asians (CHB) from the 1000 Genomes (1KG) Project at most of the pigmentation-associated regions replicated here (Supplementary Figure 13 and Supplementary Table 8). Often the associated SNPs do not show the strongest selection signals, which suggests that selection may have acted on other nearby SNPs (Supplementary Figure 13). Highly significant signals of selection were also detected in three of the five novel pigmentation regions identified here, with the strongest signals being observed in the MFSD12 region in East Asians (Fig. 8a). More generally, we also detected a significant enrichment of maximum Population Branch Statistic (PBS) and Integrated Haplotype Score (iHS) scores at genomic regions showing at least suggestive association (i.e., those including SNPs with P values < 10−5) compared to the rest of the genome (Supplementary Table 9). Fig. 8 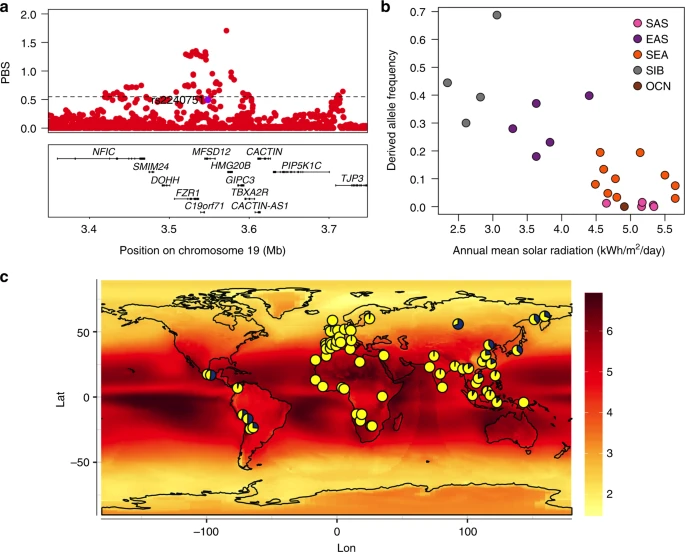 Evidence for selection in the MFSD12 gene region. a PBS scores in the 1000 Genomes CHB sample for SNPs across the region (index SNP rs2240751 is highlighted in purple and the horizontal black line represents the 99th percentile threshold). b Plot of the derived allele frequency at rs2240751 against mean annual solar radiation in Easter Eurasian populations. Populations are abbreviated as follows: SAS South Asians, EAS East Asians, SEA South East Asians, SIB Siberians, OCN Oceanians. c Allele frequencies at rs2240751 in 64 native populations from across the world mapped onto solar radiation. Pies charts are centered at the approximate geographic location of each population with the derived allele frequency represented in blue. Geographic coordinates, sample size, mean annual solar radiation and the frequency of the derived allele for each population are shown in Supplementary Table 10 and Supplementary Figure 11 Selection for skin pigmentation has been proposed to relate to adaptation to solar radiation8. Consistently, a correlation between allele frequencies at certain skin pigmentation-associated SNPs with solar radiation levels has been reported in the Human Genome Diversity Project (HGDP) population panel44,45. We re-evaluated this correlation for the index SNPs of Table 1 in a dataset we compiled including 64 native populations from around the world (excluding the HGDP panel; Supplementary Table 10). Allele frequencies at four SNPs showed a significant correlation with solar radiation (Supplementary Table 11). Three of these SNPs are in gene regions replicated in the CANDELA sample (rs12913832 and rs1800404 in the HERC2/OCA2 gene region and rs885479 in MC1R). The fourth is the index SNP at MFSD12 (rs2240751), which showed a strong correlation with solar radiation in Eastern Eurasia (log10(BF) = 2.32, P value = 0.004; ρ = −0.28, P value = 0.047) (Fig. 8b, c). Considering the evidence for selection in the MFSD12 region in Eastern Eurasians, we estimated the time since the start of selection and the selection coefficient for this region in the CHB dataset from 1KG using an approximate Bayesian computation (ABC) approach (Supplementary Figure 14, 15 and 16 and Methods). We obtained a median estimate for the selection coefficient of 1.15% (95% credible interval 0.08%–4.4%) and a median age for the start of selection of 10,834 year ago (95% credible interval of 5266–33,801 years ago). |
|

