|
|
Post by Admin on May 17, 2021 23:10:32 GMT
Common variants: haplotype-based analysis
After genotype phasing, a total of 234 individual haplotypes were used for the haplotype association analysis (162 cases and 72 controls). We analyzed seven suggestive significance areas, emerged from the single-SNP analysis (Supplementary file 1), for the association with haplotype clusters. We found a significant association (p-value<5 * 10−8) for three haplotypes located in COA1 gene (Table 2). All these haplotypes are less frequent in semi-supercentenarians than in controls. The lowest p-value of 1.84 * 10–8 corresponds to a haplotype defined by 13 consecutive markers (chr7: 43655836–43714795). The cluster that includes this haplotype consists of 111 individual haplotypes, all carrying the same allele at the 13 consecutive markers. A p-value of 4.05 * 10–8 was detected for a second significant haplotype, located on COA1 gene and defined by eight consecutive markers (chr7: 43720429–43756081). This haplotype is in a cluster containing 112 individual haplotypes for which the same allele sequence is carried by all the individual haplotypes at the eight consecutive markers. The third significant haplotype (p-value=4.00 * 10–8) located in COA1 gene is characterized by three consecutive markers (chr7: 43637796–43643835). It is to note that these markers are three out of the five variants identified by single-SNP analysis (i.e. rs7456688, rs10257700, rs10279856). This haplotype was found in all 109 individual haplotypes that are in the related cluster.
Table 2
Most significant haplotypes from each significant suggestive area emerged from the single-SNP analysis.
Chr Region Haplotype Gene Allelic test OR Allelic test p-value F_105 F_CTRL
2 196515104–196992016 GGAGCA DNAH7 11.54 (3.02–65.45) 2.34*10–05 0.98 0.82
7 43637796–43643835 GTA COA1 0.19 (0.1–0.36) 4.00*10–08 0.35 0.74
7 43655836–43714795 CATGATTAGTACG COA1 0.18 (0.09–0.35) 1.84*10–08 0.35 0.75
7 43720429–43756081 GATGACTT COA1 0.19 (0.09–0.36) 4.05*10–08 0.36 0.75
7 151364264–151376555 ACCAT PRKAG2 0.13 (0.05–0.37) 8.31*10–06 0.04 0.25
9 114679493–114691177 TTATGC UGCG 3.23 (1.66–6.57) 1.69*10–04 0.48 0.22
9 103874937–103955668 TAA LPPR1 0.13 (0.05–0.32) 9.16*10–07 0.05 0.29
11 18852217–18873142 CCTGT . 3.23 (1.66–6.57) 1.69*10–04 0.48 0.22
13 49897577–49905581 GCGATCG CAB39L 0.21 (0.09–0.44) 1.07*10–05 0.10 0.35
The most significant haplotypes of the remaining six suggestive significance areas emerging from the single-SNP analysis (located in DNAH7, PRKAG2, UGCG, LPPR1, CAB39L genes and in chr11:18852217–18873142), were reported in Table 2, but the haplotype cluster analysis did not identify statistically significant signals at the commonly used 5 * 10–8 significance level.
Comparison with existing data
Next, we investigated whether the eight known ‘longevity variants’ reported in Erikson (Erikson et al., 2016) might be associated to extreme longevity in the Italian populations (Supplementary file 7). Only one significant SNP located in TP53 gene was identified in our study (rs1042522 nominal p-value=0.01). We also analysed the association with APOE-e4, considering the combination of rs7412 and rs429358. We showed a reduced frequency of APOE-e4 in 105+/110+ compared to controls but the difference was not significant (105+ APOE-e4 16%, CTRL_WGS APOE-e4 22%).
We then listed the SNPs identified in a previous longevity study of the Italian population (Giuliani et al., 2018a) and reported in Supplementary file 8 the p-values calculated comparing 105+/110+ and CTRL (Cohort 1). Eighteen unique SNPs showed a significant p-value (nominal p-values<0.05) when considering Cohort 1. Eleven of them mapped in ESRRG (rs1436897), GUCY2EP (rs10899257), FHIT (rs2630196, rs2630173), PLCB1 (rs10485720), TBX18 (rs860844), ARID1B (rs17266366), NACAD (rs61740895, rs3735495, rs3735494), OR7G1 (rs1036224) genes. NACAD and TBX18 genes have also been associated to longevity in the Health and Retirement study, an ongoing panel survey of a nationally representative sample of men and women older than 50 years in the United States (data previously reported in Giuliani et al., 2018b). In Supplementary file 8 the SNP that showed the lowest p-value in the association analysis of Cohort 1 is rs623108, located in an intergenic region downstream BLVRA gene. rs623108 is in moderate LD (r2 = 0.58 in European populations of 1000Genomes) with the SNPs reported in Table 1. The rs623108-A allele is correlated with rs7456688-A, highlighting the central role of this region for extreme longevity in the Italian population. A GTEx analysis showed that rs623108-A correlates with STK17A expression in heart (p-value=7.6*10–13, NES = 0.39 for atrial appendage and p-value=9.5*10–23 and NES = 0.36 for Left Ventricle) and in thyroid (p-value=7.5*10–20 and NES = 0.27). eQTL violin plots are reported in Figure 2—figure supplement 1.
105+/110+ private mutations and rare variants analysis
We first performed a private mutation analysis of 105+/110+: we identified a total number of 3,446,719 private mutations exclusive of 105+/110+ (not present in CTRL) and 2,282,600 mutations showed a MAF ≤1% in the Genome Aggregation Database (gnomAD). Figure 4—figure supplement 1 reports a density plot with the prevalence of private mutations for 105+/110+. Among these mutations 5055 have been predicted as damaging in more than 4 (out of 6) databases (SIFT Pred, Polyphen2 HVAR Pred, MutationTaster Pred, MutationAssessor Pred, FATHMM Pred, FATHMM MKL Coding Pred). A complete list is reported in Supplementary file 9. Sixty-five private mutations carried by 44 105+/110+ have also been reported in ClinVar as pathogenic or likely pathogenic.
We then considered the rare variants identified in Cohort1. First, in order to exploit the richness of our WGS data set, we considered 9,303,614 rare variants (minor allele frequency <1% in both 105+/110+ and CTRL) for association with longevity using a gene-burden association test (SKAT-O). The top hit was a region located on chromosome 17 (49,230,046 bp to 49,238,995 bp) containing NME1 gene (p-value=6 *10−5). Figure 4C shows the different rare variants pattern in the group of controls and 105+/110+. A full list of all the significant genes (nominal p-value<0.01) is available in Supplementary file 10.
Secondly, we considered 34,852 rare and damaging mutations (predicted as damaging in more than 4 [out of 6] database) and performed a gene-burden association testing (SKAT-O). The complete list of genes identified is reported in Supplementary file 11. The most significant gene is PLEKHG4 (p-value=0.0011) which shows an increased burden of damaging mutations in CTRL but not in 105+/110+. According to OMIM the protein encoded by this gene has a role in intracellular signalling and dynamics at the Golgi apparatus.
|
|
|
|
Post by Admin on May 18, 2021 2:18:14 GMT
Cardiovascular insight: analysis of somatic mutations and polygenic risk score (PRS) The analysis of somatic mutations was performed considering those individuals whose cell count is not compromised as suggested by a recent paper (Jaiswal et al., 2014). For this analysis, 79 105+/110+ and 31 controls have been considered. We identified 147 somatic mutations in 80 individuals. The VAF distribution is reported in Figure 5—figure supplement 1. By comparing the total number of somatic mutations between controls and 105+/110+ considering the seven analysed genes altogether (DNMT3A, TP53, ASXL1, TET2, SF3B1, PPM1D, JAK2), we found significant differences between the groups (Mann-Whitney p-value=0.00125) where 105+/110+ have a reduce burden of mutations, the median number of mutations being one for 105+/110+ and two for controls. Moreover, Mann-Whitney U test was used to compare the number of variants in each gene between 105+/110+ and significant differences were found for DNMT3A (Mann-Whitney p-value=9*10–4) and ASXL1 gene (Mann-Whitney p-value=0.0167). We then calculated the prevalence of somatic mutation for each gene and observed that a general trend in which 105+/110+ have a lower prevalence (except for JAK2 gene) as reported in Figure 5A. Prevalence was calculated considering the number of individuals carrying at least one mutation in each gene. As expected DNMT3A and TET2 were the most commonly mutated genes in both 105+/110+ and CTRL. Figure 5 with 2 supplements 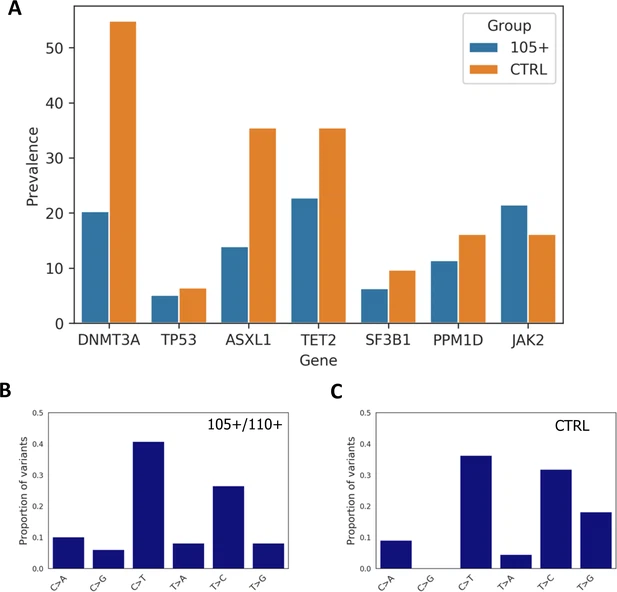 Prevalence of somatic mutations. (A) Prevalence of somatic mutations in 105+/110+ and controls considering the seven genes analysed. (B,C) the distribution of single-nucleotide substitutions types observed in 105+/110+ and CTRL. Similarly to previous report (Buscarlet et al., 2017) the majority of somatic mutations corresponded to a C>T substitution in both 105+/110+ and controls, (Figure 5B and Figure 5C). Next, we performed the same analysis considering those somatic mutations that are likely to disrupt the protein function (moderate and high impact variants) and that have been suggested to be drivers contributing to clonal expansion (Genovese et al., 2014). In this case, the total prevalence considering all seven genes was 10.13% for 105+/110+ and 0% for controls which was not statistically significant (Fisher's test p-value=0.1025). The positions identified are reported in the Supplementary file 12. We, then, checked if the somatic mutations identified are listed in the COSMIC database and followed the definition of ‘candidate driver somatic mutations’ as reported in Genovese et al., 2014 (Genovese et al., 2014) that listed in this category also the mutations reported at least seven times in hematopoietic and lymphoid malignancies. 11 mutations were identified and reported in Supplementary file 13. Since the sequencing data were generated with DNA extracted from two different sources (PBMC or whole blood) a Mann-Whitney U test was performed to verify whether somatic mutations in these genes were different among cell type when considering controls and 105+/110+ separately. No statistically significant differences were found (DNMT3A: CTRL: p-value=0.2596; 105+/110+: p-value=0.3452 - TP53: CTRL: p-value=0.5000; 105+/110+: p-value=0.2417 - ASXL1: CTRL: p-value=0.2858; 105+/110+: p-value=0.1970 - TET2: CTRL: p-value=0.4565; 105+/110+: p-value=0.4744 - SF3B1: CTRL: p-value=0.1974; 105+/110+: p-value=0.4558 - PPM1D: CTRL: p-value=0.3079; 110+/110+: p-value=0.3040 - JAK2: CTRL: p-value=0.1088; 105+/110+: p-value=0.2529). Moreover, to check the presence of cardiovascular risk variants in 105+/110+ we calculated the five most recent polygenic risk scores (PRS) for CVD in CTRL and 105+/110+ to see if 105+/110+ are characterized by lower PRS than controls. We calculated PRS according to Natarajan et al., 2017 (67 SNVs), Nelson et al., 2017, UK Biobank CardioMetabolic Consortium CHD Working Group et al., 2019 (300 SNVs), van der Harst and Verweij, 2018 (661 SNVs), Khera et al., 2018 (6630150 SNVs). No significant differences were found (p-value>0.05) (Figure 5—figure supplement 2). Standard deviation (that can be considered as proxy for heterogeneity) of PRS tends to be higher among 105+/110+ but the difference was not significant. PRS were also calculated for the top five leading causes of death with a genetic component—heart disease, cancer, stroke, Alzheimer disease, and diabetes following the list of SNPs reported in Erikson et al., 2016, and 105+/110+ did not show any significant difference when compared to controls (Supplementary file 14). |
|
|
|
Post by Admin on May 18, 2021 21:05:43 GMT
Discussion
In the present study, we provide results from the first whole-genome sequencing analysis at high coverage (90X) performed in 81 105+/110+ (mean age: 106.6 ± 1.6 years) and 36 CTRL (mean age 68.0 ± 5.9 years) representative of one specific population (i.e. the Italian peninsula).
This study design attempts, for the first time, to deal with the main weaknesses encountered in the study of genetics of longevity that Sebastiani and colleagues recently highlighted:
A ‘relaxed definition’ of longevity as survival to age 85 and older, in order to increase the sample size through a meta-analysis. This inevitably increases the heterogeneity of the phenotype and to avoid this risk, we considered only individuals that reached the last decades of lifespan and individuals older than 100 years for the replication. The apparently low number of 105+/110+ is due to the fact that the recruitment of these most unique persons is complicated because of their very low number in the general population (considering individuals born in Italy in 1903, the number of people alive at age 105 was 78, given 100,000 alive at birth according to the Italian national registry ISTAT) and their delicate health conditions;
The issue of population heterogeneity in terms of genetic ancestry and ethnicities. This study specifically focused on one population (the Italian one) to reduce the bias due to tangled population-specific dynamics (Giuliani et al., 2017; Yashin et al., 2014), taking into account the fact that population specific evolutionary dynamics (such as demography or selection) can lead to high frequencies of certain variants linked to healthy aging or modern pathologies (Sazzini et al., 2016). We selected 105+/110+ individual perfectly matched with controls for geographically origin (from North to South Italy) according to an ecological approach recently described (Franceschi et al., 2020; Giuliani et al., 2018a).
The choice of controls is challenging for studies on human longevity. Here we considered a group of healthy unrelated individuals selected from the general population as control group. We are aware that, since they are still alive, some of them may eventually become 105+/110+, but we believe that in any case this number will be very small given the low prevalence of 105+/110+ in the general population.
We identified five common variants in LD (rs7456688, rs10257700, rs10279856, rs69685881, and rs7805969) with significance at adjusted p-value 10%, all in the same region located between COA1 gene and STK17A gene. The gene-based analysis of WGS data identified STK17A gene as the most significant gene that is validated in the Cohort 2.
The U-shaped in allele frequency of rs7456688-A allele showed that these variants are peculiar of 105+/110+ individuals, and this is the first study that includes a high number of 105+/110+ to detect this signal.
All these variants were replicated in Cohort 2 (unadjusted p-values<0.05) which is made of 333 Italian centenarians (>100 years) geographically matched to 358 controls (mean age: 60.7 ± 7.2).
One of these five variants, rs10279856, may play a regulatory role in the region, as supported by the results obtained from risk variant inference (Riviera) and GTEx database. The SNP rs10279856 seems to play a pleiotropic role as it is an eQTL for STK17A gene and for two other genes (COA1 and BLVRA). The haplotype-based analysis confirmed that COA1 presented the most significant signal and identified a haplotype strongly associated to extreme longevity (chr7: 43720429–43756081) (p-value=1.84*10–8). Moreover, the comparison with existing data (Giuliani et al., 2018b) also identified one SNP (rs623108) with potential impact on STK17A expression, indicating that different signals from different SNPs in moderate LD seems to converge on regulating the expression of COA1, STK1A, and BLVRA genes. Further functional studies are needed to elucidate the role of these genes.
Considering the four SNPs identified by Riviera analysis – that is rs10279856, rs3779059, rs849166, rs849175 – we observed that the most frequent alleles in 105+/110+ (rs10279856-G reference allele and rs3779059-A, rs849166-A, rs849175-A alternative alleles) are associated with the increase in SKT17A gene expression in heart (atrial and left ventricle), lung, nerve, and thyroid (data from GTEx portal). STK17A is involved in DNA damage response and positive regulation of apoptotic process (Sanjo et al., 1998) and regulation of reactive oxygen species (ROS) metabolic process. Moreover, it has been suggested that STK17A can be activated in response to external stimuli such as UV radiation and drugs (Sanjo et al., 1998). SNP rs7805969-A allele (located in STK17A/COA1 region) was found to be associated to systemic lupus erythematosus (SLE) in a population from Southern Brazil (da Silva Fonseca et al., 2013), and a reduced expression of SKT17A has been observed during the active phase of SLE disease (Sandrin-Garcia et al., 2009). These data suggest a possible role of this gene in DNA damage response as the variants associated to an increase of SKT17A expression (in-silico prediction) were found more frequent in 105+/110+ than controls, supporting the data by Gorbunova and colleagues on a central role of DNA repair mechanisms in aging and longevity (Gorbunova et al., 2007). They proposed the following sequence of events that occurs during aging: (i) mutation impairs function of genes involved in stress response and DNA repair; (2) DNA repair became more error-prone leading to accumulation of DNA damage; (3) this process accelerates age-related decline. In this model, genetic variants in STK17A may maintain DNA damage responses in 105+/110+, favoring healthy aging. On the contrary, autoimmune disease (such as SLE) are characterized by the accumulation of DNA double strand breaks possibly due to impaired repair (Souliotis et al., 2016) which is in line with data that described a reduced expression of SKT17A. These data on human extreme longevity support a recent study on lifespan in mammals which analyze evolutionary constraints at protein level and found DNA repair as one of the mechanisms allowing an extended lifespan across species (Kowalczyk et al., 2020).
Moreover, the most frequent genotypes in 105+/110+ (rs10279856-G reference allele and rs3779059-A, rs849166-A, rs849175-A alternative alleles) are not only associated to STK17A expression but also to a reduced expression of COA1 gene in adipose, artery, esophagus – mucosa, nerve – tibial and skin. COA1 gene is a component of the MITRAC complex (mitochondrial translation regulation assembly intermediate of cytochrome c oxidase complex) that regulates cytochrome c oxidase assembly. MITRAC complexes regulate both the translation of mitochondrial-encoded components and the assembly of nuclear-encoded components imported in mitochondrion and in particular the respiratory chain complex I and IV. Our result constitute the first evidence of an association with longevity of nuclear loci mapping in a gene deeply involved in mitochondrial dynamics, supporting the hypothesis that nuclear/mitochondrial co-evolution may have a crucial role for human longevity and health (Garagnani et al., 2014). The same SNPs are associated with an increase in BLVRA expression in whole blood and a decrease of the expression of the same gene in artery (tibial) and esophagus (mucosa). The protein encoded by the BLVRA gene belongs to the biliverdin reductase family, members of which catalyze the conversion of biliverdin to bilirubin. Recently it has been established that a redox cycle based on BVRA activity provides physiologic cytoprotection as BVRA depletion exacerbates the formation of reactive oxygen species (ROS) and increase cell death. Interestingly, BLVRA contributes significantly to modulation of the aging process by adjusting the cellular oxidative status (Kim et al., 2011). Moreover, Biliverdin reductase A was previously shown to regulate the inflammatory response to endotoxin, by inhibiting Toll-like receptor 4 (TLR4) gene expression (Wegiel et al., 2011).
Considering the complexity of the trait under study, it has recently been proposed that even suggestive and marginally significant p-values can be highly informative in the case of longevity (Erikson et al., 2016; Zeng et al., 2016), an argument supported by Yashin and colleagues who showed that longevity also depends on several small-effect alleles (Yashin et al., 2010). In this context, the pathway analysis is crucial as the integration of many SNPs with modest p-values may identify biological functions and crucial pathways involved in longevity (Johnson et al., 2015). This analysis identified in several pathways enriched in our cohort: axon guidance, calcium signaling, glycine serine and threonine metabolism, long-term potentiation, melanogenesis, PPAR signaling and taste transduction (see Supplementary Material 1 for more details).
In this study, APOE-e4, the gene identified in a high number of studies on human longevity showed only a general trend but no significant association with longevity was found in Cohort 1. This is in line with recent data published by the GEHA Consortium (European project on the Genetics of Healthy Ageing) where APOE-e4 did not show association with longevity in the Italian population. Factors explaining this discrepancy are the variability of this haplotype across Europe, the cline that led to the low frequency in Italy (APOE-e4 is around 8% in South Italy), the peculiar gene-environment interaction experienced by certain birth cohort, and the gender effect (Giuliani et al., 2018a). The analysis of private mutations of 105+/110+ showed that some damaging variants and pathogenic variants are compatible with extreme longevity and healthy ageing (Supplementary file 9).
Rare variants analysis showed significant associations for the NME1 gene when all rare variants were considered, and for the PLEKHG4 (puratrophin-1) gene when only damaging rare variants were considered. NME-1 is the first metastasis suppressor gene discovered Steeg et al., 1988 whose expression inhibits cell motility and metastasis in different human cancers. It regulates signalling pathways stimulated by various growth factors, including TGF-beta, platelet-derived growth factor, IGF1, lysophosphatidic acid, and serum, which suppresses metastasis (Russell et al., 1998). Recently, it has been demonstrated that NME1 is rapidly recruited to double-strand breaks promoting DNA repair (Kaetzel et al., 2015). PLEKHG4 is associated with Spinocerebellar ataxia, a neurodegenerative disease affecting cerebellar Purkinje cells. Atrophic Purkinje cells from these SCA patients have cytoplasmic aggregates containing Puratrophin-1 and the actin-binding protein Spectrin (Ishikawa et al., 2005). These regions seems to be preserved in 105+/110+ individuals who largely postpone age-related diseases and cancers, among other common diseases (Ishikawa et al., 2005).
The analysis of somatic mutations suggests that 105+/110+ individuals seem to be protected from accumulation of such mutations and we did not observe such an increase as would be expected considering their age. 105+/110+ individuals are characterized by a lower prevalence of somatic mutations in six out of the seven genes considered that is statistically significant for DNMT3A and ASXL1 genes. Focusing on somatic mutations with a potential impact on protein function the prevalence was not different from the control group.
This supports recent longitudinal data that showed that somatic mutations in DNMT3A and TET2 genes previously linked to hematopoietic malignancies are common in the oldest old (Genome of The Netherlands Consortium et al., 2016).
These results show that 105+/110+ individuals seem spared from the age-related exponential increase of disruptive mutations, and this might have contributed in protecting from CVD (Genovese et al., 2014; Jaiswal et al., 2014; Jaiswal and Ebert, 2019).
However, it is to note that a depth of coverage of 90x is not the golden standard to call somatic mutations that require a coverage around 4000x as performed in recent studies (Buscarlet et al., 2017). A lower sequencing depth is less sensitive to detect low allele fraction variants. Other studies about somatic mutations have been performed considering exome sequencing data or whole genome sequencing with a 30x mean coverage only (Zink et al., 2017; Jaiswal et al., 2014; Genovese et al., 2014 among others). The methodological variability (in term of coverage and part of the genome analysed) makes the comparison among existing studies difficult and not always possible.
On the contrary the existing PRS for CVD showed that 105+/110+ are not protected from the risk of CVD as the data showed no significant results when 105+/110+ were compared to controls. This can be due to three non-mutually excluding reasons: (1) PRS does not include population-specific dynamics and may not be specifically informative for the Italian population; (2) 105+/110+ have the same CVD risk variants of the general populations; (3) PRS score may include variants which effect can be neutralize by peculiar environmental factors or epistatic interactions. This result agreed with the studies that showed that centenarians and long-lived individuals are characterized by disease-associated variants frequencies similar to the general population (Bonafè et al., 1999, p. 53; Beekman et al., 2010; Sebastiani and Perls, 2012; Freudenberg-Hua et al., 2014; Erikson et al., 2016, Erikson et al., 2016). Using genetic data of 105+/110+ will be of extreme value in future studies to weight the role of certain ‘risk’ variants and could be used to identify new informative PRS.
Thus, the data reported here suggest that 105+/110+ escape CVD not because of genetic protection toward cardiovascular risk but because they are protect from the burden of somatic mutations (mainly disruptive) observed during ageing.
As follows we acknowledge the main limitation of this study:
The relaxed cut-off used in the discovery phase, that however is motivated by the crucial role of small-effect genetic variants in longevity (Yashin et al., 2010) and by the difficulties in the recruitment of 105+/110+ because of the rarity of the phenotype (i.e. extreme longevity);
The unbalanced case/control ratio where the case group is more than twice as large compared to the control group whose sample size is low (N = 36). However, the control group here analysed is – to date – the only representative cohort of all the Italian peninsula, including population clusters at the opposite ends of the cline of Italian variation (Sazzini et al., 2020). We decided to not include the TSI of the 1000 Genomes project in the control group first because their age is not known, secondly because they are not representative of all the Italian peninsula (as Tuscany is located in the Centre of Italy) and to maintain the matched with the 81 semi-supercentenarians who comes from Northern, Centre and Southern Italy.
The possibility that the signals here identified are peculiar of the Italian population. Gene-environment interactions are population-specific also because of the variability in environmental and cultural settings (dietary habits and lifestyle among others) and thus we cannot exclude that these results will not be generalizable. Only more data on semi-supercentenarians from other countries will clarify this point.
We selected a population of 105+/110+ perfectly matched with controls for geographical origin (from Northern to Southern Italy) to reduce bias due to genetic population variability, however a potential limitation is inextricably intertwined with this experimental design. Gene-environment interactions are population-specific also because of the variability in environmental and cultural settings (dietary habits and lifestyle among others) and thus it is likely that interactions with genetics may be different and not generalizable. Population-driven studies in which environmental and cultural data are included are desirable in this sense.
The major strengths of the present study are the following: (1) the design of this study based on the careful selection of individuals with more than 105 years old in order to focus on a peculiar phenotype that is extreme longevity; (2) the selection of 105+/110+ and controls in an homogenous population all matched for geographical origin; (3) the use of a second validation cohort of centenarians from the same population; (4) the high coverage of the sequencing that allowed somatic mutations analysis.
In conclusion, this study constitutes the first whole genome sequencing of extreme longevity at high coverage, that also allows somatic mutations analysis, in which 105+/110+ are compared with a group of healthy individual geographically matched. The results showed that 105+/110+ are characterized by a peculiar genetic background associated to efficient DNA repair mechanisms, as evidenced by both germline data and somatic mutations patterns (low/similar mutation load if compared to younger healthy controls from the general population). The model of 105+/110+ supports the recent literature that suggests a genetic signature in DNA repair mechanisms and clonal haematopoiesis are crucial players for cellular homeostasis and in cardiovascular events and that they can be the two central mechanisms that have protected 105+/110+ from age-related diseases, including CVDs.
|
|

