|
|
Post by Admin on Oct 21, 2021 2:27:10 GMT
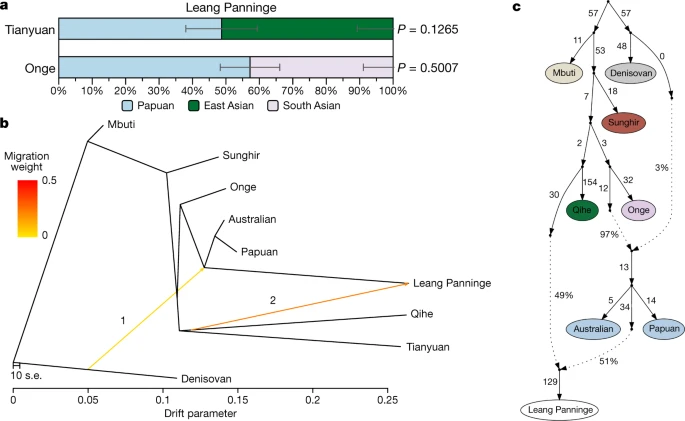 Fig. 3: Admixture signals detected in the Leang Panninge genome. a, Admixture proportions modelling Leang Panninge as a combination of Papuan49 and Tianyuan38 or Onge49 groups as estimated by qpAdm33 using Mbuti, Denisovan39, Kostenki 14 (ref. 50) and ancient Asian individuals1,37 as rotating reference groups (Supplementary Table 26). The error bars denote standard errors as calculated with block jacknife in the qpAdm software. b, c, Admixture graphs placing Leang Panninge on the branch with the present-day Near Oceanian clade41 and showing the admixture with a deep Asian-related ancestry in TreeMix42 (b) (Extended Data Fig. 10, Supplementary Fig. 6) and qpGraph (c) (worst z-score of −2.194; Supplementary Figs. 7–11)33,37,38,39,43. In b, ‘1’ and ‘2’ refer to the order in which the TreeMix software added ‘migration events’ (indicated by the arrows) to the graph. When plotting qpGraph results (c), the dotted arrows indicate admixture edges. Discussion Genome-wide analyses of the Leang Panninge individual show that most genetic drift is shared with present-day groups from New Guinea and Aboriginal Australia (Fig. 2b, Extended Data Fig. 7a). However, this Toalean-associated genome represents a previously undescribed ancestry profile, one that branched off after Onge-related and Hòabìnhian-related lineages but around the time that Papuan and Indigenous Australian groups split (Fig. 3b, c, Extended Data Fig. 8, Supplementary Figs. 6–9). It is possible that this Toalean individual carries a local ancestry that was present in Sulawesi before the initial peopling of Sahul at least 50 kya9, although whether this population produced the Late Pleistocene rock art in the south of the island11,44,45 is unknown. The Toalean individual carries substantial Denisovan-related ancestry, probably sharing the archaic admixture event with present-day Near Oceanian groups (Fig. 2c, Extended Data Figs. 7c, 10, Supplementary Fig. 5, Supplementary Tables 21–23). This provides strong support for the main Denisovan-related gene flow happening before modern humans reached Sahul, making both Wallacea and Sunda equally likely locations for this archaic introgression event. However, previously published hunter-gatherer genomes from Sunda carry almost no Denisovan-related ancestry (Supplementary Tables 18–20), suggesting either a Hòabìnhian-related spread into southeast Asia after the aforementioned gene flow or that Wallacea was indeed the crucial meeting point between archaic and modern humans. The apparent presence of a long-established population of archaic hominins in southwestern Sulawesi46 provides a possible source for the introgression event. Two previous studies have suggested that two deeply divergent Denisovan lineages admixed into the ancestors of Papuan individuals17,22, but our genomic data currently do not have enough resolution to distinguish among one or multiple introgression pulses. The lower amount of Denisovan ancestry in the Leang Panninge individual than in Papuan and Indigenous Australian individuals could result from: (1) an additional admixture with Denisovan ancestry into the common ancestors of Near Oceanian groups, or (2) a dilution of the Denisovan-related ancestry in the Leang Panninge genome through admixture with lineages carrying less or no such ancestry. Our allele frequency-based analyses do not support the first scenario (Supplementary Fig. 11), but they do favour the latter. The scarcity of pre-Neolithic genomes from across Asia prevents us from defining the exact source and admixture proportions of this gene flow event. It is noteworthy, however, that despite the reconstructed population trees (TreeMix and qpGraph) suggesting a genetic influence on middle Holocene Sulawesi from mainland East Asia, our qpAdm modelling cannot rule out a southeast Asian contribution from a group related to present-day Andamanese peoples (Fig. 3, Supplementary Figs. 6–11, Supplementary Table 26). This is consistent with a recent study that describes widespread admixtures across Asia between Onge-related and Tianyuan-related ancient populations47. However, the presence of this type of ancestry in a middle Holocene forager from Wallacea suggests that the Asian-related admixture could have taken place long before the expansion of Austronesian societies into the region. We could not detect evidence for the Leang Panninge ancestry in any tested present-day groups (Supplementary Fig. 4). This could be owing to the overall limited proportion of Near Oceanian-related ancestry in Wallacea or large-scale genetic discontinuity between earlier hunter-gatherers and modern groups. The latter scenario would suggest that any genetic signal related to the Leang Panninge individual was obscured by later demographic processes, including the Austronesian expansion1,20,26,48. Higher coverage genetic data from present-day populations in Sulawesi, and additional Toalean ancient genomes, are needed to further investigate this unique ancestry profile and the genetic diversity of hunter-gatherers from Wallacea more generally. |
|
|
|
Post by Admin on Oct 21, 2021 3:24:32 GMT
Methods
Archaeology
Leang Panninge was first identified as a site with high archaeological potential during a 2013 survey by A.B., B.H. and B.B. Since this time, the limestone cave has been the focus of several excavations undertaken by different teams (Extended Data Fig. 2, Supplementary Information). The first, the excavation of a 1-m2 test pit (labelled TP1), was conducted by Balai Arkeologi Sulawesi Selatan (Balar Sulsel) in 2014 (ref. 2). This was followed in 2015 by three excavations (of 1-m2 test pits MLP/A.1’/13, MLP/A.2’/13 and MLP/B.3′/1) spread across the cave, including one just outside the mouth, by Balai Pelestarian Cagar Budaya (BPCB) Sulawesi Selatan. The purpose of these excavations was to assess the importance of the site (the resultant report concluded that it be listed on the BPCB cultural heritage database). Later the same year, Balar Sulsel returned in collaboration with Universitas Hasanuddin (UNHAS) and Universiti Sains Malaysia to excavate a trench in the northern end of the cave (contiguous units S8T5 and S8T6) and in the central floor area (contiguous units S16T6 and S17T6). Part of a human skull in a burial context was discovered towards the end of this excavation. Owing to time and financial constraints, the burial was covered with plastic sheets and the trench backfilled to protect it for subsequent excavations. Balar Sulsel continued work further into the cave in 2016 (excavation unit S30T9). Squares S16T6 and S17T6 were reopened in 2018 to retrieve the human skeleton encountered at the base of the 2015 excavation. In 2019, this trench was extended towards the back of the cave (forming contiguous units S16T7 and S17T7) by a joint Indonesian–Australian team from Griffith University and Pusat Penelitian Arkeologi Nasional (ARKENAS), UNHAS and Balar Sulsel. The primary objectives of the 2019 fieldwork were to assess these adjacent deposits for other human skeletal remains, as well as to obtain samples of plant carbon and other materials with which to more precisely determine the age of the human burial first exposed in 2015. The 2019 investigations were conducted under a foreign research permit issued by Indonesia’s State Ministry of Research and Technology (permit no.: 154/SIP/FRP/E5/Dit.KI/VII/2017). The previous, Indonesian-led investigations at Leang Panninge were carried out under the terms of formal notifications to conduct research (Surat Pemberitahuan or Surat Penyampaian) lodged with local government authorities at various levels of administration, from regency/municipality (kabupaten) to district (kecamatan) to village (desa).
The 2015 excavations were conducted in arbitrary 10-cm-thick spits and wet-sieved through a 3-mm mesh, to a depth of approximately 190 cm, at which point the human skeletal remains were encountered in the southwestern corner of the excavation (spits 19 and 20, layer 4). In 2019, deposits were excavated using the same method, only this time in 5-cm spits; consequently, spit names in S16T7 or S17T7 originate from a depth half that of a spit with the same number in S16T6 or S17T6 (for example, spit 18 is 170–180 cm in the first case or 85–90 cm in the latter; see Extended Data Fig. 3). As noted, the skeleton was recovered from the site in 2018. Owing to the fragility of the skeletal remains, visible elements comprising the skull and pelvic areas were first consolidated with a hardening solution (Paraloid B72 acryl resin) and then removed from the deposit en bloc (Extended Data Fig. 4e). The ‘skull block’ and ‘pelvic block’ were both submitted to computer tomography (CT) at a hospital facility in Makassar, Indonesia (Balai Pengamanan Fasilitas Kesehatan Makassar), using the following CT parameters: collimation: 0.625 mm; pitch: 1/0.625; milliamperes and kilovolts: left alone; kernel: bone; retro reconstruction: 0.3-mm interslice. After CT scanning, the two sediment blocks were excavated under laboratory conditions to remove the skeletal remains. The sediment block containing the skull consisted of an intact portion of the original grave fill located immediately adjacent to and below the cranium, mandible and dental elements. The thickest part of this sediment block measured approximately 100 mm. During the ‘skull block’ excavation, we recovered the right petrous portion of the human temporal bone and thereafter submitted it for DNA analysis at the Max Planck Institute for the Science of Human History (MPI-SHH) in Jena, Germany. We also recovered stone artefacts and faunal remains, as well as a burnt Canarium sp. seed located a few centimetres from the main cluster of cranial bones (Supplementary Information). This seed yielded an accelerator mass spectrometry (AMS) 14C age of 7264–7165 yr cal BP (Wk-48639) (Supplementary Table 1).
Morphological documentation
The Leang Panninge human remains (Supplementary Table 2) are stored at the Archaeology Laboratory of the Archaeology Department (Departemen Arkeologi Fakultas Ilmu Budaya) at UNHAS, Makassar, South Sulawesi, Indonesia. In 2019, D.B. reconstructed and described the human remains under the stewardship of M.N. and I.S. Joins were effected using Tarzan’s Grip along with plasticine for missing bone. Skeletal weights were taken with a scale accurate to 1 g. Measurements were taken with a Kincrome electronic calliper accurate to 0.01 mm (generally rounded off to the closest tenth of a millimetre). Teeth were measured for their maximum mesiodistal and buccolingual diameters and also these diameters at the cementoenamel junction. The dental morphological features recorded were those of the Arizona State University system51, including reference to standard plaques illustrated in that work, and in ref. 52 for photographs of some other standard plaques. Other sources for recording measurements and anatomical characteristics are described in Supplementary Information.
Ancient DNA processing
Sampling, extraction, library preparation and indexing were performed in a dedicated clean room for ancient DNA at the MPI-SHH. We obtained bone powder from the right pars petrosa of the Leang Panninge individual by cutting along the margo superior and drilling near the cochlea53. DNA was extracted using a modified version of the ancient DNA protocol described in ref. 54. From the extract, we built a double-stranded library after partial uracil-DNA glycosylase treatment55 to reduce C>T transitions to the first two base pairs and a single-stranded library on an automated liquid handling system56. After double indexing with unique index combinations57, the libraries were shotgun-sequenced for a depth of approximately 4 million reads on an Illumina HiSeq 4000 at MPI-SHH using a 75-bp single-read configuration for initial quality assessments.
After further amplification, the libraries were hybridized in-solution to enrich for the complete mitogenome (mtDNA capture31) and twice for a targeted set of 2,986,592 SNPs across the human genome (two rounds of ‘1240K’ and ‘archaic ancestry’30 captures). The capture products were then sequenced on an Illumina HiSeq 4000 at MPI-SHH using a 75-bp single-read configuration. After AdapterRemoval as implemented in EAGER v.1.92.5658, the mtDNA-enriched reads were aligned to the mitochondrial reference genome (rCRS) and the reads from the genome-wide captures to the human reference genome (hg19) using a mapping quality filter of 30 for the circularmapper v.1.93.5 and BWA59 aligner, respectively. Duplicates were removed with DeDup v.0.12.2 (https://github.com/apeltzer/DeDup). Contamination of the single-stranded sequences was assessed with AuthentiCT v.1.060.
We reconstructed the mitochondrial consensus sequence and estimated mitochondrial contamination to 2 ± 1% using schmutzi61. The mitochondrial haplogroup was ascertained with Haplofind62. After merging with published data using mafft v.7.30563, we constructed a maximum parsimony tree in MEGA X64. On the basis of the misincorporation pattern determined by mapDamage v.2.0.9 as implemented in EAGER v.1.92.5658, we trimmed 2 bp off the 1240K-captured double-stranded library data and genotyped the trimmed and untrimmed sequences individually for the 1240K panel using samtools v.1.3 (https://github.com/samtools/samtools) and pileupCaller v.1.4.0.2 (https://github.com/stschiff/sequenceTools), which randomly calls one allele per SNP site. The untrimmed and trimmed genotypes were then combined, retaining only transversions from the untrimmed genotype and transitions from the trimmed genotype to maximize information from the trimmed ends. The single-stranded library data were instead genotyped using the single-stranded mode of pileupCaller and the two genotypes merged using a custom script. The resulting coverage was suitable for population genetics analyses with 263,207 SNPs on the 1240K and 135,432 SNPs on the Human Origins panel (HO). We also genotyped single-stranded and double-stranded data individually after filtering with PMDtools v.0.665.
Population genetic analyses
PCAs were performed using smartpca with shrinkmode and lsqmode enabled66, calculating the principal components from present-day East and southeast Asian and Oceanian individuals genotyped on the Human Origins panel18,32,33,34 and projecting all ancient genomes.
All f3-statistics and f4-statistics were calculated using qp3pop v.420 (inbreed: YES) and qpDstat v.721, respectively33. For f3-statistics, we used East and southeast Asian and Oceanian groups from the Human Origins dataset to include more comparative populations, whereas for f4-statistics, we used a more restricted dataset containing data from the Simons Genome Diversity Project (SGDP49) genotyped on the 1240K panel to maximize the number of overlapping SNPs with the Leang Panninge individual. The results of f3-statistics were plotted in the geographical location of the test group using ggplot2 v.3.3.3 in RStudio v.1.2.1335. To investigate the proportion of Denisovan-related ancestry (α), we calculated f4-ratio statistics using qpF4Ratio18,20,33, admixfrog41 and D-statistics33 with a custom script. Using qpWave33, we investigated whether we could distinguish between the Papuan-like ancestry present in the Leang Panninge individual compared with present-day Papuan individuals. Admixture proportions were estimated with qpAdm (allsnps: YES)33. After file conversion with PLINK v.1.967, we ran TreeMix v.1.1242 setting the Denisovan genome39 as the root and utilizing the parameters -k 150 and -global. Models were plotted using RColorBrewer v.1.1.2 in RStudio v.1.2.1335 and the fit was assessed by residual inspection after each additional migration edge was added. Admixture graphs with qpGraph33 were constructed (outpop: NULL, useallsnps: YES, blgsize: 0.05, forcezmode: YES, lsqmode: YES, diag: 0.0001, bigiter: 15, hires: YES, lambdascale: 1, initmix: 1,000, inbreed: YES) by adding one group after the other, moving from archaic humans over present-day groups to ancient samples and testing all possible one-way and two-way mixtures using a custom script. The decision on which model was chosen to progress with the addition of another group was made based on the lowest worst z-score calculated for each proposed tree. Admixture time estimation was calculated with DATES v.75368.
Reporting summary
Further information on research design is available in the Nature Research Reporting Summary linked to this paper.
|
|
|
|
Post by Admin on Oct 22, 2021 4:36:42 GMT
The Evolution of Humanity
Our lineage probably split from the chimpanzees around six million years ago. These first hominins, members of the human line, would barely have seemed human, however. For the first few million years, hominin evolution was slow.
The first big change was walking upright, which let hominins move away from forests into more open grassland and bush. But if they walked like us, nothing else suggests the first hominins were any more human than chimps or gorillas. Ardipithecus, the earliest well-known hominin, had a brain that was slightly smaller than a chimp’s, and there’s no evidence they used tools.
In the next million years, Australopithecus appeared. Australopithecus had a slightly larger brain; larger than a chimp’s, still smaller than a gorilla’s. It made slightly more sophisticated tools than chimps, using sharp stones to butcher animals.
Then came Homo habilis. For the first time, hominin brain size exceeded that of other apes. Tools like stone flakes, hammer stones, and “choppers” became much more complex. After that, around two million years ago, human evolution accelerated, for reasons we’re yet to understand.
Big Brains
At this point, Homo erectus appeared. Erectus was taller, more like us in stature, and had large brains, several times bigger than a chimp’s brain and up to two-thirds the size of ours. They made sophisticated tools, such as stone hand axes. This was a major technological advance. Hand axes needed skill and planning to create, and you probably had to be taught how to make one. It may have been a meta-tool used to fashion other tools, such as spears and digging sticks.
Like us, Homo erectus had small teeth. That suggests a shift from plant-based diets to eating more meat, probably from hunting.
It’s here that our evolution seems to accelerate. The big-brained Erectus soon gave rise to even larger-brained species. These highly intelligent hominins spread through Africa and Eurasia, evolving into Neanderthals, Denisovans, Homo rhodesiensis, and archaic Homo sapiens. Technology became far more advanced; stone-tipped spears and firemaking appeared. Objects with no clear functionality, such as jewelry and art, also showed up over the past half-million years.
Some of these species were startlingly like us in their skeletons, and their DNA.
Homo neanderthalensis, the Neanderthals, had brains approaching ours in size, and evolved even larger brains over time until the last Neanderthals had cranial capacities comparable to a modern human’s. They might have thought of themselves, even spoke of themselves, as human.
The Neanderthal archaeological record records uniquely human behavior, suggesting a mind resembling ours. Neanderthals were skilled, versatile hunters, exploiting everything from rabbits to rhinoceroses and woolly mammoths. They made sophisticated tools, such as throwing spears tipped with stone points. They fashioned jewelry from shells, animal teeth, and eagle talons, and made cave art. And Neanderthal ears were, like ours, adapted to hear the subtleties of speech. We know they buried their dead, and probably mourned them.
There’s so much about Neanderthals we don’t know, and never will. But if they were so like us in their skeletons and their behavior, it’s reasonable to guess they may have been like us in other ways that don’t leave a record—that they sang and danced, that they feared spirits and worshipped gods, that they wondered at the stars, told stories, laughed with friends, and loved their children. To the extent Neanderthals were like us, they must have been capable of acts of great kindness and empathy, but also cruelty, violence, and deceit.
Far less is known about other species, like Denisovans, Homo rhodesiensis, and extinct sapiens, but it’s reasonable to guess from their large brains and human-looking skulls that they were also very much like us.
Love and War
I admit this sounds speculative, but for one detail. The DNA of Neanderthals, Denisovans, and other hominins is found in us. We met them, and we had children together. That says a lot about how human they were.
It’s not impossible that Homo sapiens took Neanderthal women captive, or vice versa. But for Neanderthal genes to enter our populations, we had to not only mate but successfully raise children, who grew up to raise children of their own. That’s more likely to happen if these pairings resulted from voluntary intermarriage. Mixing of genes also required their hybrid descendants to become accepted into their groups; to be treated as fully human.
These arguments hold not only for the Neanderthals, I’d argue, but for other species we interbred with, including Denisovans and unknown hominins in Africa. Which isn’t to say that encounters between our species were without prejudice, or entirely peaceful. We were probably responsible for the extinction of these species. But there must have been times we looked past our differences to find a shared humanity.
Finally, it’s telling that while we did replace these other hominins, this took time. Extinction of Neanderthals, Denisovans, and other species took hundreds of thousands of years. If Neanderthals and Denisovans were really just stupid, grunting brutes, lacking language or complex thought, it’s impossible they could have held modern humans off as long as they did.
The Human Edge
Why, if they were so like us, did we replace them? It’s unclear, which suggests the difference was something that doesn’t leave clear marks in fossils or stone tools. Perhaps a spark of creativity—a way with words, a knack for tools, social skills—gave us an edge. Whatever the difference was, it was subtle, or it wouldn’t have taken us so long to win out.
While we don’t know exactly what these differences were, our distinctive skull shape may offer a clue. Neanderthals had elongated crania, with massive brow ridges. Humans have a bulbous skull, shaped like a soccer ball, and lack brow ridges. Curiously, the peculiar smooth, round head of adult Homo sapiens is seen in young Neanderthals, and even baby apes.
Similarly, juvenilized skulls of wild animals are found in domesticated ones, like domestic dogs: an adult dog skull resembles the skull of a wolf pup. These similarities aren’t just superficial. Dogs are behaviorally like young wolves, less aggressive and more playful.
My suspicion, mostly a hunch, is that Homo sapiens’ edge might not necessarily be raw intelligence, but differences in attitude. Like dogs, we may retain juvenile behaviors, things like playfulness, openness to meeting new people, lower aggression, more creativity and curiosity. This in turn might have helped us make our societies larger, more complex, collaborative, open, and innovative, which then outcompeted theirs.
|
|
|
|
Post by Admin on Oct 22, 2021 21:38:40 GMT
Female craniometrics support the ‘two-layer model’ of human dispersal in Eastern Eurasia Scientific Reports volume 11, Article number: 20830 (2021) Abstract This study reports a cranio-morphometric analysis of female human remains from seven archaeological sites in China, Vietnam and Taiwan that date between 16,000 and 5300 BP. The aim of the analysis is to test the “two-layer” model of human dispersal in eastern Eurasia, using previously unanalysed female remains to balance the large sample of previously-analysed males. The resulting craniometric data indicate that the examined specimens all belong to the “first layer” of dispersal, and share a common ancestor with recent Australian and Papuan populations, and the ancient Jomon people of Japan. The analysed specimens pre-date the expansion of agricultural populations of East/Northeast Asian origin—that is, the “second layer” of human dispersal proposed by the model. As a result of this study, the two-layer model, which has hitherto rested on evidence only from male skeletons, is now strongly supported by female-derived data. Further comparisons reveal that the people of the first layer were closer in terms of their facial morphology to modern Africans and Sri Lankan Veddah than to modern Asians and Europeans, suggesting that the Late Pleistocene through Middle Holocene hunter-gatherers examined in this study were direct descendants of the anatomically modern humans who first migrated out of Africa through southern Eurasia. Introduction Understanding the origins of the peoples of East Asia, Southeast Asia, and Oceania is hindered by the complexities of historical migratory processes, both temporal and geographical, as well as the unquantifiable degree of genetic exchange that has occurred since the Late Pleistocene, or even earlier. Tracing the population history of this region ultimately reduces into two main issues1. The first concerns the genealogical relationship between contemporary populations and the early anatomically modern humans (AMH) who migrated initially from Africa to eastern Eurasia. The second issue concerns the impact of the human population spread, with rice and millet farming technology, from the Yellow and Yangtze River regions of China after 9000 years BP, leading ultimately to population dispersal across eastern Eurasia and eventually the Pacific Islands2,3,4,5. Current debate about whether or not this demographic dispersal was driven by agricultural expansion, and how it might have articulated with pre-existing hunter-gatherer populations in eastern Eurasia, can be enhanced by investigating the initial expansion of AMH during the Late Pleistocene. Arguing against the two-layer model discussed in this paper, the “regional continuity” or “local evolution” model favors a scenario of multiregional evolution for modern humans, as represented by Turner’s Sundadont/Sinodont hypothesis6. This hypothesis assumes that the array of non-metric dental traits possessed by present-day Southeast Asians, that is, “Sundadont” traits in Turner’s terminology, are direct evidence for long-standing population continuity, uninterrupted by admixture with “Sinodont” peoples from the north. Multivariate craniometric analyses by others7,8 have also demonstrated close affinities between prehistoric and modern Southeast Asians, but they are mainly focused on Neolithic and early Metal Age samples from Thailand, Vietnam and Laos, hence they are not directly relevant for the issues discussed here. In our previous study, analysis of cranio-morphometric patterns in eastern Eurasian and Sahul specimens (approximately 800 skeletons from late Paleolithic through Iron Age contexts) strongly supported the “two-layer model” of AMH dispersal in these regions1. According to this model, the “first layer”, the original Late Pleistocene AMH colonizing population, shared a direct ancestry with present-day Indigenous Australians and Papuans. In Southeast Asia, this first layer is represented primarily by Hoabinhian hunter-gatherers whose skeletal remains date between 12,000 and 4000 BP, before the expansion of Neolithic farmers. In our previous study, we regarded the agricultural populations who cultivated rice (Oryza sativa; and some also cultivated millets) as the “second layer”, who brought northeast Asian cranial features into Southeast Asia during the Neolithic period (from ca. 4000 BP). Significantly, this two-layer model has hitherto been based only on male data sets. Male skulls were used for a variety of reasons, especially that morphological divergence is greater among male than female crania owing to greater male cranial size and robustness. Additionally, there are more male than female archaeological specimens available for study. Accordingly, our new study examines female skeletons from seven Late Pleistocene through Middle Holocene archaeological sites in China, Vietnam and Taiwan (Fig. 1: site location map). The oldest comes from Yahuai Cave (n = 1) in Guangxi Province, southern China. Nine more pre-farming individuals come from Huiyaotian (n = 6) and Liyupo (n = 3) in Guangxi Province, southern China. A further three come from Hang Cho (n = 1), Mai Da Dieu (n = 1), and Bau Du (n = 1) in Vietnam. One comes from Xiaoma Cave (n = 1) in southeastern Taiwan. Figure 1 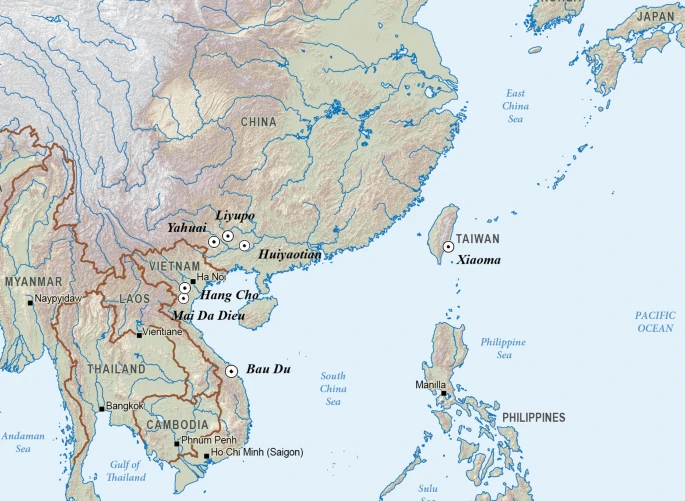 In the context of the two-layer model, these analyzed specimens are all presumed to have been members of the first layer of human dispersal. Our study compares the craniometric features of the aforementioned female specimens with those of contemporary populations in Africa, Eurasia, and Melanesia. Although many other female skeletons have been reported from Late Paleolithic, Neolithic and Iron Age sites across the region, the lack of standardization in the recorded measurements and the lack of published data make it difficult to include them. Instead, we use comparative data from modern populations measured according to our standard protocols. |
|
|
|
Post by Admin on Oct 23, 2021 0:38:10 GMT
The study sites Table 1 presents details of the analysed remains and archaeological sites, including pertinent radiocarbon dates. Figure 2 exhibits the analysed cranial specimens unearthed from these focal sites. Sex was determined from pelvic and cranial morphology, and other post-cranial markers9. Sex determinations for new individuals reported in this study are described, otherwise details can be found in the cited publications. Table 1 AMS radiocarbon dating of human remains in this study. From: Female craniometrics support the ‘two-layer model’ of human dispersal in Eastern Eurasia Site and locality Burial or layer number Calibrated date range Material dated Laboratory code Citation Yahuai Cave, Long’an County, Guangxi, China Layers 6, 7 16,355–16,086 BP Charcoal BA160129 BETA444301 BA160130 Wu et al.10 Huiyaotian Shell Midden, Nanning City, Guangxi, China Layers 3–5 9030–8315 BP Charred Canarium seeds, human tooth BETA429237 BETA429238 BETA429239 Matsumura et al.12 Liyupo Site, Long’an County, Guangxi, China Layers 2, 3; burial M12, M35 8025–6741 BP Charred Canarium seeds, human tooth and bone, charcoal IAAA143260 BETA429240 BETA429241 BETA429242 Matsumura et al.12 Hang Cho Cave, Luong Son District, Hoa Binh Province, Vietnam 04HcH3-M1 10,750–10,150 BP Human tooth No lab number; sample submitted by M. Yoneda Matsumura et al.15 Mai Da Dieu Cave, Ba Thuoc District, Thanh Hoa Province, Vietnam 84MDD-M1 8200–7970 BP Charcoal Bln3540 Bln3541 Truong and Phong19 Bau Du Shell Midden, Nui Thang District, Quang Nam Province, Vietnam 14BD1-M4 5600–5270 BP; 5390–5270 BP Charcoal ANU54809–54814 (six samples) Bln3040 Nguyen20 Xiaoma Cave, Taidong County, Taiwan C5 6189–5920 BP; 5996–5725 BP Marine shells No lab numbers; samples submitted by S.C. Huang Huang and Chen21 Figure 2 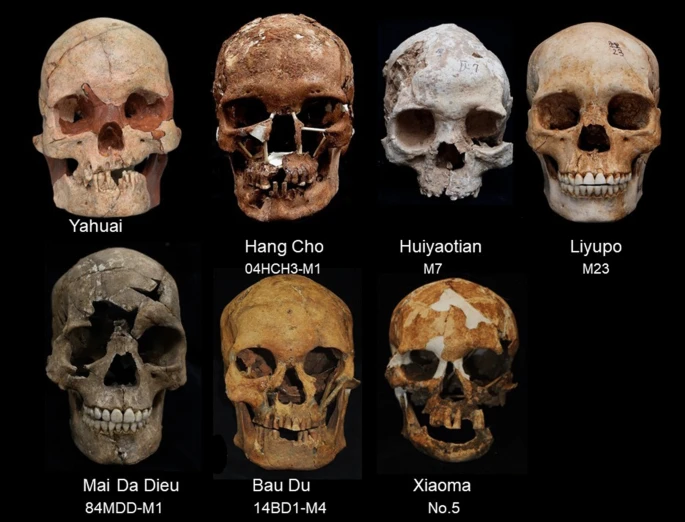 Frontal profiles of the seven analysed female crania. |
|

