|
|
Post by Admin on Dec 3, 2021 2:47:38 GMT
3.1. Samples
Over a span of three decades, C. G. Turner II amassed the world's largest database on human tooth crown and root morphology. His initial interest was the use of teeth to address the peopling of the Americas (cf. Turner 1971), but after collecting data on almost 10,000 Native Americans from the Arctic, North America, and South America, he shifted his focus to Asia and the Pacific. He also collected data on many European populations, while Africa and India received limited attention. His tabulated data and individual data sheets are at the core of this analysis.6
The age of the samples in the database is highly variable and in large part dependent on what skeletal material was recovered and curated in the various museums on Turner's itinerary. In his provenance forms, materials recovered prior to the advent of radiocarbon dating are noted as recent, historic, or prehistoric; archaeological periods are noted when possible. Where radiocarbon dates were available, the temporal ranges for a sample were noted with more precision (Table 1).
Table 1 Jomon and Ainu samples by size, location, and time period. (Table view)
Group Sample n Location Time period
Jomon Tokyo 363 Central Japan 2500–300 BC
Ota 47 Honshu Early to Middle Jomon
Tsukomo 32 Honshu Late Jomon
Kyushu 12 Kyushu Late Jomon
Yosekura 32 Honshu Middle to Late Jomon
Hokkaido 136 Hokkaido Early to Late Jomon
Yoshiko 101 Honshu Late Jomon
Total = 723
Ainu Ainu No. 1 88 Hokkaido Historic to Living
Ainu No. 2 45 Sakhalin Historic to Recent
Hokkaido No. 1 26 Hokkaido Shellmounds to Recent
Hokkaido No. 2 116 Hokkaido Middle to Late Edo
Sakhalin Ainu 55 Sakhalin Shellmounds to Recent
Total = 330
As the focus on this paper is the biological relationship between the Jomon and Native American populations, only those groups are noted for each time period. First, in the Americas, Turner examined Paleoindians when possible, but they are limited in number and often provide little data due to pronounced tooth wear. The Native American samples used in this analysis range in age from historic to early Holocene. It was not feasible to break North and South American samples into finer age categories. While this would be a serious problem with archaeological materials, it is less significant for teeth. The dentition is under strong genetic control and is highly conserved from a temporal standpoint.
Turner made observations on seven Jomon samples, mostly from Honshu but also from Kyushu and Hokkaido. The Hokkaido sample (n = 136) is noted as Early to Late Jomon, with other samples (n = 587) noted as Middle to Late Jomon or only as Late Jomon. On the computer printouts, he used a combined Jomon sample because they all showed similar frequency profiles (a finding verified in this analysis). The five Ainu samples from Hokkaido and Sakhalin (n = 330) were historic in age. Like the Jomon, the Ainu samples were uniform, so his frequency table combined the five samples into one large Ainu sample.
3.2. Measuring biodistance
In biological anthropology, it is commonplace to use distance statistics to evaluate similarities and differences between groups and to make inferences about population origins and relationships (cf. Pilloud and Hefner 2016). The fundamental assumptions underlying biological distance statistics are listed by Scott (1992, 152), beginning with groups with numerous genetically mediated biological differences are distantly related, while groups showing a preponderance of similarities have a recent common ancestor. Traits should be neutral for the most part with founder effect and genetic drift as the primary driving forces in differentiation. Traits under strong selective pressure (e.g., sickle-cell anemia) should not be used to assess affinity. Gene flow between two or more groups results in convergence and can have an adverse impact on distance statistics. To avoid sampling error, as many traits as possible should be used to calculate pairwise distances.
Dissimilarity statistics are based on the premise that a group's distance from itself is “zero” and that small pairwise values indicate closer similarity than large pairwise values. Euclidean and Bray–Curtis distances were used here, but the results from the two methods were highly correlated (r = 0.94), so we present only the results of the Euclidean distances computed using Numerical Taxonomy System software (pc-NTSYS; Rohlf 1993). Distance matrixes are the basis for generating dendrograms or “trees” to provide a visual representation of relative distance. Of the many options available through pc-NTSYS, we use the unweighted pair groups method (UPGMA).
3.3. A new method: rASUDAS
Although population differences in dental morphology among world populations are well established (Scott et al. 2018a), only recently has a web-based application been developed to evaluate the ancestry of single individuals within a sample (rASUDAS or R programming in conjunction with the Arizona State University Dental Anthropology System).7 Using a naïve Bayes algorithm, the application calculates the probability that an individual can be assigned to one of seven major geno-geographic groups: Western Eurasia, Sub-Saharan Africa, East Asia, Southeast Asia & Polynesia, Austral-Melanesia & Micronesia, American Arctic & Northeast Asia, and American Indian. (Given their indeterminate status (see below), data on Jomon and Ainu were not used to derive the East Asian frequencies used in the Bayes algorithm.)
|
|
|
|
Post by Admin on Dec 3, 2021 20:01:48 GMT
3.4. Jomon and Ainu
Our analyses are designed to test the hypothesis that the Native American founder population is derived from the people who made stemmed points in Japan and adjoining areas of Northeast Asia roughly 16,000 cal yr BP. These people are known as the Jomon and they represent an earlier population in Japan that was partially replaced through admixture by the Yayoi ancestors of the modern Japanese people ∼2300 cal yr BP. The northern Japanese island of Hokkaido is inhabited by a population (Ainu) that is more closely related to the Jomon than to contemporary Japanese on the main island (Turner 1976). Our analyses are therefore focused on the relationship between Native Americans and the Jomon/Ainu.
As the relationships of the Jomon and Ainu are the primary focus, we excluded Western Eurasia (Europe, India, North Africa, Middle East) and Sub-Saharan Africa samples from our analysis. In the biodistance analysis and rASUDAS application, we included populations from East and Southeast Asia, the New World, and Pacific. All samples in the biodistance analysis are composites of many groups and most sample sizes are very large (thousands of individuals). Table 2 lists the crown and root traits and their breakpoints for the biodistance and rASUDAS analyses. Table 3 shows the dental trait frequencies for the Jomon and Ainu, along with 14 additional regional groups.
An examination of the 21 crown and root trait frequencies (Table 3) shows Jomon and Ainu are like one another for some characteristics but exhibit distinct differences for others. For many traits, they differ from all other Asian, Pacific, and New World populations. Compared to East Asians, the Jomon and Ainu have: (1) significantly less shoveling and double-shoveling of UI1; (2) more 3-cusped UM2; (3) lower frequencies of UM1 Carabelli's trait; (4) more root reduction of UM2; (5) more four-cusped LM2; and (6) a lower frequency of three-rooted LM1. In some instances, Jomon frequencies are closer to East Asia than they are to the Ainu (e.g., UI1 winging, cusp 6 LM1), but conversely, the Ainu are closer to East Asians for even more traits (e.g., UI1 interruption grooves, UM1 enamel extensions, pegged-reduced-missing UM2, and LM2 root number).
Although a trait-by-trait comparison provides some insights into the affinities of the Jomon and Ainu, in particular the significant reduction of shoveled incisors, pairwise distance values provide an overall summary of trait frequency differences among the 16 groups in the sample matrix.
3.5. Biodistance with a focus on Jomon/Ainu
In a distance matrix with 16 groups, there are 110 pairwise distances (Table 4). For mean Euclidean distances, the closest values for both Jomon and Ainu are with Southeast Asia & Polynesia (0.690/0.741). Mean distances from Austral-Melanesia are almost identical for the two groups (0.930/0.986). The average distances to the Americas are substantially larger for the Jomon (1.122) but are like the distance value from Austral-Melanesia for the Ainu (0.973). Relative to East Asia, the Jomon are more distant (0.959) than the Ainu (0.741), likely a reflection of gene flow between mainland Japanese and Ainu populations in recent times.
Table 4 Symmetrical matrix of Euclidean distance values. (Table view)
1 2 3 4 5 6 7 8 9 10 11 12 13 14 15 16
1 Jomon 0.000 0.560 0.902 1.104 0.978 0.878 0.986 1.110 1.310 1.327 0.709 0.944 0.964 0.670 0.883 1.145
2 Ainu 0.560 0.000 0.619 0.917 0.687 0.756 0.818 0.959 1.197 1.136 0.544 1.060 0.950 0.632 0.948 1.107
3 Japan 0.902 0.619 0.000 0.469 0.285 0.627 0.622 0.728 0.958 0.841 0.575 1.051 1.283 0.834 1.078 1.111
4 AnYang (China) 1.104 0.917 0.469 0.000 0.579 0.826 0.747 0.930 1.153 1.025 0.731 1.041 1.433 1.010 1.195 1.321
5 S China 0.978 0.687 0.285 0.579 0.000 0.757 0.685 0.691 0.915 0.785 0.551 1.098 1.286 0.887 1.019 1.037
6 Eskaleut 0.878 0.756 0.627 0.826 0.757 0.000 0.381 0.584 0.834 0.773 0.917 1.261 1.415 1.044 1.284 1.381
7 NW Coast 0.986 0.818 0.622 0.747 0.685 0.381 0.000 0.425 0.697 0.579 0.893 1.252 1.447 1.079 1.291 1.373
8 North America 1.110 0.959 0.728 0.930 0.691 0.584 0.425 0.000 0.337 0.287 0.952 1.322 1.497 1.191 1.287 1.289
9 Mesoamerica 1.310 1.197 0.958 1.153 0.915 0.834 0.697 0.337 0.000 0.304 1.150 1.451 1.657 1.363 1.425 1.335
10 South America 1.327 1.136 0.841 1.025 0.785 0.773 0.579 0.287 0.304 0.000 1.058 1.463 1.682 1.323 1.426 1.337
11 Southeast Asia 0.709 0.544 0.575 0.731 0.551 0.917 0.893 0.952 1.150 1.058 0.000 0.694 0.837 0.511 0.605 0.841
12 Australia 0.944 1.060 1.051 1.041 1.098 1.261 1.252 1.322 1.451 1.463 0.694 0.000 0.870 0.707 0.727 1.073
13 New Guinea 0.964 0.950 1.283 1.433 1.286 1.415 1.447 1.497 1.657 1.682 0.837 0.870 0.000 0.759 0.726 1.189
14 Polynesia 0.670 0.632 0.834 1.010 0.887 1.044 1.079 1.191 1.363 1.323 0.511 0.707 0.759 0.000 0.602 0.833
15 Melanesia 0.883 0.948 1.078 1.195 1.019 1.284 1.291 1.287 1.425 1.426 0.605 0.727 0.726 0.602 0.000 0.695
16 Micronesia 1.145 1.107 1.111 1.321 1.037 1.381 1.373 1.289 1.335 1.337 0.841 1.073 1.189 0.833 0.695 0.000
Euclidean distance values were used to derive the UPGMA tree (unweighted pair groups) shown as Figure 2. The dendrogram exhibits a deep primary bifurcation between East Asians and Native Americans in the lower branches, and between Southeast Asians and Pacific populations in the upper branches. Jomon and Ainu cluster with one another and, excluding Micronesians, are the first branch to separate from Southeast Asian and Pacific populations. While Jomon and Ainu cluster together, the split between the two is deeper than any of the East Asian and Native American branches.
|
|
|
|
Post by Admin on Dec 3, 2021 22:09:37 GMT
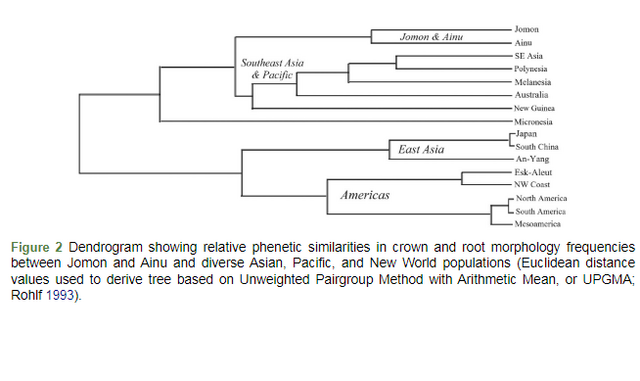 Figure 2 Dendrogram showing relative phenetic similarities in crown and root morphology frequencies between Jomon and Ainu and diverse Asian, Pacific, and New World populations (Euclidean distance values used to derive tree based on Unweighted Pairgroup Method with Arithmetic Mean, or UPGMA; Rohlf 1993). Some general observations are: (1) although Jomon and Ainu are far from being identical to one another dentally, they are more similar to one another than they are to any other Asian, Pacific, or New World grouping; (2) the five Native American groups always cluster together and are aligned with East Asians; and (3) Jomon and Ainu cluster with Southeast Asian and Pacific populations. For Jomon, the second most similar group was Austral-Melanesian, but for the Ainu, the second group was East Asian. For both groups and both distances, they were most divergent from Native Americans. 3.6. Individual ancestry (rASUDAS) The web-based application rASUDAS2 has scroll-down categories where individuals are scored for a series of crown and root traits (minimum of 12, maximum of 26). Once data are entered, the program produces a table with the posterior probabilities of that individual being assigned to one of the five geno-geographic groups noted previously (Western Eurasians and Sub-Saharan Africans were excluded from our analysis). In Table 5, the frequencies of individuals with a primary assignment to each of the five major groups are listed in columns under each group. For example, 12.5% of North Alaska Iñupiat had the highest probability of assignment with East Asia; 58.9% were classified as American Arctic, 20.3% as non-Arctic American, 5.7% as Southeast Asian, and 2.6% as Austral-Melanesian. Row totals equal 100% (values noted as frequencies in the table, not percentages). For 10 of 12 regions, multiple samples were evaluated. Chi-square values were computed to determine if there were intra-regional differences in ancestry assignment. In no case was there a significant difference between regional samples, including comparisons of the three Ainu and four Jomon samples. As this is the first major effort using rASUDAS to evaluate individual ancestry, the consistency of assignments within regions is a significant finding. Table 5 Individual ancestry assignments and mean posterior probabilities for assignments based on rASUDAS2. (Table view)
ample	n	East Asia	American Arctic	Non-Arctic American	Southeast Asia	Austral-Melanesia	Chi-square	D.F.	P
ESKIMO-ALEUT
North Alaska	34	0.118	0.706	0.059	0.029	0.088
St. Lawrence Island	55	0.091	0.600	0.182	0.109	0.018	16.990	12	0.150
Kodiak Island	66	0.167	0.500	0.273	0.045	0.015
Aleuts	37	0.108	0.622	0.243	0.027	0.000
Eskimo-Aleut total	192	0.125	0.589	0.203	0.057	0.026
Mean posterior prob.	 	0.183	0.458	0.237	0.085	0.037
NORTHWEST COAST
Northern Maritime	30	0.033	0.533	0.200	0.067	0.167
Central Maritime	20	0.200	0.450	0.300	0.050	0.000	13.962	8	0.083
Gulf of Georgia	41	0.220	0.341	0.415	0.000	0.024
Northwest Coast total	91	0.152	0.429	0.319	0.033	0.066
Mean posterior prob.	 	0.190	0.346	0.340	0.072	0.053
NORTH AMERICA
Arkansas	45	0.156	0.200	0.556	0.089	0.000
Alabama	101	0.109	0.168	0.663	0.040	0.020
California	46	0.130	0.348	0.478	0.021	0.021	12.113	16	0.736
Grasshopper (Arizona)	59	0.102	0.271	0.542	0.068	0.017
Cibola Anasazi	56	0.089	0.196	0.607	0.071	0.036
North America total	307	0.114	0.226	0.586	0.055	0.020
Mean posterior prob.	 	0.161	0.280	0.449	0.082	0.028
SOUTH AMERICA
Ecuador	39	0.128	0.154	0.667	0.051	0.000
Peru	38	0.079	0.184	0.684	0.053	0.000	2.030	8	0.98
Brazil	65	0.108	0.154	0.708	0.000	0.031
South America total	142	0.106	0.162	0.690	0.028	0.014
Mean posterior prob.	 	0.161	0.213	0.514	0.084	0.028
AUSTRAL-MELANESIA
Australia	42	0.071	0.000	0.048	0.071	0.810	1.874	4	0.599
New Britain	73	0.068	0.000	0.014	0.123	0.795
Australia-New Britain total	115	0.070	0.000	0.026	0.104	0.800
Mean posterior prob.	 	0.078	0.016	0.030	0.254	0.622
MICRONESIA
Guam	54	0.093	0.056	0.074	0.389	0.389
Mean posterior prob.	 	0.145	0.054	0.079	0.369	0.353
POLYNESIA
Mokapu	55	0.127	0.091	0.036	0.455	0.291
Mean posterior prob.	 	0.168	0.088	0.061	0.391	0.293
SOUTHEAST ASIA
Ban Chiang	19	0.158	0.000	0.105	0.263	0.474
Burma	16	0.250	0.000	0.000	0.500	0.250	2.839	8	0.585
Thailand	60	0.183	0.083	0.133	0.283	0.317
Southeast Asia total	95	0.189	0.053	0.105	0.316	0.337
Mean posterior prob.	 	0.215	0.092	0.106	0.292	0.295
EAST ASIA
Japan Hiogi	21	0.429	0.190	0.158	0.190	0.053
Japan Kamakura	49	0.388	0.184	0.184	0.184	0.061
Japan Kanto	35	0.257	0.257	0.086	0.257	0.143	11.295	16	0.791
Japan Ku	61	0.393	0.279	0.131	0.131	0.066
Japan Tokyo	29	0.448	0.172	0.207	0.103	0.069
Japan total	195	0.379	0.226	0.149	0.169	0.077
Mean posterior prob.	 	0.343	0.215	0.167	0.178	0.098
China	69	0.507	0.101	0.203	0.145	0.043	6.53	4	0.163
Mongolia	37	0.514	0.270	0.108	0.081	0.027
China + Mongolia	106	0.509	0.160	0.170	0.123	0.038
Mean posterior prob.	 	0.381	0.195	0.207	0.152	0.066
Japan	195	0.379	0.226	0.149	0.169	0.077	7.012	4	0.135
China-Mongolia	106	0.509	0.160	0.170	0.123	0.038
AINU
Ainu Hokkaido 1	57	0.140	0.316	0.053	0.140	0.351
Ainu Hokkaido 2	72	0.208	0.333	0.069	0.139	0.250	5.269	8	0.728
Ainu Sakhalin	19	0.316	0.211	0.105	0.158	0.211
Ainu total	148	0.196	0.311	0.068	0.142	0.284
Mean posterior prob.	 	0.208	0.228	0.105	0.221	0.238
JOMON
Jomon Hokkaido	50	0.180	0.280	0.040	0.100	0.400
Jomon Tokyo	34	0.176	0.176	0.118	0.147	0.382	10.568	12	0.566
Jomon Honshu	37	0.135	0.243	0.081	0.027	0.514
Jomon Yoshigo	42	0.119	0.357	0.000	0.071	0.452
Jomon total	163	0.153	0.270	0.055	0.086	0.436
Mean posterior prob.	 	0.187	0.231	0.080	0.190	0.312
Ainu total	148	0.196	0.311	0.068	0.142	0.284	8.530	4	0.074
Jomon total	163	0.153	0.270	0.055	0.086	0.436
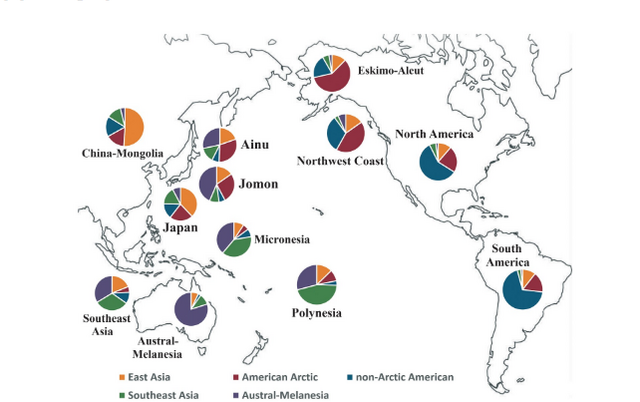 Figure 3 Percent of individual assignments within 12 Asian, Pacific, and New World groups to 5 major geno-geographic groups; percentages determined by rASUDAS web-based application in conjunction with nonmetric crown and root trait expressions (see Scott et al. (2018c) for method and link to application). In addition to ancestral assignment percentages, there is an additional row that shows mean posterior probabilities. Every individual has a probability of assignment to a specific group. These probabilities were averaged to provide another measure of group assignment. The two values (per cent assignments and mean probabilities) show the same pattern of ranking but differ in specific values. Figure 3 provides a visual representation of per cent ancestry assignments for the major population groups of Asia, the Pacific, and the Americas. |
|
|
|
Post by Admin on Dec 4, 2021 2:40:32 GMT
3.6.1. Americas
General observations are: (1) the total assignment of individuals to American Arctic and non-Arctic American is between 75 and 85%; (2) from north to south, the assignment of individuals to American Arctic follows a gradient from 59% to 43% to 23% to 16%; (3) from north to south, the assignment of individuals to non-Arctic American increases from 20% to 32% to 59% to 69%; (4) assignments to East Asia are consistent, ranging from 10.6% to 15.2%; and (5) assignments to combined Southeast Asia and Austral-Melanesians are 4–10%.
3.6.2. Pacific
The assignment of Australians and Melanesians to Austral-Melanesia is 80%, higher than that for any other group. There is a hint of Southeast Asia, but East Asia and the Americas barely register. Micronesia, represented by Guam, shows an almost identical contribution from Southeast Asia (39%) and Austral-Melanesia (39%), with a small number assigned to East Asia (9%) and the Americas (13%). Polynesia, represented by a Hawaiian sample, shows a stronger Southeast Asian component (46%) than Micronesia but still retains a substantial Austral-Melanesian aspect (29%). Percentages are lower for East Asia (13%) and the Americas (13%).
3.6.3. Asia
Southeast Asia shows a relatively low percentage of individuals that are assigned to Southeast Asia (32%), which is not surprising (in most analyses of crown and root morphology, Southeast Asia is intermediate among the dental patterns of Afridonty, Eurodonty, and Sinodonty). Slightly more Southeast Asians are classified as Austral-Melanesian (34%). On some occasions, individuals from this area are classified as East Asian (19%) or Native American (16%). For East Asia, Japan has a plurality of individuals assigned to East Asia (38%), but the two combined American groups reach the same percentage (38%). Some mainland Japanese classify as Southeast Asian (17%) but rarely as Austral-Melanesian (8%). China and Mongolia show a stronger East Asian signal than Japan, where half of the individuals (51%) classify as East Asian. The Native American signal remains strong for China and Mongolia (33%, combined for two New World groups), but fewer individuals are assigned to Southeast Asia (12%) and Austral-Melanesia (4%).
3.6.4. Jomon and Ainu
Although they differ in some respects from the biodistance measures (see above), the results from the rASUDAS analysis are similar for Jomon and Ainu. For both groups, the highest percentages of assignment are with Austral-Melanesia (44 and 28%), with the second highest percentages associated with American Arctic (27 and 31%). East Asia is similar for both (15–20%) as is non-Arctic American (6–7%). Surprisingly, only 9–14% were assigned to Southeast Asia, the region with the lowest average distance values (Figure 3).
3.7. Out of Jomon/Ainu?
The UPGMA tree based on Euclidean biodistance values yields the following clusters: (1) the five Native American groups; (2) the three East Asian groups; (3) the four Austral-Melanesian groups; and (4) the Jomon and Ainu. The tree based on Euclidean distances shows Jomon and Ainu cluster with Southeast Asia and the Pacific. The analysis of individual ancestry through rASUDAS2 provides a different perspective on Jomon/Ainu links. Over 40% of Jomon individuals were assigned to Austral-Melanesian, with the second most common assignment being American Arctic (27%). More individuals are assigned to East Asia (15%) than to Southeast Asia (9%), a finding at odds with their smallest genetic distance to Southeast Asia. The mean posterior probabilities show a slightly different picture. While Austral-Melanesian still has the highest average posterior probability (0.312), the values for American Arctic (0.231), East Asia (0.187), and Southeast Asia (0.190) are almost identical. The only group that does not match the Jomon dental pattern is non-Arctic American (5.5%; 0.080 average). And compared to other groups, the Jomon are dentally heterogeneous.
For individual ancestry assignment, the Ainu parallel the Jomon to some extent. Fewer are classified as Austral-Melanesian (28%), while more are classified as American Arctic (31%). Again, more are assigned to East Asia (20%) than to Southeast Asia (14%), with very few classified as non-Arctic American (7%). The average posterior probabilities are even more uniform for the Ainu than for the Jomon, with Austral-Melanesian (0.238), American Arctic (0.228), Southeast Asia (0.221), and East Asia (0.208) showing nearly equal values, with non-Arctic American (0.105) as the only exception.
|
|
|
|
Post by Admin on Dec 4, 2021 21:40:19 GMT
Figure 4 is a stacked bar chart that contrasts the ancestral assignments of four Jomon, three Ainu, and five Native American samples. Observations from this figure include the following: (1) the Jomon and Ainu samples are internally consistent; (2) the Jomon show a larger Austral-Melanesian component (38–51%) than the Ainu (21–35%), but both show about the same American Arctic component (Jomon: 18–36%; Ainu 21–33%); (3) the non-Arctic American component for both the Jomon (5.5%) and Ainu (6.8%) is the smallest for either group; (4) in contrast to the Jomon and Ainu, Native American samples show a small (< 10%) component of Southeast Asian/Austral-Melanesian combined, and a consistent East Asian component (10–15%); and (5) consistent with a long period of isolation and differentiation from a late Pleistocene common ancestor, 75–85% of all Native Americans are classified as either Arctic American or non-Arctic American. Given the significant contrast between the Jomon/Ainu and all Native American lineages, dental morphology does not support any ancestral relationship between the earlier peoples of the Japanese archipelago and the populations of the New World from its northernmost to southernmost extreme.  |
|


