Post by Admin on Feb 5, 2021 7:19:55 GMT
Figure 2: Shared ancestry among samples within the Americas.
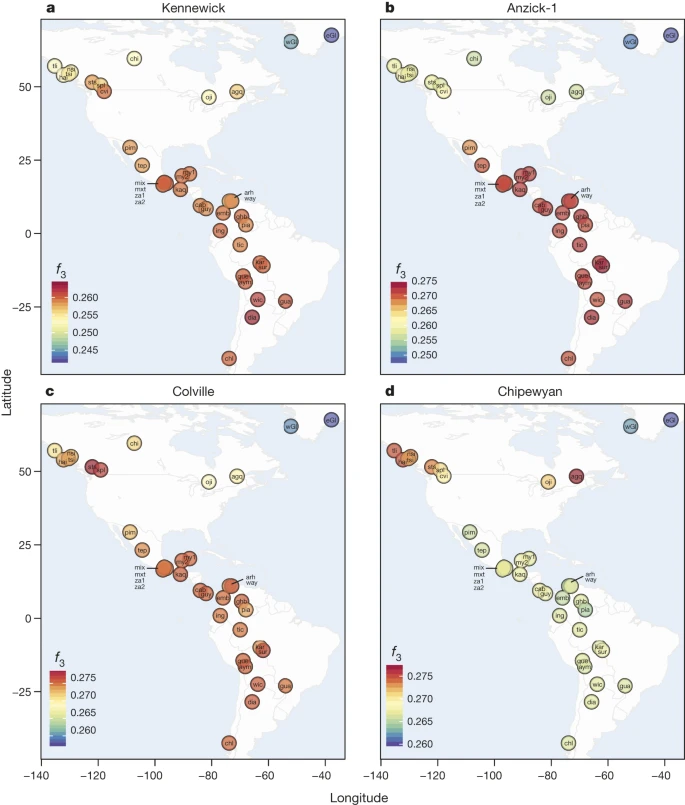
a–d, Heat maps of f3-outgroup statistics testing (YRI; Native Americans, X), where X is Kennewick Man (a), Anzick-1 (b), Colville (c) or Chipewyan (d). Warmer colours indicate higher allele sharing, for list of population labels, see the Methods section.
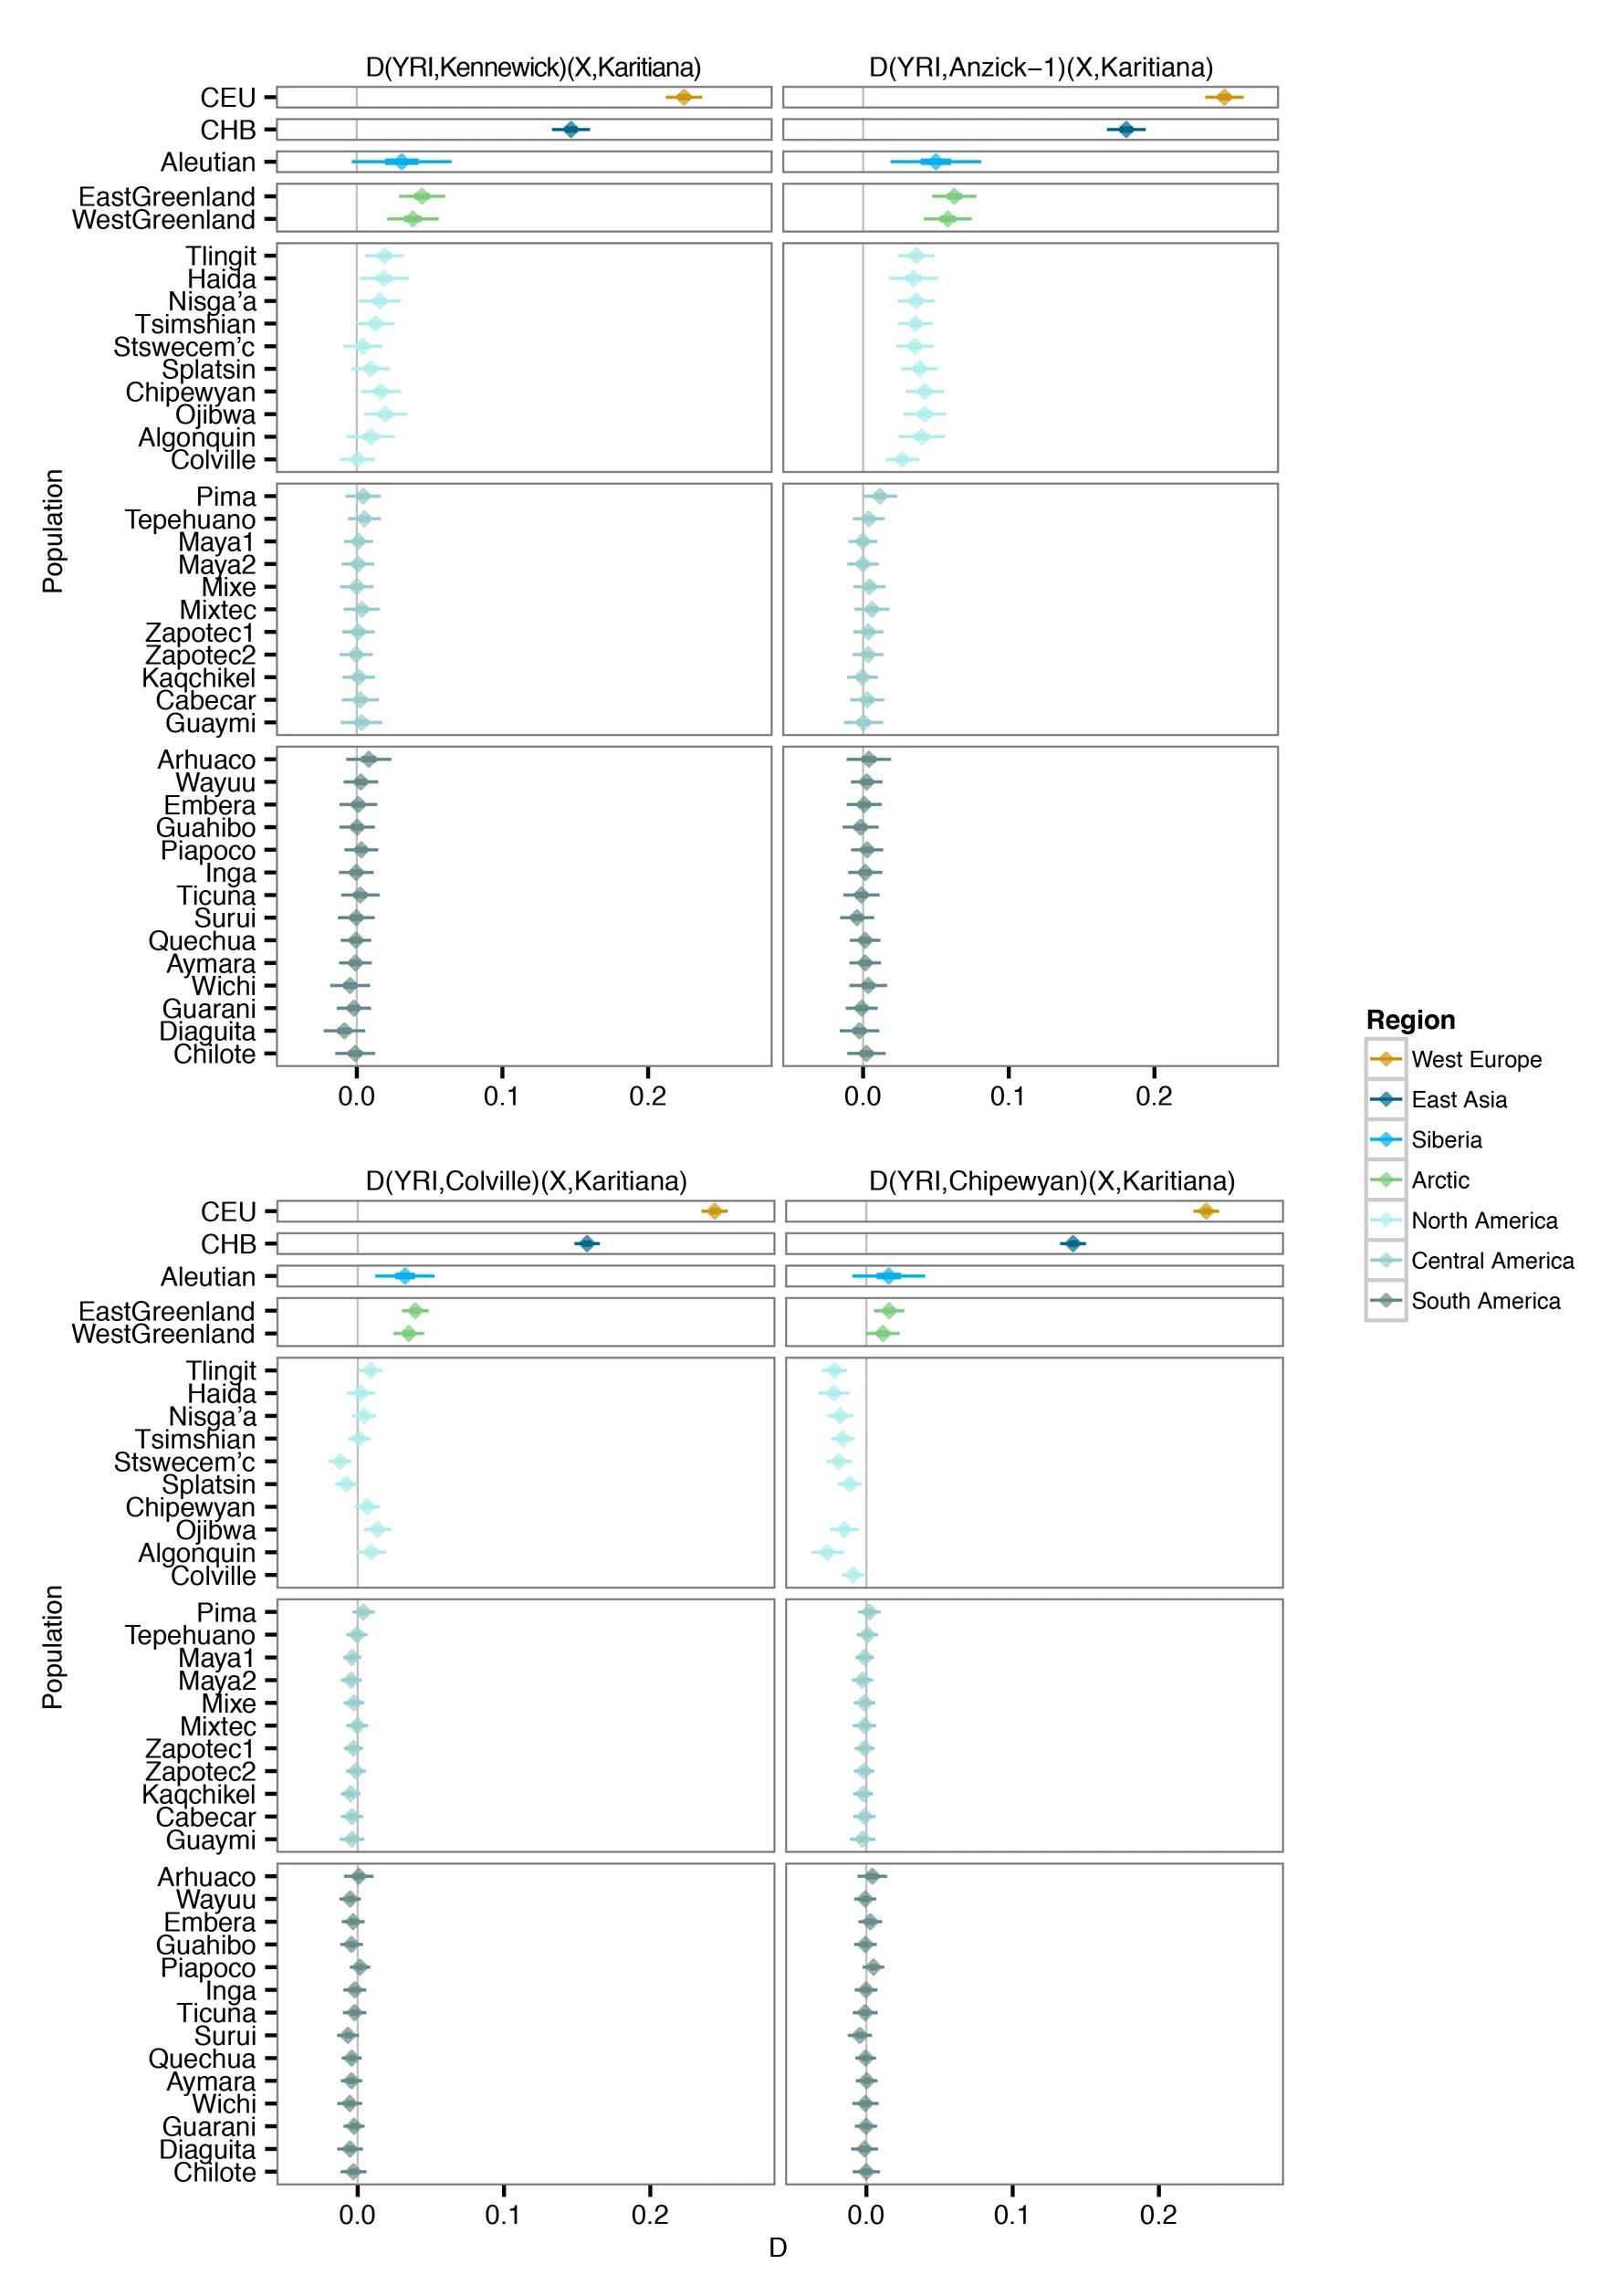
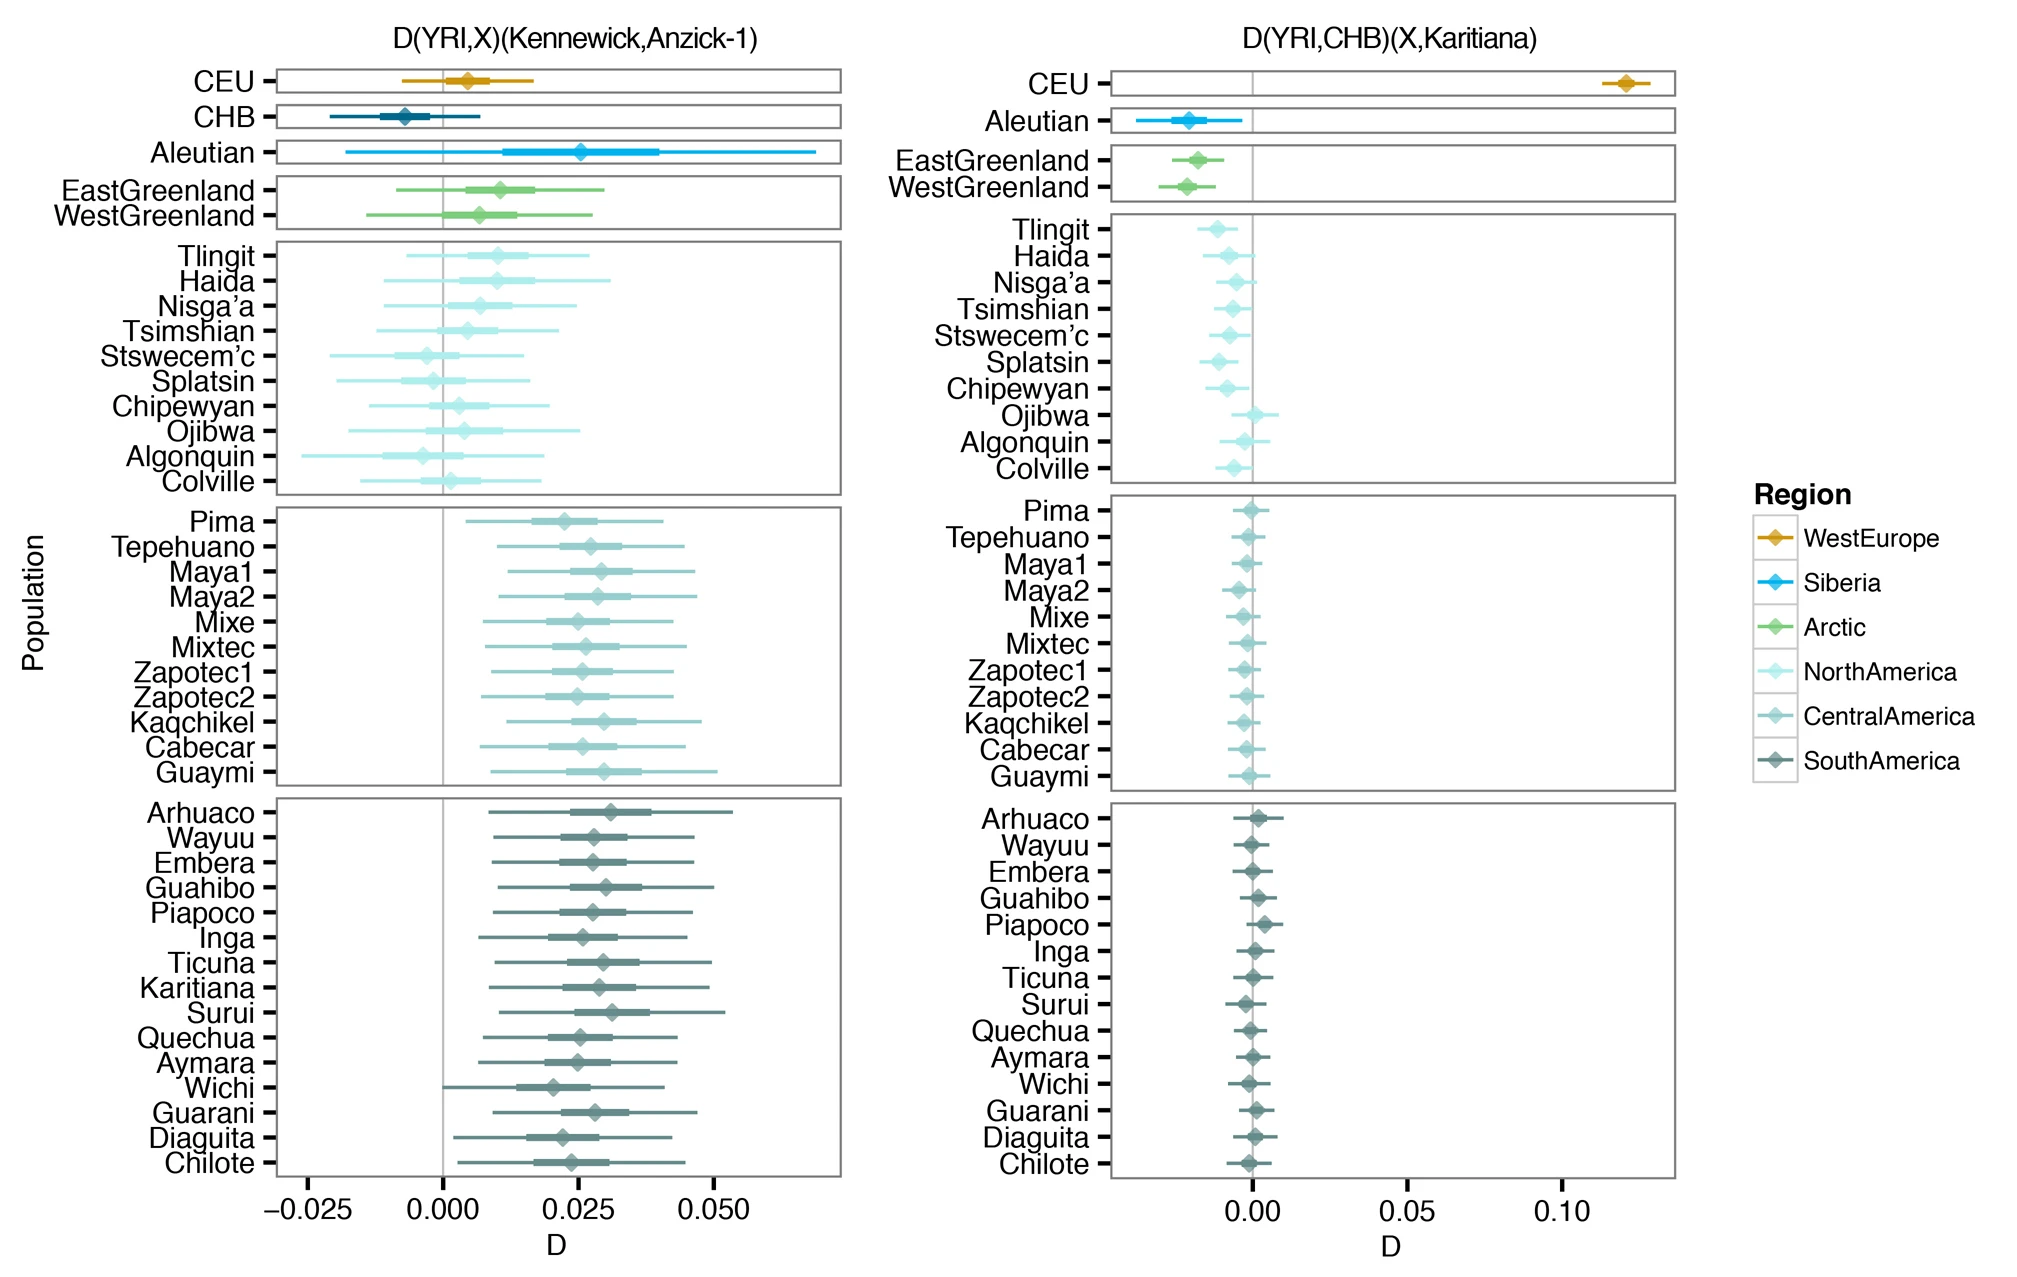
Our results are in agreement with a basal divergence of Northern and Central/Southern Native American lineages as suggested from the analysis of the Anzick-1 genome12. However, the genetic affinities of Kennewick Man reveal additional complexity in the population history of the Northern lineage. The finding that Kennewick is more closely related to Southern than many Northern Native Americans (Extended Data Fig. 4) suggests the presence of an additional Northern lineage that diverged from the common ancestral population of Anzick-1 and Southern Native Americans (Fig. 3). This branch would include both Colville and other tribes of the Pacific Northwest such as the Stswecem’c, who also appear symmetric to Kennewick with Southern Native Americans (Extended Data Fig. 4). We also find evidence for additional gene flow into the Pacific Northwest related to Asian populations (Extended Data Fig. 5), which is likely to post-date Kennewick Man. We note that this gene flow could originate from within the Americas, for example in association with the migration of paleo-Eskimos or Inuit ancestors within the past 5,000 years25, or the gene flow could be post-colonial19.
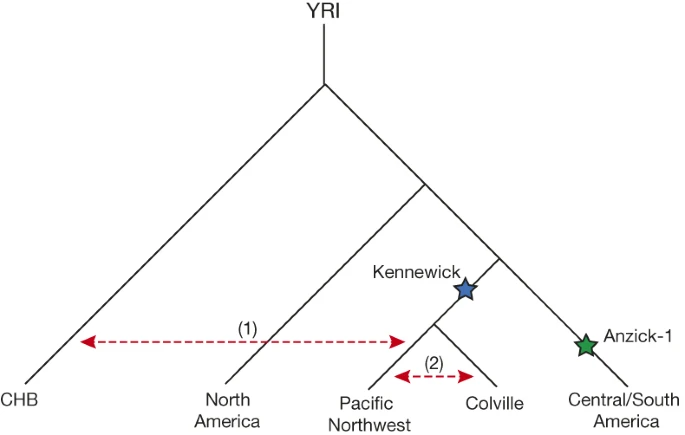
Figure 3: Illustration of Native American population history.
Depicted is a population tree consistent with the broad affinities between modern and ancient Native Americans. Kennewick Man and the Anzick-1 child are indicated with blue and green stars respectively. Red dashed arrows indicate gene flow (1) of Asian-related ancestry with tribes of the Pacific Northwest and (2) between Colville and neighbouring tribes.
We used a likelihood ratio test to test for direct ancestry of Kennewick Man for two members of the Colville tribe who show no evidence of recent European admixture. This test allows us to determine if the patterns of allele frequencies in the Colville and Kennewick Man are compatible with direct ancestry of the Colville from the population to which Kennewick Man belonged, without any additional gene flow. As a comparison we also included analyses of four other Native Americans with high quality genomes: two Northern Athabascan individuals from Canada25 and two Karitiana individuals from Brazil12,13. Although the test rejects the null hypothesis of direct ancestry with no subsequent gene flow in all cases, it only does so very weakly for the Colville tribe members (Table 1 and Supplementary Information 8). These findings can be explained as: (1) the Colville individuals are direct descendants of the population to which Kennewick Man belonged, but subsequently received some relatively minor gene flow from other American populations within the last ∼8,500 years, in agreement with our findings above; (2) the Colville individuals descend from a population that ∼8,500 years was slightly diverged from the population which Kennewick Man belonged or (3) a combination of both.
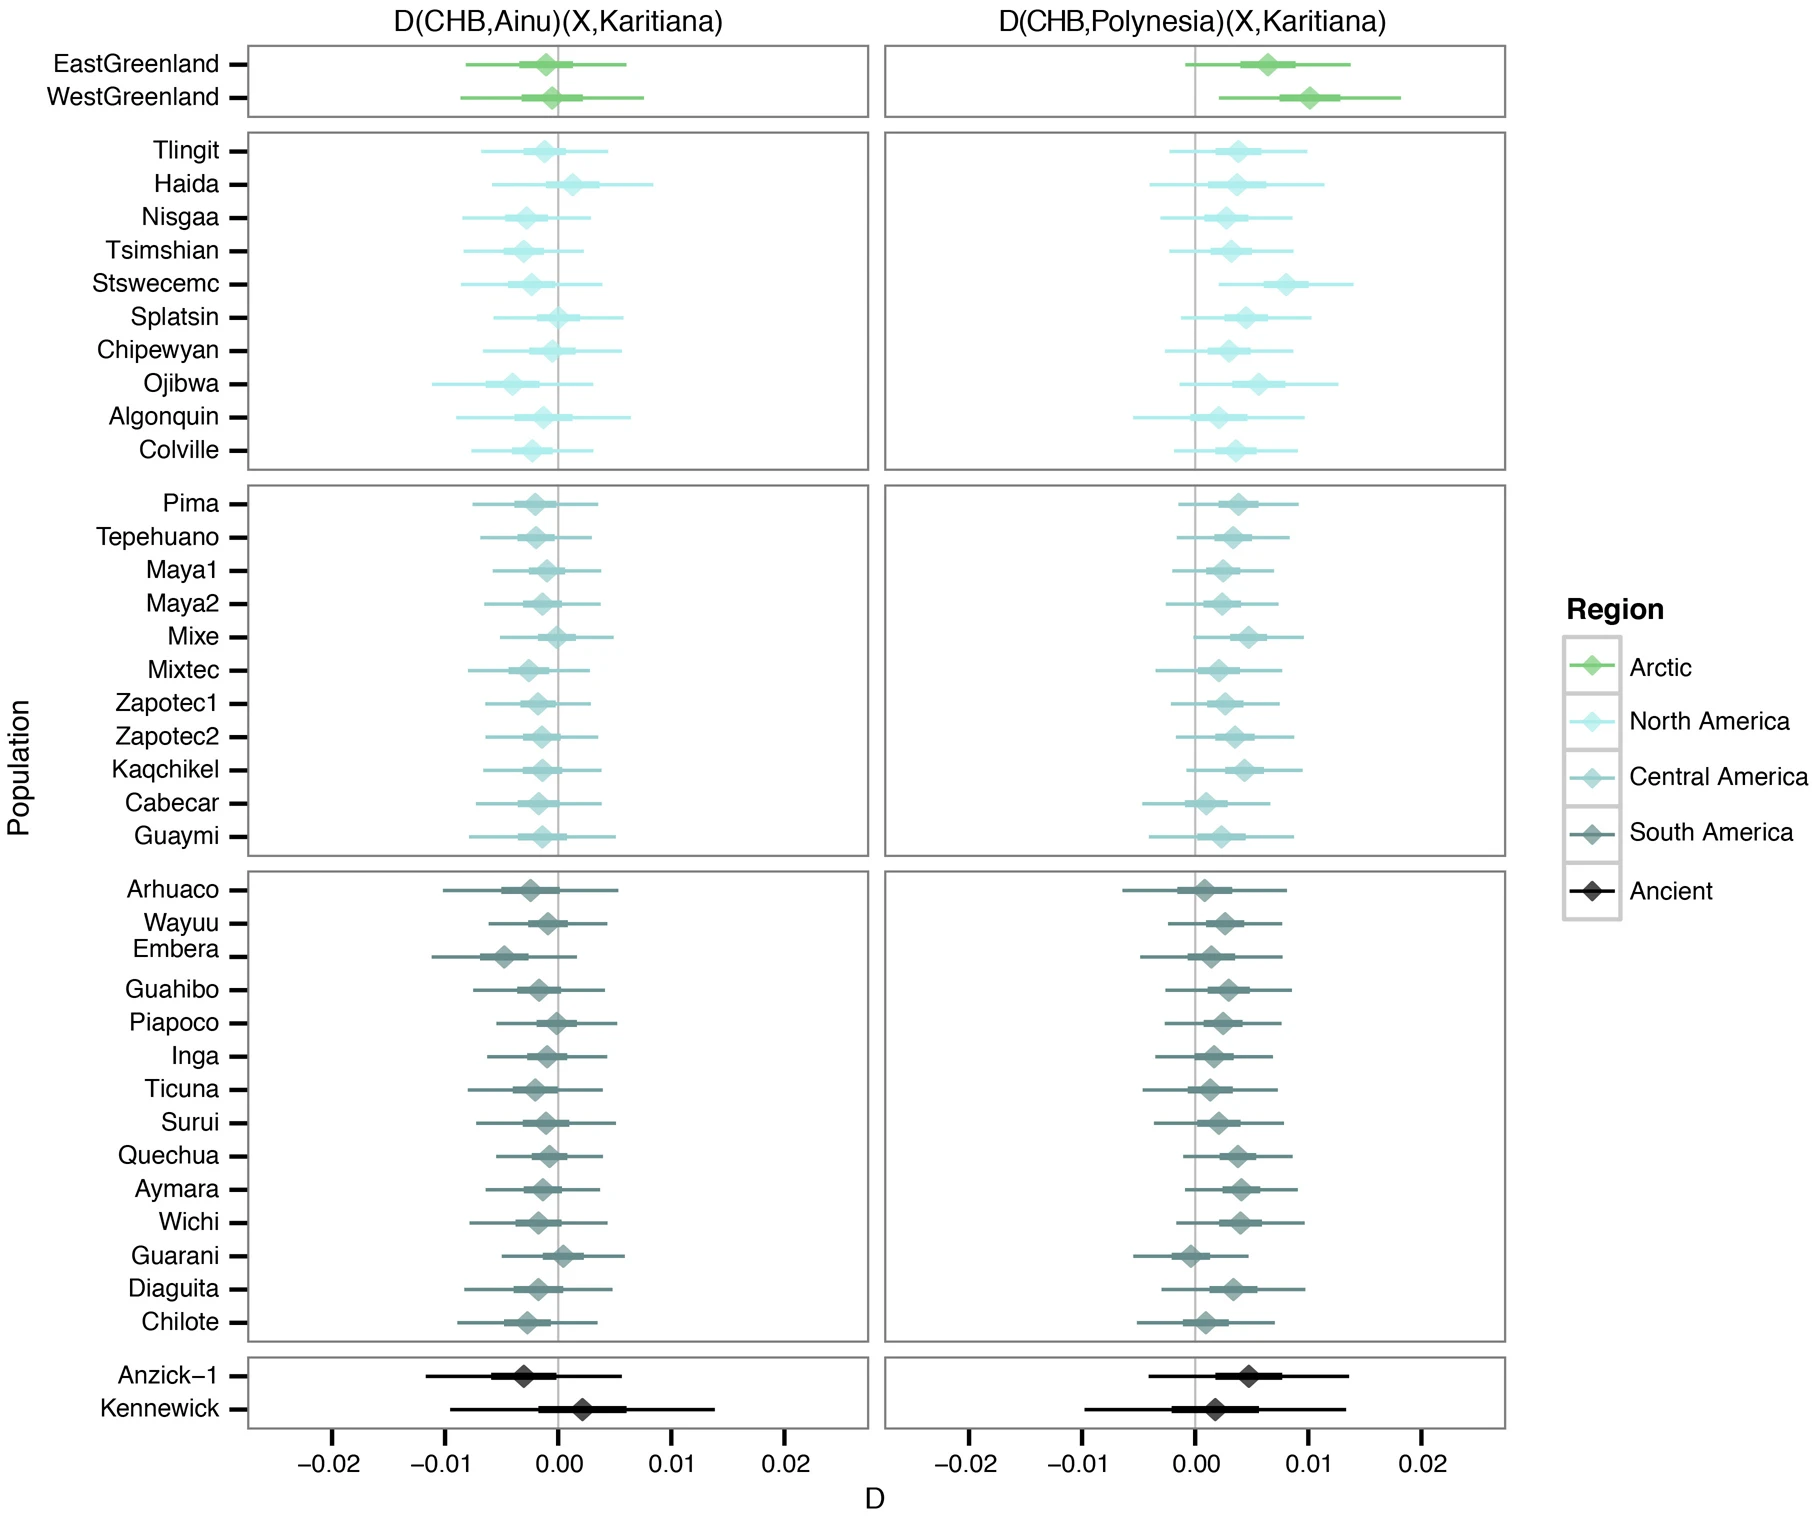
It has been asserted that “…cranial morphology provides as much insight into population structure and affinity as genetic data”2. However, although recent and previous craniometric analyses have consistently concluded that Kennewick Man is unlike modern Native Americans, they disagree regarding his closest population affinities, the cause of the apparent differences between Kennewick Man and modern Native Americans, and whether the differences are historically important (for example, represent an earlier, separate migration to the Americas), or simply represent intra-population variation2,3,7,10,26,27,28. These inconsistencies are probably owing to the difficulties in assigning a single individual when comparing to population-mean data, without explicitly taking into account within-population variation. Reanalysis of W. W. Howells’ worldwide modern human craniometric data set29 (Supplementary Information 9) shows that biological population affinities of individual specimens cannot be resolved with any statistical certainty. Although our individual-based craniometric analyses confirm that Kennewick Man tends to be more similar to Polynesian and Ainu peoples than to Native Americans, Kennewick Man’s pattern of craniometric affinity falls well within the range of affinity patterns evaluated for individual Native Americans (Supplementary Information 9). For example, the Arikara from North Dakota (the Native American tribe representing the geographically closest population in Howells’ data set to Kennewick), exhibit with high frequency closest affinities with Polynesians (Supplementary Information 9). Yet, the Arikara have typical Native-American mitochondrial DNA haplogroups30, as does Kennewick Man. We conclude that the currently available number of independent phenetic markers is too small, and within-population craniometric variation too large, to permit reliable reconstruction of the biological population affinities of Kennewick Man.
In contrast, block bootstrap results from the autosomal DNA data are highly statistically significant (Extended Data Fig. 3), showing stronger association of the Kennewick man with Native Americans than with any other continental group. We also observe that the autosomal DNA, mitochondrial DNA and Y chromosome data all consistently show that Kennewick Man is directly related to contemporary Native Americans, and thus show genetic continuity within the Americas over at least the past 8,000 years. Identifying which modern Native American groups are most closely related to Kennewick Man is not possible at this time as our comparative DNA database of modern peoples is limited, particularly for Native-American groups in the United States. However, among the groups for which we have sufficient genomic data, we find that the Colville, one of the Native American groups claiming Kennewick Man as ancestral, show close affinities to that individual or at least to the population to which he belonged. Additional modern descendants could be identified as more Native American groups are sequenced. Finally, it is clear that Kennewick Man differs significantly from the Anzick-1 child who is more closely related to the modern tribes of Mesoamerica and South America12, possibly suggesting an early population structure within the Americas.

a–d, Heat maps of f3-outgroup statistics testing (YRI; Native Americans, X), where X is Kennewick Man (a), Anzick-1 (b), Colville (c) or Chipewyan (d). Warmer colours indicate higher allele sharing, for list of population labels, see the Methods section.
Our results are in agreement with a basal divergence of Northern and Central/Southern Native American lineages as suggested from the analysis of the Anzick-1 genome12. However, the genetic affinities of Kennewick Man reveal additional complexity in the population history of the Northern lineage. The finding that Kennewick is more closely related to Southern than many Northern Native Americans (Extended Data Fig. 4) suggests the presence of an additional Northern lineage that diverged from the common ancestral population of Anzick-1 and Southern Native Americans (Fig. 3). This branch would include both Colville and other tribes of the Pacific Northwest such as the Stswecem’c, who also appear symmetric to Kennewick with Southern Native Americans (Extended Data Fig. 4). We also find evidence for additional gene flow into the Pacific Northwest related to Asian populations (Extended Data Fig. 5), which is likely to post-date Kennewick Man. We note that this gene flow could originate from within the Americas, for example in association with the migration of paleo-Eskimos or Inuit ancestors within the past 5,000 years25, or the gene flow could be post-colonial19.

Figure 3: Illustration of Native American population history.
Depicted is a population tree consistent with the broad affinities between modern and ancient Native Americans. Kennewick Man and the Anzick-1 child are indicated with blue and green stars respectively. Red dashed arrows indicate gene flow (1) of Asian-related ancestry with tribes of the Pacific Northwest and (2) between Colville and neighbouring tribes.
We used a likelihood ratio test to test for direct ancestry of Kennewick Man for two members of the Colville tribe who show no evidence of recent European admixture. This test allows us to determine if the patterns of allele frequencies in the Colville and Kennewick Man are compatible with direct ancestry of the Colville from the population to which Kennewick Man belonged, without any additional gene flow. As a comparison we also included analyses of four other Native Americans with high quality genomes: two Northern Athabascan individuals from Canada25 and two Karitiana individuals from Brazil12,13. Although the test rejects the null hypothesis of direct ancestry with no subsequent gene flow in all cases, it only does so very weakly for the Colville tribe members (Table 1 and Supplementary Information 8). These findings can be explained as: (1) the Colville individuals are direct descendants of the population to which Kennewick Man belonged, but subsequently received some relatively minor gene flow from other American populations within the last ∼8,500 years, in agreement with our findings above; (2) the Colville individuals descend from a population that ∼8,500 years was slightly diverged from the population which Kennewick Man belonged or (3) a combination of both.
It has been asserted that “…cranial morphology provides as much insight into population structure and affinity as genetic data”2. However, although recent and previous craniometric analyses have consistently concluded that Kennewick Man is unlike modern Native Americans, they disagree regarding his closest population affinities, the cause of the apparent differences between Kennewick Man and modern Native Americans, and whether the differences are historically important (for example, represent an earlier, separate migration to the Americas), or simply represent intra-population variation2,3,7,10,26,27,28. These inconsistencies are probably owing to the difficulties in assigning a single individual when comparing to population-mean data, without explicitly taking into account within-population variation. Reanalysis of W. W. Howells’ worldwide modern human craniometric data set29 (Supplementary Information 9) shows that biological population affinities of individual specimens cannot be resolved with any statistical certainty. Although our individual-based craniometric analyses confirm that Kennewick Man tends to be more similar to Polynesian and Ainu peoples than to Native Americans, Kennewick Man’s pattern of craniometric affinity falls well within the range of affinity patterns evaluated for individual Native Americans (Supplementary Information 9). For example, the Arikara from North Dakota (the Native American tribe representing the geographically closest population in Howells’ data set to Kennewick), exhibit with high frequency closest affinities with Polynesians (Supplementary Information 9). Yet, the Arikara have typical Native-American mitochondrial DNA haplogroups30, as does Kennewick Man. We conclude that the currently available number of independent phenetic markers is too small, and within-population craniometric variation too large, to permit reliable reconstruction of the biological population affinities of Kennewick Man.
Table 1 Direct ancestry test
From: The ancestry and affiliations of Kennewick Man

 	Coalescence probability in Kennewick lineage (c1)	Coalescence probability in reference lineage (c2)	2 × Log likelihood ratio of H0: c1 = 0 vs HA: c1 > 0
Colville 2	0.015	0.072	19.41
Colville 8	0.007	0.097	3.93
Athabascan 1	0.048	0.073	505.52
Athabascan 2	0.056	0.097	807.69
Bl16 (Karitiana)	0.040	0.140	423.87
HGDP00998 (Karitiana)	0.040	0.170	446.30
c1 is the probability of coalescence in the Kennewick lineage and c2 is the probability of coalescence in the reference population lineage. A value of c1 = 0 corresponds to direct Kennewick ancestry of the reference population with no subsequent gene flow. Smaller likelihood ratios indicate less evidence against direct Kennewick ancestry.
In contrast, block bootstrap results from the autosomal DNA data are highly statistically significant (Extended Data Fig. 3), showing stronger association of the Kennewick man with Native Americans than with any other continental group. We also observe that the autosomal DNA, mitochondrial DNA and Y chromosome data all consistently show that Kennewick Man is directly related to contemporary Native Americans, and thus show genetic continuity within the Americas over at least the past 8,000 years. Identifying which modern Native American groups are most closely related to Kennewick Man is not possible at this time as our comparative DNA database of modern peoples is limited, particularly for Native-American groups in the United States. However, among the groups for which we have sufficient genomic data, we find that the Colville, one of the Native American groups claiming Kennewick Man as ancestral, show close affinities to that individual or at least to the population to which he belonged. Additional modern descendants could be identified as more Native American groups are sequenced. Finally, it is clear that Kennewick Man differs significantly from the Anzick-1 child who is more closely related to the modern tribes of Mesoamerica and South America12, possibly suggesting an early population structure within the Americas.

