Post by Admin on May 1, 2022 20:15:41 GMT
Materials and methods
Samples
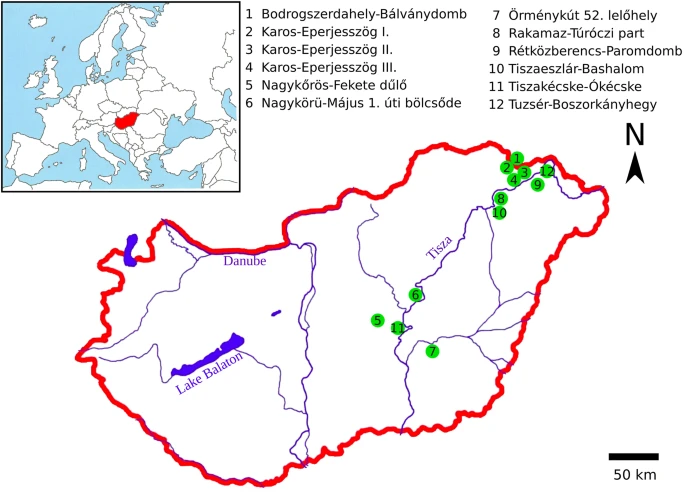
Nomadic peoples traditionally determine tribal descent patrilineally; therefore, we focused on the remains of classical Hungarian Conqueror males. Our aim was to examine the first generation of Hungarian Conquerors and to exclude the integrated local individuals from the test samples. For that reason, we aimed at choosing the graves containing artifacts most characteristic of the Hungarian Conquerors (see Online Resource 2; ESM_2). The majority of the research sample is from the Upper Tisza region (14/19), as this is where the Hungarians founded their first royal seat in the first half of the tenth century CE (Révész 1996). A smaller proportion of samples came from the Central Tisza region (5/19), which was a regional center in the tenth century CE (Madaras 2014) (Fig. 2).
Fig. 2
Sample preparation and DNA extraction
DNA extraction was completed on well-preserved tooth and bone (os petrosum) samples from 24 males archived in the Department of Anthropology at the Hungarian Natural History Museum in Budapest. Sufficient quality and quantity of DNA could be obtained from the samples of 19 ancient individuals to run STR analysis. As such, we were able to determine the haplogroups of 19 samples.
Y-chromosomal STR and SNP analyses were performed in the ancient DNA lab of the Institute of Forensic Medicine, University of Strasbourg. For each individual tested (apart from RP/1 where only petrous bones were available), tooth and petrous bone sample were used for the genetic analyses. To prevent any external contamination, the teeth were first decontaminated with bleach, and then rinsed with ultrapure water, exposed to UV light (254 nm) on each side for 30 min, and powdered in a grinder mill under liquid nitrogen (6870 SamplePrep Freezer Mill®, Fisher Bioblock). The periosteum of the petrous bones was mechanically removed with a sterilized Dremel® under a fume hood, dried, rinsed, and exposed to UV radiation. The dense bone of the otic capsule was collected through low-speed drilling. The fine powder was recovered into a small plastic cup.
Two hundred fifty milligrams of tooth or petrous bone powder was used to extract DNA, as described in Mendisco et al. (2011).
Y-chromosomal analysis
Twenty-seven Y-chromosomal STRs (DYS19, DYS385a/b, DYS387S1a/b, DYS389I, DYS389II, DYS390, DYS391, DYS392, DYS393, DYS437, DYS438, DYS439, DYS448, DYS449, DYS456, DYS458, DYS460, DYS481, DYS518, DYS533, DYS570, DYS576, DYS627, DYS635 (Y GATA C4), and Y GATA H4) were amplified using the Yfiler® Plus PCR Amplification kit (Thermo FisherScientific) from the two types of DNA extract. Experimental conditions followed those recommended by the manufacturer, except that 30 cycles were used instead of 27. Capillary electrophoresis was run on the ABI 3500 Genetic Analyzer (Thermo Fisher Scientific), and data analysis was performed with the GeneMapper™ 4.1 software (Thermo Fisher Scientific).
Seven SNPs (N-L1034, N-VL29, R-Z93, R-M558, J-P58, J-L620 and J-FGC6064) were also genotyped. These SNPs were amplified with the following thermal cycling conditions: a first, denaturation step at 95 °C for 3 min; followed by 38 cycles of denaturation at 95 °C for 45 s; annealing at 55 °C for 60 s; and extension at 72 °C for 60 s, with a final extension step at 72 °C for 10 min. PCR products were sequenced using BigDye Terminator Cycle Sequencing kit, version 1.1 (Thermo Fisher Scientific), according to the manufacturer’s recommendations. Sequencing products were then purified by ethanol precipitation and finally subjected to capillary electrophoresis on ABI 3500 Genetic Analyzer (Thermo Fisher Scientific). The resulting sequences were assembled and edited using the software Sequencher, version 5.1 (Gene Codes). The SNP N-Z1936 was typed by Neparáczki et al. (2019) at the Department of Genetics, University of Szeged.
Multiple independent DNA extractions and PCR amplifications were carried out for each sample. In order to control for possible modern contamination, the DNA extracted from saliva samples of all people handling the material or working in the laboratory was genetically typed and then compared with the profiles or haplotypes of all ancient samples.
Phylogenetic study
Y-haplogroups of the samples were determined from the available STR data with the NEVGEN predictor.Footnote1 In many cases, subgroups further downstream were predicted from median-joining network analysis, where clear STR variance made it possible (see below for specific samples). In the cases where multiple subgroups had very similar STR features, targeted SNP tests were carried out to clarify the classification (e.g., in the case of R1a-Z93 vs. R1a-Z280 and under N3a4-Z1936 for the status of L1034).
To examine the STR variation within the sub-haplogroups, median-joining networks were constructed using the Network 5.0.0.0 program (Bandelt et al. 1999). Repeats of the DYS389I locus were subtracted from the DYS389II locus. To put the results into a more extensive geographical context, we included haplotypes of 17 overlapping loci from other populations (the source of populations is indicated below each network, various populations were included according to their relevance for a given haplogroup). Within the network program, the rho statistic was used to estimate the time to the most recent common ancestor (TMRCA) of haplotypes within the compared haplogroups (Bandelt et al. 1999). We used the pedigree rate 2.5 × 10⁻³, as described by Goedbloed et al. (2009), for 17 loci included in the YFilter kit (Applied Biosystem, Foster City, CA, USA). Due to the expansion of Full Genomic testing, an SNP count-based TMRCA estimation method was also used and proved to be effective on closely related, as well as genetically distant individuals (Hallast et al. 2015; Underhill et al. 2015). In these recent studies, the pedigree rate based on large number STR loci (Goedbloed et al. 2009) tended to be significantly closer to the SNP-based time estimates. SNP-based mutation rates are reported from the YFull database.Footnote2
Genetic distance calculations
FST genetic distances and associated p values were calculated from Y-SNP haplogroup frequencies using Arlequin 3.5 software (Excoffier and Lischer 2010). Based on pairwise distances, Kruskal’s non-metric multidimensional scaling (NMDS) plots were constructed with the isoMDS() function from the R package ‘MASS’ (ver. 7.3–45) (Venables and Ripley 2002). p values were used to distinguish between significant (p < 0.05) and non-significant distances (p > =0.05), as well as to interpret the distance-based NMDS plot. In the case of non-significant distances between two groups, we rejected the null hypothesis that they had statistically different Y-SNP haplogroup frequencies. We interpreted them as statistically non-separable groups.
Samples
Nomadic peoples traditionally determine tribal descent patrilineally; therefore, we focused on the remains of classical Hungarian Conqueror males. Our aim was to examine the first generation of Hungarian Conquerors and to exclude the integrated local individuals from the test samples. For that reason, we aimed at choosing the graves containing artifacts most characteristic of the Hungarian Conquerors (see Online Resource 2; ESM_2). The majority of the research sample is from the Upper Tisza region (14/19), as this is where the Hungarians founded their first royal seat in the first half of the tenth century CE (Révész 1996). A smaller proportion of samples came from the Central Tisza region (5/19), which was a regional center in the tenth century CE (Madaras 2014) (Fig. 2).
Fig. 2
Sample preparation and DNA extraction
DNA extraction was completed on well-preserved tooth and bone (os petrosum) samples from 24 males archived in the Department of Anthropology at the Hungarian Natural History Museum in Budapest. Sufficient quality and quantity of DNA could be obtained from the samples of 19 ancient individuals to run STR analysis. As such, we were able to determine the haplogroups of 19 samples.
Y-chromosomal STR and SNP analyses were performed in the ancient DNA lab of the Institute of Forensic Medicine, University of Strasbourg. For each individual tested (apart from RP/1 where only petrous bones were available), tooth and petrous bone sample were used for the genetic analyses. To prevent any external contamination, the teeth were first decontaminated with bleach, and then rinsed with ultrapure water, exposed to UV light (254 nm) on each side for 30 min, and powdered in a grinder mill under liquid nitrogen (6870 SamplePrep Freezer Mill®, Fisher Bioblock). The periosteum of the petrous bones was mechanically removed with a sterilized Dremel® under a fume hood, dried, rinsed, and exposed to UV radiation. The dense bone of the otic capsule was collected through low-speed drilling. The fine powder was recovered into a small plastic cup.
Two hundred fifty milligrams of tooth or petrous bone powder was used to extract DNA, as described in Mendisco et al. (2011).
Y-chromosomal analysis
Twenty-seven Y-chromosomal STRs (DYS19, DYS385a/b, DYS387S1a/b, DYS389I, DYS389II, DYS390, DYS391, DYS392, DYS393, DYS437, DYS438, DYS439, DYS448, DYS449, DYS456, DYS458, DYS460, DYS481, DYS518, DYS533, DYS570, DYS576, DYS627, DYS635 (Y GATA C4), and Y GATA H4) were amplified using the Yfiler® Plus PCR Amplification kit (Thermo FisherScientific) from the two types of DNA extract. Experimental conditions followed those recommended by the manufacturer, except that 30 cycles were used instead of 27. Capillary electrophoresis was run on the ABI 3500 Genetic Analyzer (Thermo Fisher Scientific), and data analysis was performed with the GeneMapper™ 4.1 software (Thermo Fisher Scientific).
Seven SNPs (N-L1034, N-VL29, R-Z93, R-M558, J-P58, J-L620 and J-FGC6064) were also genotyped. These SNPs were amplified with the following thermal cycling conditions: a first, denaturation step at 95 °C for 3 min; followed by 38 cycles of denaturation at 95 °C for 45 s; annealing at 55 °C for 60 s; and extension at 72 °C for 60 s, with a final extension step at 72 °C for 10 min. PCR products were sequenced using BigDye Terminator Cycle Sequencing kit, version 1.1 (Thermo Fisher Scientific), according to the manufacturer’s recommendations. Sequencing products were then purified by ethanol precipitation and finally subjected to capillary electrophoresis on ABI 3500 Genetic Analyzer (Thermo Fisher Scientific). The resulting sequences were assembled and edited using the software Sequencher, version 5.1 (Gene Codes). The SNP N-Z1936 was typed by Neparáczki et al. (2019) at the Department of Genetics, University of Szeged.
Multiple independent DNA extractions and PCR amplifications were carried out for each sample. In order to control for possible modern contamination, the DNA extracted from saliva samples of all people handling the material or working in the laboratory was genetically typed and then compared with the profiles or haplotypes of all ancient samples.
Phylogenetic study
Y-haplogroups of the samples were determined from the available STR data with the NEVGEN predictor.Footnote1 In many cases, subgroups further downstream were predicted from median-joining network analysis, where clear STR variance made it possible (see below for specific samples). In the cases where multiple subgroups had very similar STR features, targeted SNP tests were carried out to clarify the classification (e.g., in the case of R1a-Z93 vs. R1a-Z280 and under N3a4-Z1936 for the status of L1034).
To examine the STR variation within the sub-haplogroups, median-joining networks were constructed using the Network 5.0.0.0 program (Bandelt et al. 1999). Repeats of the DYS389I locus were subtracted from the DYS389II locus. To put the results into a more extensive geographical context, we included haplotypes of 17 overlapping loci from other populations (the source of populations is indicated below each network, various populations were included according to their relevance for a given haplogroup). Within the network program, the rho statistic was used to estimate the time to the most recent common ancestor (TMRCA) of haplotypes within the compared haplogroups (Bandelt et al. 1999). We used the pedigree rate 2.5 × 10⁻³, as described by Goedbloed et al. (2009), for 17 loci included in the YFilter kit (Applied Biosystem, Foster City, CA, USA). Due to the expansion of Full Genomic testing, an SNP count-based TMRCA estimation method was also used and proved to be effective on closely related, as well as genetically distant individuals (Hallast et al. 2015; Underhill et al. 2015). In these recent studies, the pedigree rate based on large number STR loci (Goedbloed et al. 2009) tended to be significantly closer to the SNP-based time estimates. SNP-based mutation rates are reported from the YFull database.Footnote2
Genetic distance calculations
FST genetic distances and associated p values were calculated from Y-SNP haplogroup frequencies using Arlequin 3.5 software (Excoffier and Lischer 2010). Based on pairwise distances, Kruskal’s non-metric multidimensional scaling (NMDS) plots were constructed with the isoMDS() function from the R package ‘MASS’ (ver. 7.3–45) (Venables and Ripley 2002). p values were used to distinguish between significant (p < 0.05) and non-significant distances (p > =0.05), as well as to interpret the distance-based NMDS plot. In the case of non-significant distances between two groups, we rejected the null hypothesis that they had statistically different Y-SNP haplogroup frequencies. We interpreted them as statistically non-separable groups.