|
|
Post by Admin on Mar 21, 2022 20:22:09 GMT
Supporting Information (SI) Appendix
Table S1 Genome-wide mean FST values between Tibetans and other ethnic groups in China.
Population Sample size FST
Yi 10 0.0042
Tu 10 0.0055
Naxi 9 0.0084
Xibo 9 0.0099
Mongola 10 0.0103
Tujia 10 0.0111
Daur 9 0.0129
Han 34 0.0130
Hezhe 9 0.0135
Miao 10 0.0148
Oroqen 10 0.0182
She 10 0.0190
Dai 10 0.0230
Lahu 10 0.0288
Uygur 10 0.0353

The FST value between the Tibetan population (n = 3,008) and each of the ethnic populations in HGDP was
estimated using all genome-wide SNP data. The FST value presented in the table is an average across all
SNPs. These results are consistent with that demonstrated in Figure 1a, i.e. Tibetans show the nearest
genetic relatedness to the Yi, Tu and Naxi populations.

Table S2 Simulations to investigate the statistical properties of methods for detecting signals of
natural selection.

SNP set Method Replicate 1 Replicate 2 Replicate 3
Mean SE Mean SE Mean SE
SNPs under a drift model
LR-GC 0.800 0.006 0.810 0.006 0.807 0.006
MLMA-LOCO in BOLT-LMM 1.000 0.007 1.007 0.007 1.014 0.007
SNPs under selection
LR-GC 2.796 0.053 2.708 0.049 2.732 0.049
MLMA-LOCO in BOLT-LMM 2.885 0.052 2.802 0.048 2.884 0.049

Note: SE represents standard error of the mean estimate. We performed a simulation to investigate the
statistical properties of the MLMA-LOCO method implemented in BOLT-LMM. We simulated 60,000
unlinked SNPs with their ancestral allele frequencies (p0) sampled from a uniform distribution, i.e. U(0.01,
0.99). Note that we chose 60,000 because the estimated effective number of independent markers for
common SNPs is about 60,000 (1). For the ease of BOLT-LMM analysis, the SNPs were randomly assigned
to 22 chromosomes. The allele frequencies of SNPs in derived populations were simulated from a normal
distribution, i.e. p ~ N[p0, p0(1 – p0)FST]. We generated from this distribution the allele frequencies of two
derived populations (pop1 and pop2) with FST = 0.01. We randomly sampled 10% of the SNPs as the loci
under selection. For each of SNPs under selection, we simulated selection signal by increasing the allele
frequency difference between pop1 and pop2 by 2-fold, i.e. p1(new) = p1 + (p1 – p2) where p1 and p2 represent
the allele frequencies in pop1 and pop2 respectively. We generated genotypes of each SNP in pop1 (n =
3000) and pop2 (n = 7000) from a binomial distribution, i.e. x ~ B(2, p). We analysed the simulated data
using linear regression followed by GC correction (LR-GC) and MLMA-LOCO respectively. In LR-GC, χ
2test-statistics were divided by the mean χ2 value of all SNPs. We repeated the simulation three times. We
show in the table below that for SNPs under a drift model the mean χ2 test-statistic from MLMA-LOCO is
close to 1 whereas the test-statistics from LR-GC are deflated consistent with the observation in a previous
GWAS study (1). For SNPs under selection, the mean test-statistic from MLMA-LOCO is consistently
higher than that from LR-GC across three replicates.
|
|
|
|
Post by Admin on Mar 21, 2022 21:13:06 GMT
Table S3 P-values of the 9 genome-wide significant loci in the MLMA-LOCO analyses of the two
subsets of data. Four of the loci are genome-wide significant in the analysis of subset 1.
Chr SNP bp Nearest gene Subset 1 Subset 2 Combined
1 rs1801133 11,856,378 MTHFR 1.4E-05 2.0E-07 6.3E-09
1 rs71673426 112,159,304 RAP1A 8.6E-07 8.8E-05 1.5E-08
1 rs78720557 198,096,548 NEK7 8.5E-07 6.6E-06 4.7E-08
1 rs78561501 231,448,497 EGLN1 1.8E-13 3.7E-11 6.1E-15
2 rs116611511 46,600,030 EPAS1 1.8E-17 4.0E-17 3.6E-19
4 rs2584462 100,324,464 ADH7 1.9E-09 3.5E-06 3.9E-09
5 rs4498258 44,325,322 FGF10 6.5E-07 3.8E-07 1.7E-08
6 rs9275281 32,662,920 HLA-DQB1 3.3E-09 5.8E-07 1.1E-10
12 rs139129572 123,178,478 HCAR2 2.2E-06 8.9E-06 5.8E-09
Subset 1: Seda-Tibetan (n = 2,427) vs. Seda-Han + GERA-EAS (n = 5,548);
Subset 2: Litang-Tibetan (n = 581) vs. Litang-Han + WZ-Han (n = 1,736);
Combined: Tibetans (n = 3008) and TP-Han + WZ-Han + GERA-EAS (n = 7,284).

Table S4 Replication of candidate genes from previous studies
Study Chr Candidate Gene Top SNP in the gene region# MLMA-LOCO P-value
Yi et al. 2010 Science 2 EPAS1 rs116611511 3.60E-19
Yi et al. 2010 Science 11 HBB/HBG2 rs10768774 0.0076
Yi et al. 2010 Science 1 DISC1 rs77401030 2.00E-10
Yi et al. 2010 Science 16 FANCA rs142556882 0.00012
Yi et al. 2010 Science 1 PKLR rs117968195 0.029
Simonson et al. 2010 Science 10 CYP2E1 rs4542321 0.0054
Simonson et al. 2010 Science 4 EDNRA rs75056029 0.018
Simonson et al. 2010 Science 19 ANGPTL4 rs12978137 0.0086
Simonson et al. 2010 Science 4 CAMK2D rs12512765 0.00021
Simonson et al. 2010 Science 1 EGLN1 rs116912442 3.20E-13
Simonson et al. 2010 Science 16 HMOX2 chr16:4478105:D 0.00075
Simonson et al. 2010 Science 10 CYP17A1 rs141675337 0.0052
Simonson et al. 2010 Science 22 PPARA rs149670586 9.10E-05
Simonson et al. 2010 Science 10 PTEN rs11202571 0.0051
#
A gene region is defined as ±50Kb of the UTRs.
The total number of SNPs tested in these gene regions is 2,426. The adjusted p-value threshold is 1.5e-4 =
5e-8 * m / 2426 where m (m = 7,276,846) is the total number of SNPs included in the MLMA-LOCO
analysis.
|
|
|
|
Post by Admin on Mar 21, 2022 21:59:06 GMT
Table S5 Descriptive summary of the 91 quantitative traits in Tibetans.
Trait Name Description Men (n = 1,064) Women (n = 1,785)
mean SD mean SD
AVSLPTIM Average sleep time per day 7.67 1.87 7.54 1.67
HEIGHT Height 166.68 7.44 155.76 6.86
WEIGHT Weight 69.38 12.12 60.08 10.42
BMI Body mass index 24.62 4.17 24.42 3.97
SEOD Spherical equivalent of the right eye -0.49 2.45 -0.39 2.35
SEOS Spherical equivalent of the left eye -0.45 2.41 -0.37 2.24
LOGMAROD Uncorrected visual acuity of the right eye 0.30 1.33 0.37 1.22
LOGMAROS Uncorrected visual acuity of the left eye 0.35 1.36 0.36 1.20
LOGMARODCC Corrected visual acuity of the right eye 0.15 1.48 0.29 1.45
LOGMAROSCC Corrected visual acuity of the left eye 0.02 1.71 0.08 1.52
SBP Systolic blood pressure 126.91 21.30 118.48 22.75
DBP Diastolic blood pressure 76.10 13.94 73.31 13.17
XL Heart rate 81.95 14.15 81.72 12.50
CCTOD Central cornea thickness of the right eye 511.35 34.52 510.05 38.32
ADOD Anterior chamber depth of the right eye 2.93 0.46 2.89 0.42
LTOD Lens thickness of the right eye 3.75 0.39 3.69 0.34
ALOD Axial length of the right eye 23.40 0.91 23.08 0.91
R1OD Cornea curvature1 of the right eye 7.85 0.26 7.78 0.28
R2OD Cornea curvature2 of the right eye 7.67 0.26 7.60 0.27
AXISR1OD The axis of curvature1 of the right eye 97.85 67.51 104.96 67.27
AXISR2OD The axis of curvature2 of the right eye 81.99 37.41 80.96 34.04
WTWOD The width of cornea of the right eye 11.71 0.60 11.60 0.65
PUPILLOD Pupil diameter of the right eye 6.68 1.67 6.70 1.61
CCTOS Central cornea thickness of the left eye 511.42 38.11 508.23 35.40
ADOS Anterior chamber depth of left eye 2.95 0.48 2.92 0.45
LTOS Lens thickness of the left eye 3.73 0.37 3.67 0.34
ALOS Axial length of the left eye 23.38 0.95 23.04 0.83
R1OS Cornea curvature1 of the left eye 7.86 0.30 7.78 0.27
R2OS Cornea curvature2 of the left eye 7.67 0.29 7.59 0.28
AXISR1OS The axis of curvature1 of the left eye 80.08 66.79 73.78 68.44
AXISR2OS The axis of curvature2 of the left eye 94.05 37.78 94.63 32.68
WTWOS The width of cornea of the left eye 11.73 0.67 11.62 0.63
PUPILLOS Pupil diameter of the left eye 6.65 1.62 6.65 1.58
FT3 Free triiodothyronine 5.67 1.18 5.38 1.94
FT4 Free thyroxine 18.47 3.57 18.90 8.01
TSH Thyroid Stimulating Hormone 3.47 3.98 3.71 5.17
PTH Parathyroid Hormone 28.57 19.53 33.44 21.81
B12 Vitamin B12 473.30 261.62 515.00 284.99
FOLATE Folate 6.29 2.41 7.36 2.71
ALT Glutamate pyruvate transaminase 27.45 28.11 18.41 17.38
AST Glutamic oxalacetic transaminase 25.78 12.92 22.65 12.95
AST2ALT AST/ALT ratio 1.20 0.65 1.48 0.88
TP Total protein 77.20 5.08 77.35 5.36
ALB Albumin 47.62 3.35 46.85 2.85
GLB Globulin 29.55 4.17 30.45 4.69
A2G ALB/GLB ratio 1.72 1.57 1.64 1.38
TBIL Total bilirubin 13.33 7.48 10.38 6.96
DBIL Direct bilirubin 5.73 2.65 4.54 3.11
IBIL Indirect bilirubin 7.63 5.16 5.89 4.84
ALP Alkaline phosphatase 94.70 35.22 85.05 30.95
GGT Gamma-glutamyl transpeptidase 49.25 50.19 29.98 32.67
GLU Glucose 5.43 1.79 5.04 1.03
UREA Urea nitrogen 4.83 1.79 4.56 1.70
CRE Creatinine 76.68 14.81 59.44 10.86
UA Uric acid 394.93 82.99 298.10 73.26
TG Triglyceride 1.18 0.66 1.03 0.47
TCH Total cholesterol 4.60 1.08 4.51 1.02
HDL High density lipoprotein 1.20 0.23 1.35 0.28
LDL Low density lipoprotein 2.89 0.86 2.61 0.76
K Potassium 4.30 0.47 4.35 0.45

NA Sodium 140.93 3.90 140.39 3.32
CL Aluminium 106.85 3.34 107.16 2.83
CA Calcium 2.39 0.13 2.34 0.12
PHOS Phosphorus 1.14 0.19 1.22 0.16
FE Ferrum 18.89 8.94 14.98 8.55
FER Ferritin 207.85 185.30 83.36 117.91
HCY Homocysteine 27.17 24.15 18.64 7.86
HBA1C Glycosylated hemoglobin 5.46 0.83 4.92 0.68
WBC White blood cell count 6.18 1.89 6.19 1.87
LYMPH Lymphocyte count 1.87 0.62 1.92 0.67
MID1 Intermediate cell count 0.35 0.15 0.33 0.19
GRAN1 Neutrophile granulocyte 3.96 1.63 3.94 1.60
LYMPH1 Lymphocyte percentage 31.40 8.84 32.13 9.54
MID2 Intermediate cell percentage 5.94 2.11 5.67 2.93
GRAN2 Neutrophile granulocyte percentage 62.66 9.07 62.20 10.25
RBC Red blood cell count 5.19 0.73 4.75 0.64
HGB Hemoglobin 171.09 25.87 149.92 26.01
MCHC Mean Corpuscular Hemoglobin Concentration 349.23 18.05 343.59 13.19
MCV Mean Corpuscular Volume 94.63 5.94 91.77 8.21
MCH Mean Corpuscular Hemoglobin 33.04 2.98 31.55 3.55
RDW_CV Coefficient Of Variation of Red blood Cell
Distribution Width
14.64 1.26 14.78 1.67
HCT Hematocrit 49.04 7.41 43.48 6.85
PLT Platelets 213.05 57.49 252.74 75.11
MPV Mean Platelet Volume 8.33 0.87 8.51 0.91
PDW Platelet Distribution Width 15.97 0.30 15.90 0.31
PCT Thrombocytocrit 0.18 0.04 0.21 0.05
RDW_SD Standard deviation of red blood cell distribution
width
49.91 4.28 48.66 4.48
VITD Vitamin D 19.75 7.58 17.05 5.99
CDOD Cup/disc ratio of the right eye 0.43 0.16 0.37 0.15
IOPOD Intraocular pressure of the right eye 15.23 3.71 15.56 3.66
IOPOS Intraocular pressure of the left eye 15.36 3.53 15.67 3.68

Table S6 Estimates of heritability for 91 quantitative traits in Tibetans. The estimates are from
GCTA-GREML analyses (2, 3) in 3,008 Tibetan subjects. For GWAS data with related individuals,
we used the strategy described in Zaitlen et al. (4) to estimate pedigree-based heritability (h2
) and SNP-based heritability (h2 SNP) (i.e. variance explained by all SNPs in unrelated individuals)
simultaneously in a model (see http://gcta.freeforums.net/thread/241/gcta-greml-analysis-familydata for details about the GCTA commands used). SE: standard error.
Trait h2 SE h2
SNP SE
AVSLPTIM 0.119 0.107 0.011 0.147
HEIGHT 0.653 0.076 0.459 0.104
WEIGHT 0.444 0.079 0.296 0.103
BMI 0.331 0.080 0.254 0.107
SEOD 0.044 0.085 0.008 0.109
SEOS 0.211 0.087 0.178 0.115
LOGMAROD 0.155 0.087 0.151 0.116
LOGMAROS 0.128 0.086 0.120 0.116
LOGMARODCC 0.190 0.199 0.007 0.286
LOGMAROSCC 0.414 0.178 0.390 0.265
SBP 0.380 0.075 0.371 0.102
DBP 0.362 0.075 0.338 0.099
XL 0.346 0.084 0.343 0.110
CCTOD 0.317 0.165 0.302 0.222
ADOD 0.024 0.167 0.000 0.222
LTOD 0.469 0.176 0.492 0.262
ALOD 0.366 0.183 0.248 0.239
R1OD 0.394 0.175 0.168 0.243
R2OD 0.489 0.166 0.376 0.237
AXISR1OD 0.410 0.184 0.446 0.262
AXISR2OD 0.385 0.176 0.393 0.257
WTWOD 0.165 0.168 0.000 0.244
PUPILLOD 0.522 0.159 0.273 0.232
CCTOS 0.491 0.166 0.227 0.229
ADOS 0.354 0.163 0.099 0.224
LTOS 0.379 0.194 0.173 0.270
ALOS 0.232 0.174 0.213 0.242
R1OS 0.221 0.177 0.012 0.238
R2OS 0.257 0.169 0.083 0.229
AXISR1OS 0.239 0.180 0.230 0.249
AXISR2OS 0.213 0.175 0.131 0.253
WTWOS 0.000 0.159 0.000 0.247
PUPILLOS 0.520 0.165 0.012 0.225
FT3 0.054 0.084 0.000 0.111
FT4 0.182 0.086 0.074 0.108
TSH 0.291 0.090 0.069 0.112
PTH 0.336 0.082 0.313 0.108
B12 0.544 0.074 0.540 0.104
FOLATE 0.416 0.082 0.408 0.110
ALT 0.112 0.075 0.053 0.102
AST 0.130 0.078 0.129 0.102
AST2ALT 0.211 0.083 0.000 0.110
TP 0.135 0.076 0.067 0.102
ALB 0.185 0.080 0.081 0.103
GLB 0.229 0.079 0.105 0.107
A2G 0.224 0.078 0.122 0.107
TBIL 0.321 0.080 0.270 0.103
DBIL 0.442 0.080 0.315 0.105
IBIL 0.243 0.081 0.195 0.105
ALP 0.120 0.081 0.000 0.106
GGT 0.205 0.076 0.079 0.103
8
GLU 0.171 0.080 0.141 0.107
UREA 0.248 0.078 0.127 0.102
CRE 0.352 0.080 0.243 0.107
UA 0.267 0.077 0.116 0.101
TG 0.279 0.074 0.258 0.100
TCH 0.383 0.077 0.268 0.106
HDL 0.141 0.077 0.051 0.102
LDL 0.345 0.078 0.237 0.104 K 0.000 0.076 0.000 0.099
NA. 0.350 0.076 0.259 0.106
CL 0.286 0.075 0.159 0.101
CA 0.309 0.080 0.150 0.107
PHOS 0.286 0.079 0.137 0.103
FE 0.203 0.081 0.193 0.104
FER 0.313 0.069 0.305 0.094
HCY 0.219 0.077 0.162 0.103
HBA1C 0.407 0.073 0.109 0.101
WBC 0.321 0.080 0.316 0.113
LYMPH 0.367 0.081 0.206 0.110
MID1 0.431 0.082 0.289 0.111
GRAN1 0.292 0.081 0.240 0.113
LYMPH1 0.304 0.084 0.212 0.111
MID2 0.260 0.086 0.081 0.109
GRAN2 0.389 0.084 0.260 0.112
RBC 0.340 0.082 0.239 0.110
HGB 0.206 0.083 0.150 0.109
MCHC 0.337 0.082 0.218 0.108
MCV 0.184 0.080 0.000 0.107
MCH 0.167 0.081 0.000 0.109
RDW_CV 0.125 0.081 0.052 0.104
HCT 0.234 0.082 0.166 0.108
PLT 0.271 0.082 0.173 0.109
MPV 0.462 0.082 0.332 0.105
PDW 0.252 0.081 0.167 0.111
PCT 0.294 0.079 0.253 0.110
RDW_SD 0.367 0.081 0.255 0.107
VITD 0.446 0.079 0.352 0.112
CDOD 0.345 0.193 0.042 0.262
IOPOD 0.202 0.085 0.180 0.116
IOPOS 0.244 0.087 0.139 0.116

Table S7 Associations of the MTHFR and EPAS1 loci with 5 quantitative traits in Tibetans. A1: the
effect allele. A2: the other allele. b: effect size of the SNP on trait in standard deviation units.
Trait Chr SNP Nearest gene bp A1 A2 b SE P-value
FOLATE 1 rs1801133 MTHFR 11856378 A G -0.34 0.032 6.5E-27
HCY 1 rs1801133 MTHFR 11856378 A G 0.54 0.031 1.1E-69
RBC 2 rs116611511 EPAS1 46600030 G A -0.15 0.027 2.4E-08
HGB 2 rs116611511 EPAS1 46600030 G A -0.11 0.027 7.7E-05
HCT 2 rs116611511 EPAS1 46600030 G A -0.12 0.027 5.6E-06
|
|
|
|
Post by Admin on Mar 22, 2022 20:25:36 GMT
Peopling History of the Tibetan Plateau and Multiple Waves of Admixture of Tibetans Inferred From Both Ancient and Modern Genome-Wide Data
Archeologically attested human occupation on the Tibetan Plateau (TP) can be traced back to 160 thousand years ago (kya) via the archaic Xiahe people and 30∼40 kya via the Nwya Devu anatomically modern human. However, the history of the Tibetan populations and their migration inferred from the ancient and modern DNA remains unclear. Here, we performed the first ancient and modern genomic meta-analysis among 3,017 Paleolithic to present-day Eastern Eurasian genomes (2,444 modern individuals from 183 populations and 573 ancient individuals). We identified a close genetic connection between the ancient-modern highland Tibetans and lowland island/coastal Neolithic Northern East Asians (NEA). This observed genetic affinity reflected the primary ancestry of high-altitude Tibeto-Burman speakers originated from the Neolithic farming populations in the Yellow River Basin. The identified pattern was consistent with the proposed common north-China origin hypothesis of the Sino-Tibetan languages and dispersal patterns of the northern millet farmers. We also observed the genetic differentiation between the highlanders and lowland NEAs. The former harbored more deeply diverged Hoabinhian/Onge-related ancestry and the latter possessed more Neolithic southern East Asian (SEA) or Siberian-related ancestry. Our reconstructed qpAdm and qpGraph models suggested the co-existence of Paleolithic and Neolithic ancestries in the Neolithic to modern East Asian highlanders. Additionally, we found that Tibetans from Ü-Tsang/Ando/Kham regions showed a strong population stratification consistent with their cultural background and geographic terrain. Ü-Tsang Tibetans possessed a stronger Chokhopani-affinity, Ando Tibetans had more Western Eurasian related ancestry and Kham Tibetans harbored greater Neolithic southern EA ancestry. Generally, ancient and modern genomes documented multiple waves of human migrations in the TP’s past. The first layer of local hunter-gatherers mixed with incoming millet farmers and arose the Chokhopani-associated Proto-Tibetan-Burman highlanders, which further respectively mixed with additional genetic contributors from the western Eurasian Steppe, Yellow River and Yangtze River and finally gave rise to the modern Ando, Ü-Tsang and Kham Tibetans.
Introduction
The Tibetan Plateau (TP), widely known as the third pole of the world, forms the high-altitude core region of Asia with an average elevation more than 4,000 meters above sea level (masl). The TP represents one of the most challenging environments for human settlements due to the perennial low temperature, extreme aridity, and severe hypoxia. However, archeological and genetic studies have demonstrated that archaic hominins who occupied the TP had well adapted to the high-altitude hypoxic environment long before the arrival of modern Homo sapiens. The present-day Tibetans are suggested to have uniquely adapted to the extreme high-altitude conditions since the initial colonization of the TP (Qi et al., 2013; Jeong et al., 2016; Gnecchi-Ruscone et al., 2018; Chen F. et al., 2019). However, recent linguistic evidence suggested that Tibeto-Burman populations diverged from Han Chinese approximately 5.9 thousand years ago (kya) (Zhang et al., 2019). At present, over seven million indigenous Tibetans (2016 census) are living in the TP and have successfully adapted to the high-altitude hypoxic environment. Genomic analysis found multiple variants that may jointly deliver the high-altitude fitness of the modern Tibetans which is missing in the Hans (Yi et al., 2010). For example, the positively selected haplotypes of HIF-1α prolyl hydroxylase1 (EGLN1) and Endothelial PAS domain protein 1 (EPAS1) were introduced into modern Tibetans and surrounding highlanders via the Denisovan introgression, which further promoted Tibetan’s high-altitude hypoxia adaptation (Huerta-Sánchez et al., 2014). Compared to the well-established population prehistory in other parts of East Asia (He et al., 2020; Ning et al., 2020; Yang et al., 2020; Wang C. C. et al., 2021), the population history of the TP’s was far from clear due to the lack of excavated archeological sites and human remains. For example, there are a limited amount of zooarchaeological and archaeobotanical data for reconstructing the subsistence strategy and ancient DNA (aDNA) data for dissecting the genomic correlation between ancient individuals and modern Tibetan-like highlanders.
To date, when, where, and how the early human colonizers conquered the TP, and who were the ancestors of the modern Tibetans remain unanswered. Archeological, paleo-anthropological, and genetic studies focusing on the peopling processes of the TP and demographic history of Tibetan Highlanders are still in developmental stages (Aldenderfer, 2011). As revealed by the archeological evidence, handprints and footprints of Homo sapiens found at the Quesang site in southern TP (4,200 masl) suggested that the intermittent human presence on the TP could trace back to at least 20 kya (Zhang and Li, 2002), and the permanent human occupation was dated to the early Holocene (Meyer et al., 2017). The Nwya Devu site, located nearly 4,600 masl in Central Tibet, could be dated to at least 30 kya, which deepened considerably the history of the peopling of the TP and the antiquity of human high-altitude adaptations (Zhang et al., 2018). The palaeo-proteomic analysis of a Xiahe Denisovan mandible indicated that the prehistoric colonization of archaic hominins on the TP could be traced back to the Middle Pleistocene epoch (around 160 kya) (Chen F. et al., 2019). This Pleistocene colonization of archaic humans was recently evidenced via the Denisovan type of mtDNA found in Xiahe site (Zhang et al., 2020). Additionally, modern human genomic data also provided supporting evidence that humans did exist on the TP before the Last Glacial Maximum (LGM), and the genetic relics of the Upper Paleolithic inhabitants in modern Tibetans indicated some extent of genetic continuity between the initial Paleolithic settlers and modern Tibetan highlanders (Zhao et al., 2009; Qin et al., 2010; Qi et al., 2013; Li et al., 2015; Lu et al., 2016). The archaeogenetic investigation of prehistoric Himalayan populations provided supporting evidence for the high-elevation East Asian origin of the first inhabitants of the Himalayas, indirectly indicating the pre-Neolithic human activities on the TP (Jeong et al., 2016).
In contrast to the Late Pleistocene Hunter-Gatherer colonization, the timing and dynamics of the Holocene permanent human occupation of the TP have also provoked many debates (Ding et al., 2020; Liu W. et al., 2020). Recent archeological and genomic findings suggested that the permanent settlement on the TP was a relatively recent occurrence along with the establishment of farming and pastoralism on the Plateau (Chen et al., 2015; Li et al., 2019). Chen et al. reported archaeobotanical and zooarchaeological data from 53 archeological sites in the northeastern TP (NETP) and illustrated that the novel agropastoral subsistence strategy facilitated year-round living on the TP after 3.6 kya (Chen et al., 2015). The first comprehensive and in-depth genomic investigation of the Tibet sheep also revealed a stepwise pattern of recent permanent human occupation on the TP through the Tang-Bo Ancient Road (from northern China to the NETP ∼3,100 years ago and from the NETP to southwestern areas of the TP ∼1,300 years ago) (Hu et al., 2019). However, it remains unknown who brought the cold-tolerant barley agriculture and livestock to the TP, and how indigenous foragers interacted with the incoming farmers. The archeological observations demonstrated that incoming farmer groups did not replace the local foragers, but co-existed with them for extended periods (Gao et al., 2020; Ren et al., 2020). The mitochondrial evidence and radiocarbon dates of the cereal remains also revealed that millet farmers adopted and brought barley agriculture to the TP around 3.6–3.3 kya. Contemporary Tibetans could trace their main ancestry back to the Neolithic millet farmers (Li et al., 2019). Moreover, the genetic variations of modern Tibetan groups have also been explored based on the forensically available markers (Wang Z. et al., 2018; Zou et al., 2018; He et al., 2019). However, the low resolution of these markers hindered the comprehensive understanding of prehistoric human activities on the TP and impeded the dissection of the ancestral component of Tibetans. Lu and Zhang et al. conducted a series of typical population genomic studies focusing on the demographic history of modern Tibetans and other high-altitude highlanders (Lu et al., 2016; Zhang et al., 2017). They found that Tibetans arose from a mixture of multiple ancestral genetic sources with the co-existence of Paleolithic and Neolithic ancestries.
Collectively, previous studies paved the way toward a better understanding of the Middle Pleistocene arrival, Paleolithic colonization and Neolithic permanent settlement on the TP. However, most of the previous archeological investigations have primarily focused on the NETP (< 4000 masl). Besides, the lack of discussion of ancient samples from the TP and incomprehensive analysis of ancient/modern individuals from East Asia hindered our ability to spatiotemporally connect dispersed ancient East Asians and modern Tibetans. Thus, we comprehensively meta-analyzed the genetic variations of ancient/modern highlanders from the TP and surrounding lowland eastern Eurasians with the aims to (I) portray the genetic landscape of the East Asian highlanders, (II) study the genetic similarities and differences between highlanders and lowlanders, (III) explore the genetic substructure among geographically/culturally different Tibetans, (IV) reconstruct their deep evolutionary history and the corresponding migration and admixture processes. By analyzing genome-wide data of modern Tibetans and Neolithic-to-historic individuals from East Asia, we shed light on the genetic transition, turnover or continuity, ancestral composition, and demographic history of Tibetan highlanders.
|
|
|
|
Post by Admin on Mar 22, 2022 21:21:41 GMT
Materials and Methods Publicly Available Dataset We collected 2,444 individuals from 183 geographically/culturally different populations (Patterson et al., 2012; Lipson et al., 2018a; Jeong et al., 2019; Liu D. et al., 2020) belonging to fifteen language families or groups: Altai (also referred to as Trans-Eurasian including Mongolic, Japonic, Koranic, Tungusic, and Turkic), Sino-Tibetan (Sinitic and Tibeto-Burman), Hmong-Mien, Austronesian, Austroasiatic, Uralic, Caucasian, Chukotko-Kamchatkan, Eskimo-Aleut, Indo-European and Tai-Kadai. The 383 modern East Asian individuals genotyped via the Affymetrix Human Origins array were also used here (Wang C. C. et al., 2021). To explore the genomic history of modern Tibetans and elucidate the peopling process of the TP, we focused on the genome-wide data of 98 modern Tibetans collected from eleven geographically different regions with different cultural backgrounds, which includes five Ü-Tsang Tibetan groups from Tibet Autonomous Region, three Ando Tibetan groups from Qinghai and Gansu, four Kham Tibetan groups from Sichuan, Yunnan, and Tibet (Figure 1A). Raw data were quality-controlled using the PLINK v.1.9 (Chang et al., 2015) following the standard threshold (Wang C. C. et al., 2021; Yao et al., 2021). Besides, Paleolithic-to-historic published ancient genomes from East Eurasia (Russia, China, Mongolia, Nepal and Southeast Asia) were collected from recent ancient DNA studies or from Allen Ancient DNA Resource (AADR) released by Reich Lab (Jeong et al., 2016; Yang et al., 2017, 2020; Ning et al., 2020; Wang C. C. et al., 2021). A total of 161 Paleolithic to historic East Asians and eight Nepal ancients were collected and first comprehensively meta-analyzed and discussed (Jeong et al., 2016; Yang et al., 2017, 2020; Ning et al., 2020; Wang C. C. et al., 2021). Detailed information of key ancient populations is presented in Table 1. FIGURE 1  Figure 1. The geographical position of the focused Tibetans and genetic patterns of East Asians. (A) Sampling place of eleven geographically different modern Tibetan populations mainly discussed in the present study from the five provinces (Tibet Tibetan Autonomous Region, Qinghai, Gansu, Sichuan, and Yunnan) from western China. China map is presented in the top-left of A and five studied western provinces were zoom-in as the presented Google map. (B) Principal component analysis (PCA) showed the genetic similarities and differences between the ancient/modern East Asians from geographically/linguistically/culturally different populations. Spatial-temporally diverse ancient populations were projected onto the two-dimensional genetic background of modern East Asians. (C) Admixture ancestry estimation based on the model-based ADMIXTURE. Here, the optimal predefined ten ancestral populations were used. EN, early Neolithic; MN, middle Neolithic; LN, late Neolithic; IA, iron age; BA, bronze Age; LBIA, late bronze age and iron age; Lc, loc coverage; O, outlier. Table 1. The detailed information of included ancient Chinese populations. 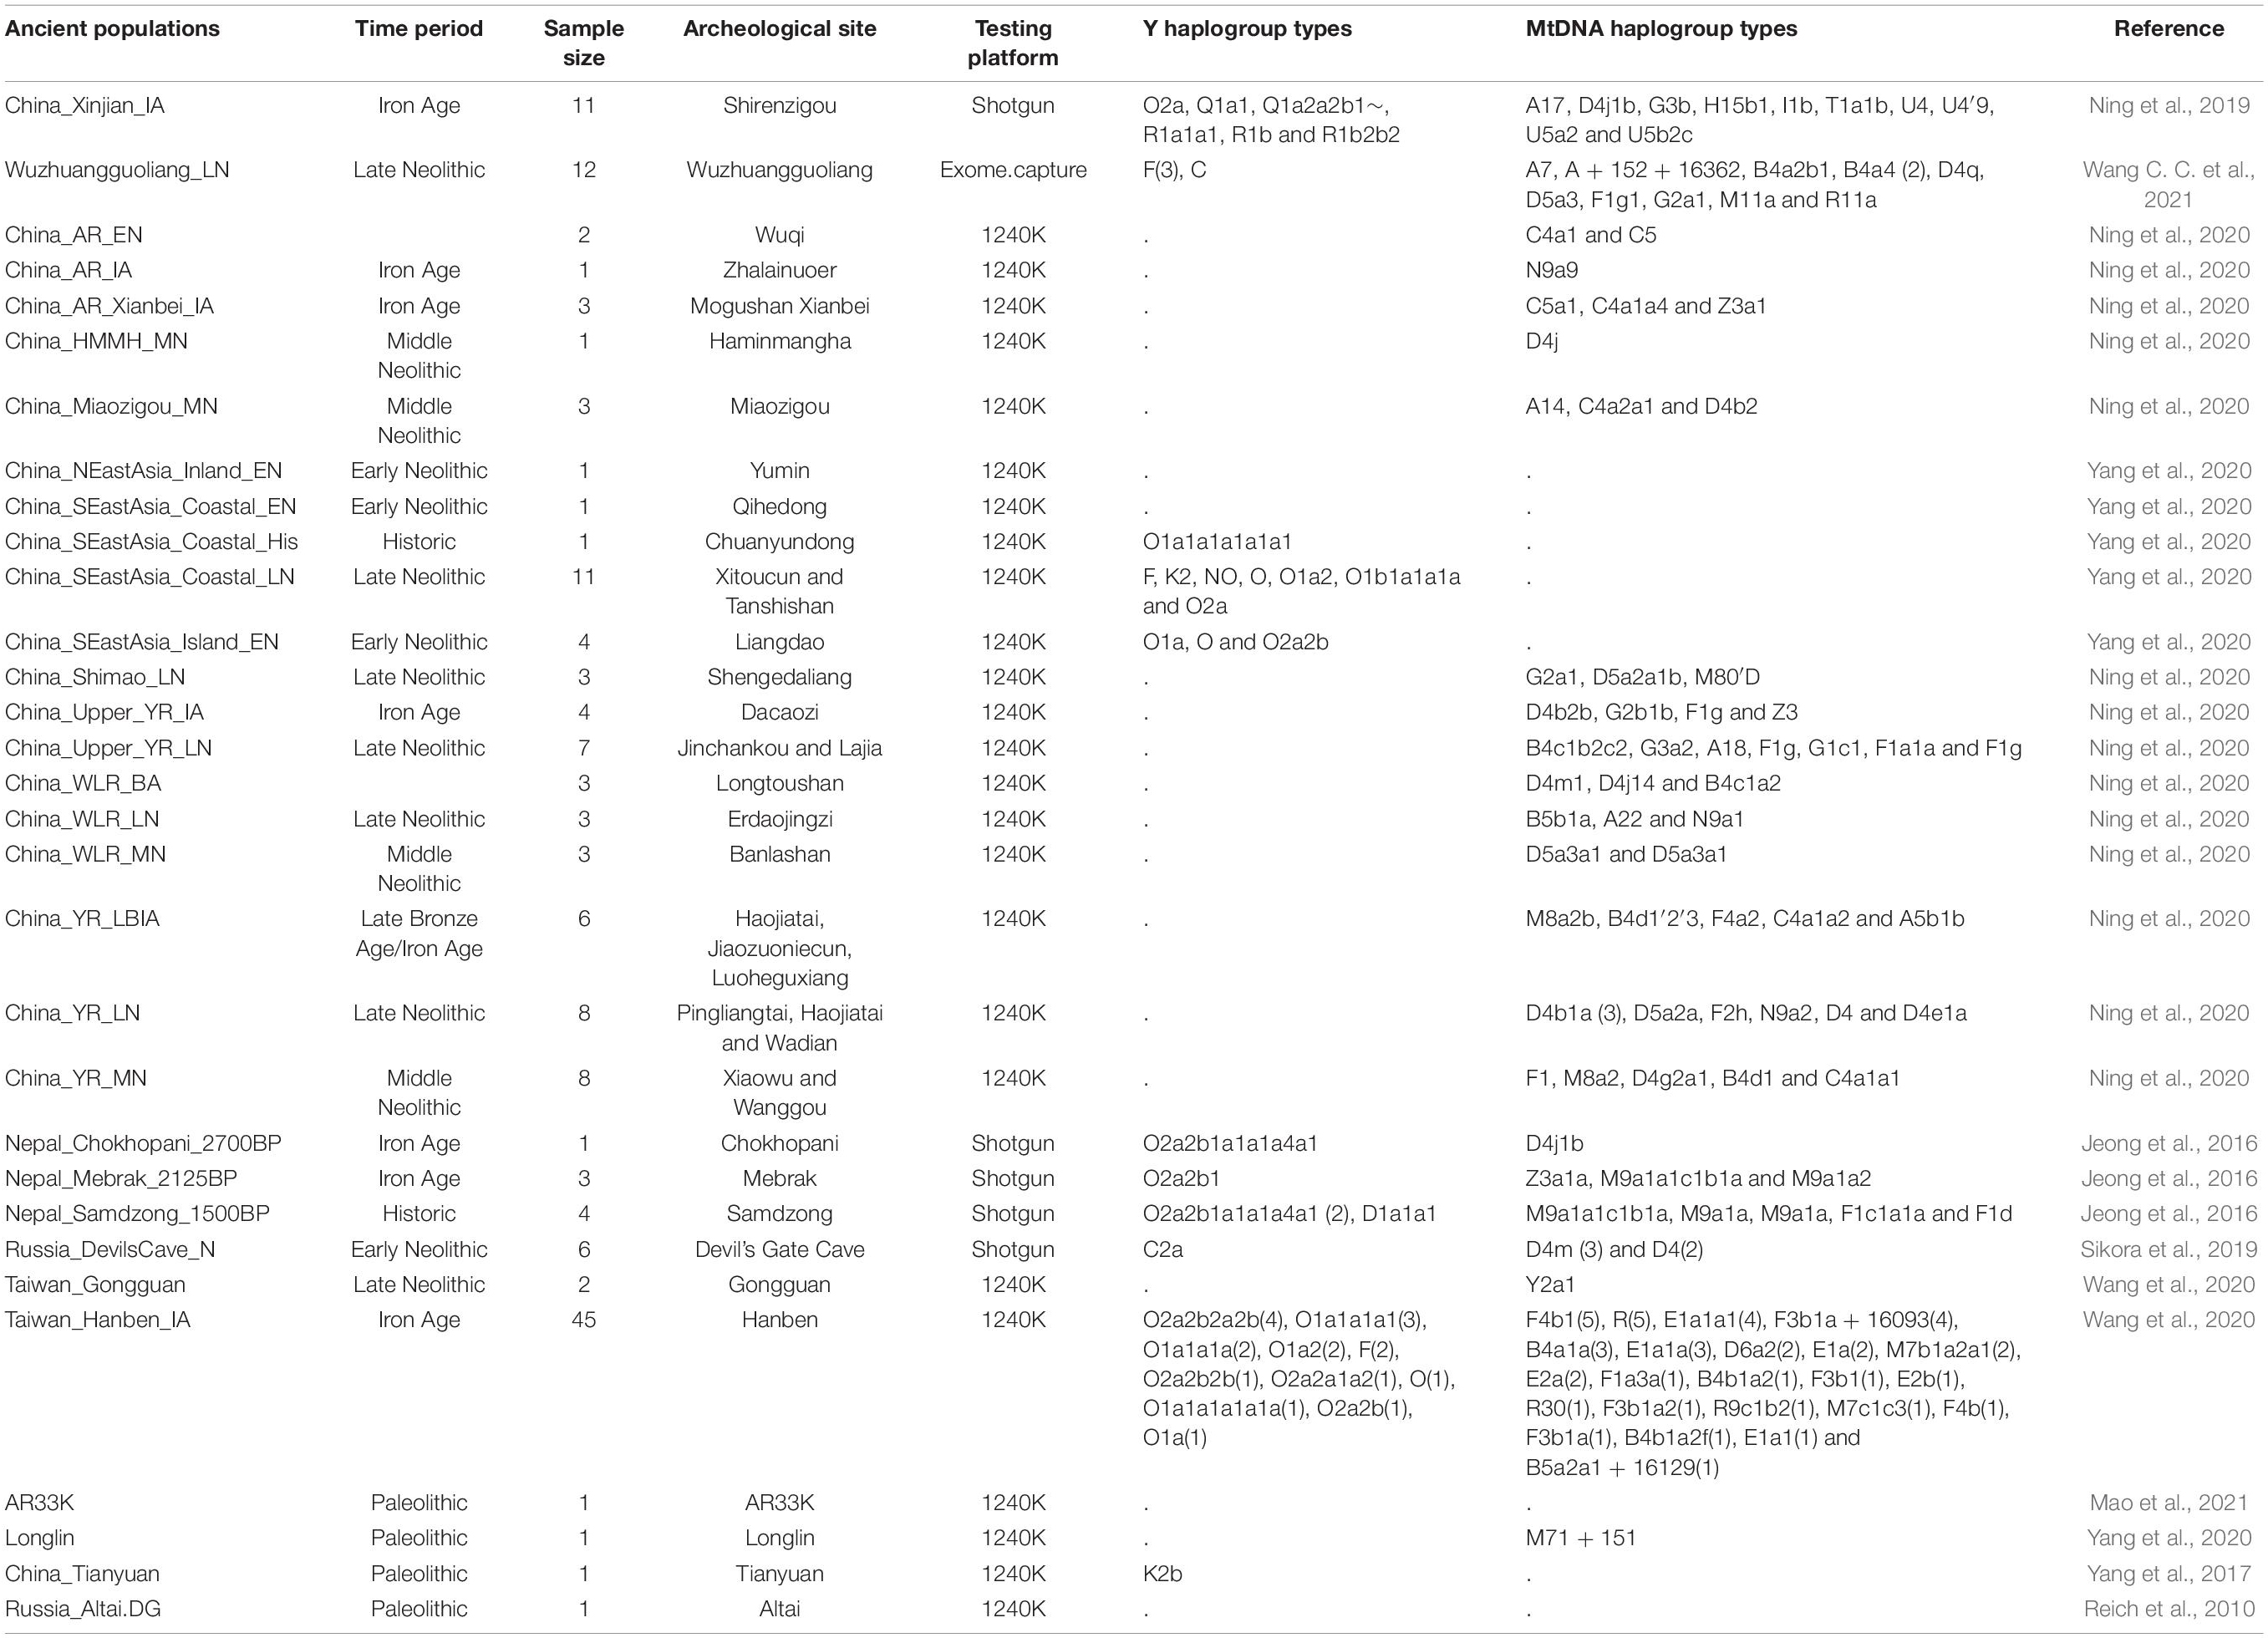 |
|

