

Post by Admin on Apr 25, 2022 18:44:03 GMT
Y-chromosome population substructure and origins
AMOVA analyses showed that Y-chromosome diversity was neither structured by country of residence nor by migration route (Supplementary Table S5), supporting weak population structure in the male Roma chromosomes.
We tested the impact of the Roma demographic history (inferred from the Roma migration routes) on the observed Y-chromosome genetic diversity. We calculated the correlations between intrapopulation genetic diversity (measured by WIMP) or genetic distances (FST) and geographic locations along the migration route. If Roma populations spread from the Balkan Peninsula following the proposed migration routes, we would expect a decrease in the internal genetic diversity within populations and an increase in the genetic distances between them as a result of serial bottlenecks and founder effects. This pattern is expected to be stronger in founder lineages than in non-founder lineages, the majority of which might have been incorporated after the spread of Roma. However, we did not find any significant correlation between migration routes and genetic data for the Y-chromosome (Figure 2, Supplementary Figure S3, and Supplementary Table S7).
Figure 2
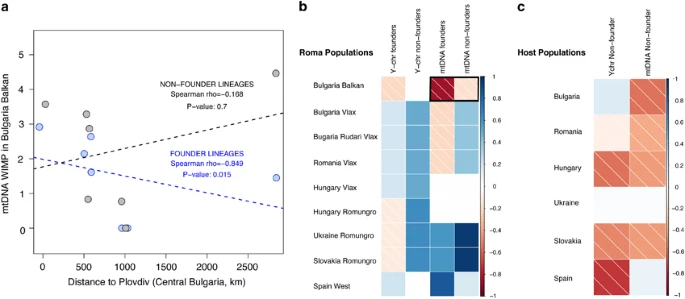
Correlations (Spearman’s rank) between geographical distance and internal diversity measured by WIMP. (a) Example of the correlation (separating founder and non-founder lineages) for the mtDNA taking as a reference Balkan Bulgarian Roma. The dashed lines indicate linear regression (lm() function in R). (b) Correlations for founder and non-founder lineages in Roma samples (in bold, the example shown in a). (c) Correlations in host populations. P-values of the correlations are shown in Supplementary Table S7.
Although we could identify several founder Y-lineages in Roma, the only lineage for which an Indian origin could be unambiguously traced back to the Indian subcontinent was the H-M52 haplogroup (including H-M82).4, 17 The origin of the Roma population in a specific geographical region in India was investigated through the search of identical matches of Roma haplotypes from individuals carrying this haplogroup in India. The highest probability was found in the North (P=0.66) followed by Central India (P=0.19), whereas the rest of regions summed up 15% (Table 2).
mtDNA diversity and founder lineages
The levels of mtDNA genetic diversity were generally low for the Roma populations when compared with their hosts (Supplementary Table S1), similar to the observation in paternal haplotypes. Five hundred and seventy-five different mtDNA sequences were found, 190 in Roma and 421 in hosts, and only 36 were shared between both groups (Supplementary Table S3).
We identified 11 founder maternal lineages in Roma (Supplementary Tables S3 and S6), which represented 58% of the individuals, 35.2% of which carried founder non-M Indian lineages. Besides the founder lineages described by Mendizabal et al,7 we identified a new founder lineage, I1a, the frequency of which ranges from 0% in Spanish Roma to 32% in Slovakian Roma. WIMP values for the founding lineages in Roma varied substantially among populations (Figure 1b). In agreement with Y-chromosome lineages, there are remarkable differences between Bulgarian Roma groups.17 Nonetheless, the most extreme values are observed in Slovakian and Ukrainian Roma, where the WIMP value is null or extremely low. These values might indicate strong local founder effects in those neighboring Roma settlements, probably compounded by small sample size in the case of Ukrainian Roma.
mtDNA population substructure and origins
The AMOVA results supported that the mtDNA genetic variance in the Roma was structured by historical migration routes and not by country of residence (Supplementary Tables S5), in accordance with previous results7, 17 and in contrast with our results for the Y-chromosome.
To evaluate putative signatures of the spread of Roma, we tested the correlation between geographic distances and the observed genetic diversities, as performed for the Y-chromosome. As expected under an out-of-Balkan hypothesis, founder lineages show a significant negative correlation between intrapopulation genetic diversities (ie, WIMP values) and geographic distances from the Balkan area, especially with the Bulgarian Balkan Roma (Figure 2); in other words, founder lineages are more diverse in the Balkan area and decrease progressively with increasing distance. In contrast, the significant positive correlation between internal genetic diversities and geographic distance from Western Europe (ie, Spain) suggests that the Iberian Roma might represent one of the latest settlements in the primary dispersal of Roma within Europe. Similar patterns (although nonsignificant) can be observed studying pairwise genetic distances and geographic distances for founder lineages (Supplementary Figure S3). Conversely, this pattern is diluted in non-founder lineages in Roma and host groups.
We considered the exact matches of both founder and non-founder mitochondrial lineages between Roma and hosts as indicative of gene flow (and directionality) between them. Only seven individuals from the host populations present identical matches with Roma individuals for the founder Roma lineages (one Romanian, two Bulgarians, two Slovakians, one Hungarian, and one Ukrainian, representing between 1.2% and 2.2% of the host populations carrying an exact match). We found that gene flow in the other direction, taking into account non-founder lineages, appears to be much higher. For example, up to 16.5% Hungarian, 10.2% Slovakian, 9.9% Bulgarian Balkan, 9.8% Bulgarian Vlax, 5.8% Greek, 5.5% Romanian, and 2.4% Spanish Roma carry a haplotype also present in the studied non-Roma populations.
From the founder lineages, only the M-lineages could be traced back as original from India,4, 17 mirroring Y-chromosome H haplogroup. We searched for matches of M-haplotypes present in European Roma within India, under the assumption that all the European Roma originated from the same region. The highest probability for the mtDNA in Roma populations was found in NW India (P=0.713; Table 2), in agreement with previous studies,6, 7, 9 linguistic, anthropological, and historical evidences.1
The evolution of the population size through time was modeled for the M-lineages in a BSP (Supplementary Figure S4), assuming that these lineages will reveal the demographic history of the proto-Roma population before its arrival into Europe. We expected a bottleneck signal by the time of the diaspora from India as recently shown for autosomal markers.6 Surprisingly, no signal of founder effect was detected. Otherwise, the BSP showed an increase in Ne starting 3–4 ky ago, which coincides with the expansion of the Indo-European languages in North India.48
AMOVA analyses showed that Y-chromosome diversity was neither structured by country of residence nor by migration route (Supplementary Table S5), supporting weak population structure in the male Roma chromosomes.
We tested the impact of the Roma demographic history (inferred from the Roma migration routes) on the observed Y-chromosome genetic diversity. We calculated the correlations between intrapopulation genetic diversity (measured by WIMP) or genetic distances (FST) and geographic locations along the migration route. If Roma populations spread from the Balkan Peninsula following the proposed migration routes, we would expect a decrease in the internal genetic diversity within populations and an increase in the genetic distances between them as a result of serial bottlenecks and founder effects. This pattern is expected to be stronger in founder lineages than in non-founder lineages, the majority of which might have been incorporated after the spread of Roma. However, we did not find any significant correlation between migration routes and genetic data for the Y-chromosome (Figure 2, Supplementary Figure S3, and Supplementary Table S7).
Figure 2
Correlations (Spearman’s rank) between geographical distance and internal diversity measured by WIMP. (a) Example of the correlation (separating founder and non-founder lineages) for the mtDNA taking as a reference Balkan Bulgarian Roma. The dashed lines indicate linear regression (lm() function in R). (b) Correlations for founder and non-founder lineages in Roma samples (in bold, the example shown in a). (c) Correlations in host populations. P-values of the correlations are shown in Supplementary Table S7.
Although we could identify several founder Y-lineages in Roma, the only lineage for which an Indian origin could be unambiguously traced back to the Indian subcontinent was the H-M52 haplogroup (including H-M82).4, 17 The origin of the Roma population in a specific geographical region in India was investigated through the search of identical matches of Roma haplotypes from individuals carrying this haplogroup in India. The highest probability was found in the North (P=0.66) followed by Central India (P=0.19), whereas the rest of regions summed up 15% (Table 2).
Table 2 Estimated probabilities of the origin of Roma in the Indian subcontinent and their corresponding SD
From: Origins, admixture and founder lineages in European Roma

 	N	Probability	SD
Y-chromosome
 Central India	71	0.190	0.024
 East India	128	0.027	0.010
 North India	80	0.656	0.029
 South India	303	0.103	0.018
 West India	59	0.025	0.009
mtDNA
 Northwest India	418	0.713	0.031
 North India	314	0.025	0.011
 West India	348	0.003	0.004
 Southwest India	431	0.000	0.000
 Southeast India	1,443	0.061	0.016
 East India	483	0.197	0.027
 Northeast India	314	0.000	0.000
N, number of Indian samples used in the analysis.
mtDNA diversity and founder lineages
The levels of mtDNA genetic diversity were generally low for the Roma populations when compared with their hosts (Supplementary Table S1), similar to the observation in paternal haplotypes. Five hundred and seventy-five different mtDNA sequences were found, 190 in Roma and 421 in hosts, and only 36 were shared between both groups (Supplementary Table S3).
We identified 11 founder maternal lineages in Roma (Supplementary Tables S3 and S6), which represented 58% of the individuals, 35.2% of which carried founder non-M Indian lineages. Besides the founder lineages described by Mendizabal et al,7 we identified a new founder lineage, I1a, the frequency of which ranges from 0% in Spanish Roma to 32% in Slovakian Roma. WIMP values for the founding lineages in Roma varied substantially among populations (Figure 1b). In agreement with Y-chromosome lineages, there are remarkable differences between Bulgarian Roma groups.17 Nonetheless, the most extreme values are observed in Slovakian and Ukrainian Roma, where the WIMP value is null or extremely low. These values might indicate strong local founder effects in those neighboring Roma settlements, probably compounded by small sample size in the case of Ukrainian Roma.
mtDNA population substructure and origins
The AMOVA results supported that the mtDNA genetic variance in the Roma was structured by historical migration routes and not by country of residence (Supplementary Tables S5), in accordance with previous results7, 17 and in contrast with our results for the Y-chromosome.
To evaluate putative signatures of the spread of Roma, we tested the correlation between geographic distances and the observed genetic diversities, as performed for the Y-chromosome. As expected under an out-of-Balkan hypothesis, founder lineages show a significant negative correlation between intrapopulation genetic diversities (ie, WIMP values) and geographic distances from the Balkan area, especially with the Bulgarian Balkan Roma (Figure 2); in other words, founder lineages are more diverse in the Balkan area and decrease progressively with increasing distance. In contrast, the significant positive correlation between internal genetic diversities and geographic distance from Western Europe (ie, Spain) suggests that the Iberian Roma might represent one of the latest settlements in the primary dispersal of Roma within Europe. Similar patterns (although nonsignificant) can be observed studying pairwise genetic distances and geographic distances for founder lineages (Supplementary Figure S3). Conversely, this pattern is diluted in non-founder lineages in Roma and host groups.
We considered the exact matches of both founder and non-founder mitochondrial lineages between Roma and hosts as indicative of gene flow (and directionality) between them. Only seven individuals from the host populations present identical matches with Roma individuals for the founder Roma lineages (one Romanian, two Bulgarians, two Slovakians, one Hungarian, and one Ukrainian, representing between 1.2% and 2.2% of the host populations carrying an exact match). We found that gene flow in the other direction, taking into account non-founder lineages, appears to be much higher. For example, up to 16.5% Hungarian, 10.2% Slovakian, 9.9% Bulgarian Balkan, 9.8% Bulgarian Vlax, 5.8% Greek, 5.5% Romanian, and 2.4% Spanish Roma carry a haplotype also present in the studied non-Roma populations.
From the founder lineages, only the M-lineages could be traced back as original from India,4, 17 mirroring Y-chromosome H haplogroup. We searched for matches of M-haplotypes present in European Roma within India, under the assumption that all the European Roma originated from the same region. The highest probability for the mtDNA in Roma populations was found in NW India (P=0.713; Table 2), in agreement with previous studies,6, 7, 9 linguistic, anthropological, and historical evidences.1
The evolution of the population size through time was modeled for the M-lineages in a BSP (Supplementary Figure S4), assuming that these lineages will reveal the demographic history of the proto-Roma population before its arrival into Europe. We expected a bottleneck signal by the time of the diaspora from India as recently shown for autosomal markers.6 Surprisingly, no signal of founder effect was detected. Otherwise, the BSP showed an increase in Ne starting 3–4 ky ago, which coincides with the expansion of the Indo-European languages in North India.48