|
|
Post by Admin on Jun 2, 2017 19:19:39 GMT
 Figure 1: Geographic context, of the samples used in this study. Despite their potential to address research questions relating to population migrations, genetic studies of ancient Egyptian mummies and skeletal material remain rare, although research on Egyptian mummies helped to pioneer the field of ancient DNA research with the first reported retrieval of ancient human DNA6. Since then progress has been challenged by issues surrounding the authentication of the retrieved DNA and potential contaminations inherent to the direct PCR method7. Furthermore, the potential DNA preservation in Egyptian mummies was met with general scepticism: The hot Egyptian climate, the high humidity levels in many tombs and some of the chemicals used in mummification techniques, in particular sodium carbonate, all contribute to DNA degradation and are thought to render the long-term survival of DNA in Egyptian mummies improbable8. Experimental DNA decay rates in papyri have also been used to question the validity and general reliability of reported ancient Egyptian DNA results9. The recent genetic analysis of King Tutankhamun’s family10 is one of the latest controversial studies that gave rise to this extensive scholarly debate11. New data obtained with high-throughput sequencing methods have the potential to overcome the methodological and contamination issues surrounding the PCR method and could help settle the debate surrounding ancient Egyptian DNA preservation8. However, the first high-throughput sequences obtained from ancient Egyptian mummies12 were not supported by rigorous authenticity and contamination tests. Here, we provide the first reliable data set obtained from ancient Egyptians using high-throughput DNA sequencing methods and assessing the authenticity of the retrieved ancient DNA via characteristic nucleotide misincorporation patterns13,14 and statistical contamination tests15 to ensure the ancient origin of our obtained data. By directly studying ancient DNA from ancient Egyptians, we can test previous hypotheses drawn from analysing modern Egyptian DNA, such as recent admixture from populations with sub-Saharan16 and non-African ancestries17, attributed to trans-Saharan slave trade and the Islamic expansion, respectively. On a more local scale, we aim to study changes and continuities in the genetic makeup of the ancient inhabitants of the Abusir el-Meleq community (Fig. 1), since all sampled remains derive from this community in Middle Egypt and have been radiocarbon dated to the late New Kingdom to the Roman Period (cal. 1388BCE–426CE, Supplementary Data 1). In particular, we seek to determine if the inhabitants of this settlement were affected at the genetic level by foreign conquest and domination, especially during the Ptolemaic (332–30BCE) and Roman (30BCE–395CE) Periods.  Figure 2: DNA preservation and DNA damage of the samples used in this study. (a) coverage boxplots separated by tissue type (bone, mummified tissue, teeth), (b) boxplots showing damage of first base at the 3′ end separated by tissue type according to a, (c) damage on first base at the 5′ end of mapped reads separated by tissue type according to a and b. Comparison of the DNA preservation in different tissues We tested different tissues for DNA preservation and applied strict criteria for authenticity on the retrieved mitochondrial and nuclear DNA to establish authentic ancient Egyptian DNA. First, DNA extracts from several tissues (that is, bone, teeth, soft tissue and macerated teeth) from 151 individuals were screened for the presence of human mitochondrial DNA (mtDNA) resulting in a total of 2,157 to 982,165 quality filtered mitochondrial reads per sample, and 11- to 4,236-fold coverage. To estimate, identify and filter out potential contamination we applied the program schmutzi15 with strict criteria for contamination and kept only samples with less than 3% contamination for further analysis. For a comparison of different source material (soft tissue, bone and teeth) ten individuals (Supplementary Table 1) were sampled multiple times. Yields of preserved DNA were comparable in bone and teeth but up to ten times lower in soft tissues (Fig. 2a, Supplementary Table 1). Nucleotide misincorporation patterns characteristic for damaged ancient human DNA allowed us to assess the authenticity of the retrieved DNA13,14. The observed DNA damage patterns differed for the source materials with on average 19% damage in soft tissues and around 10% damage in bone tissue and teeth (Fig. 2b,c, Supplementary Table 1). Importantly, mtDNA haplotypes were identical for all samples from the same individuals. Our results thus suggest that DNA damage in Egyptian mummies correlates with tissue type. The protection of bone and teeth by the surrounding soft tissue or the embalmment of soft tissue may have contributed to the observed differences. Generation of nuclear data In order to analyse the nuclear DNA we selected 40 samples with high mtDNA coverage and low mtDNA contamination. Using in solution enrichment for 1.2 million genome-wide SNPs26, we obtained between 3,632 and 508,360 target SNPs per sample (Supplementary Data 2). Overall, the nuclear DNA showed poor preservation compared to the mtDNA as depicted by a high mitochondrial/nuclear DNA ratio of on average around 18,000. In many samples, nuclear DNA damage was relatively low, indicating modern contamination. We sequenced two libraries per sample: one untreated library to assess DNA damage, and one library treated with enzymatic damage repair27, which was used for downstream analysis. We applied strict criteria for further analysis: we considered only male samples with at least 8% average cytosine deamination rates at the ends of the reads from the untreated library, and with at least 150 SNPs on the X chromosome covered at least twice, in order to estimate contamination levels reliably. Three out of 40 samples fulfilling these criteria had acceptable nuclear contamination rates: Two samples from the Pre-Ptolemaic Periods (New Kingdom to Late Period) had 5.3 and 0.5% nuclear contamination and yielded 132,084 and 508,360 SNPs, respectively, and one sample from the Ptolemaic Period had 7.3% contamination and yielded 201,967 SNPs. As shown below, to rule out any impact of potential contamination on our results, we analysed the three samples separately or replicated results using only the least contaminated sample. |
|
|
|
Post by Admin on Jun 3, 2017 19:46:29 GMT
 Figure 3: Analysis of 90 ancient Egyptian mitochondrial genomes. (a) Mitochondrial DNA haplogroup frequencies of three ancient and two modern-day populations, (b) Principal Component Analysis based on haplogroup frequencies: (sub-Saharan Africa (green), North Africa (light green), Near East (orange), Europe (yellow), ancient (blue), (c) MDS of HVR-I sequence data: colour scheme as above; note that ancient groups were pooled, (d) Skygrid plot depicting effective population size estimates over the last 5,000 years in Egypt. Vertical bars indicate the ages of the analysed 90 mitochondrial genomes (three samples with genome-wide data highlighted in red). Note that the values on y axis are given in female effective population size times generation time and were rescaled by 1:14.5 for the estimation of the studied population size (assuming 29-year generation time and equal male and female effective population sizes) (images by Kerttu Majander). Analysis of mitochondrial genomes The 90 mitochondrial genomes fulfilling our criteria (>10-fold coverage and <3% contamination) were grouped into three temporal categories based on their radiocarbon dates (Supplementary Data 1), corresponding to Pre-Ptolemaic Periods (n=44), the Ptolemaic Period (n=27) and the Roman Period (n=19) (Supplementary Data 1). To test for genetic differentiation and homogeneity we compared haplogroup composition, calculated FST-statistics28 and applied a test for population continuity29 (Supplementary Table 2, Supplementary Data 3,4) on mitochondrial genome data from the three ancient and two modern-day populations from Egypt and Ethiopia, published by Pagani and colleagues17, including 100 modern Egyptian and 125 modern Ethiopian samples (Fig. 3a). We furthermore included data from the El-Hayez oasis published by Kujanová and colleagues30. We observe highly similar haplogroup profiles between the three ancient groups (Fig. 3a), supported by low FST values (<0.05) and P values >0.1 for the continuity test. Modern Egyptians share this profile but in addition show a marked increase of African mtDNA lineages L0–L4 up to 20% (consistent with nuclear estimates of 80% non-African ancestry reported in Pagani et al.17). Genetic continuity between ancient and modern Egyptians cannot be ruled out by our formal test despite this sub-Saharan African influx, while continuity with modern Ethiopians17, who carry >60% African L lineages, is not supported (Supplementary Data 5). To further test genetic affinities and shared ancestry with modern-day African and West Eurasian populations we performed a principal component analysis (PCA) based on haplogroup frequencies and Multidimensional Scaling of pairwise genetic distances. We find that all three ancient Egyptian groups cluster together (Fig. 3b), supporting genetic continuity across our 1,300-year transect. Both analyses reveal higher affinities with modern populations from the Near East and the Levant compared to modern Egyptians (Fig. 3b,c). The affinity to the Middle East finds further support by the Y-chromosome haplogroups of the three individuals for which genome-wide data was obtained, two of which could be assigned to the Middle-Eastern haplogroup J, and one to haplogroup E1b1b1 common in North Africa (Supplementary Table 3). However, comparative data from a contemporary population under Roman rule in Asia Minor, from the Roman city Ağlasun today in Turkey31, did not reveal a closer relationship to the ancient Egyptians from the Roman period (Fig. 3b,c). |
|
|
|
Post by Admin on Jun 4, 2017 19:09:45 GMT
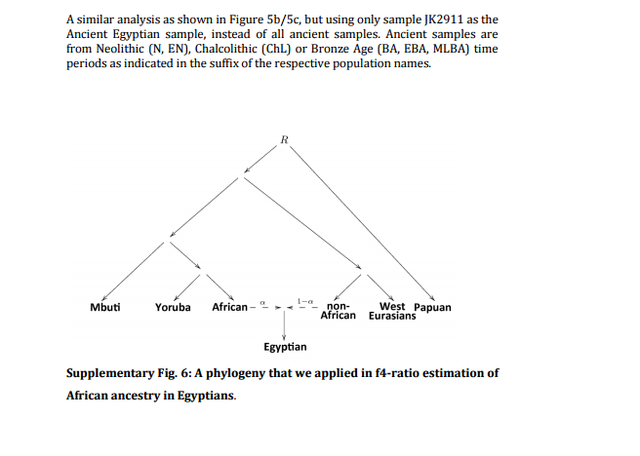
 Figure 4: Principal component analysis and genetic clustering of genome-wide DNA from three ancient Egyptians. (a) Principal Component Analysis-based genome-wide SNP data of three ancient Egyptians, 2,367 modern individuals and 294 previously published ancient genomes, (b) subset of the full ADMIXTURE analysis (Supplementary Fig. 4). Population genetic analysis of nuclear DNA On the nuclear level we merged the SNP data of our three ancient individuals with 2,367 modern individuals34,35 and 294 ancient genomes36 and performed PCA on the joined data set. We found the ancient Egyptian samples falling distinct from modern Egyptians, and closer towards Near Eastern and European samples (Fig. 4a, Supplementary Fig. 3, Supplementary Table 5). In contrast, modern Egyptians are shifted towards sub-Saharan African populations. Model-based clustering using ADMIXTURE37 (Fig. 4b, Supplementary Fig. 4) further supports these results and reveals that the three ancient Egyptians differ from modern Egyptians by a relatively larger Near Eastern genetic component, in particular a component found in Neolithic Levantine ancient individuals36 (Fig. 4b). In contrast, a substantially larger sub-Saharan African component, found primarily in West-African Yoruba, is seen in modern Egyptians compared to the ancient samples. In both PCA and ADMIXTURE analyses, we did not find significant differences between the three ancient samples, despite two of them having nuclear contamination estimates over 5%, which indicates no larger impact of modern DNA contamination. We used outgroup f3-statistics38 (Fig. 5a,b) for the ancient and modern Egyptians to measure shared genetic drift with other ancient and modern populations, using Mbuti as outgroup. We find that ancient Egyptians are most closely related to Neolithic and Bronze Age samples in the Levant, as well as to Neolithic Anatolian and European populations (Fig. 5a,b).  Figure 5: Shared drift and mixture analysis of three ancient Egyptians with other modern and ancient populations. (a) Outgroup f3-statistics measuring shared drift of the three ancient Egyptian samples and other modern and ancient populations, (b) The data shown in a, compared with the same estimates for modern Egyptians, ordered by shared drift with modern Egyptians, (c) Admixture f3-statistics, testing whether modern Egyptians are mixed from ancient Egyptians and some other source. The most negative Z-scores indicate the most likely source populations. When comparing this pattern with modern Egyptians, we find that the ancient Egyptians are more closely related to all modern and ancient European populations that we tested (Fig. 5b), likely due to the additional African component in the modern population observed above. By computing f3-statistics38, we determined whether modern Egyptians could be modelled as a mixture of ancient Egyptian and other populations. Our results point towards sub-Saharan African populations as the missing component (Fig. 5c), confirming the results of the ADMIXTURE analysis. We replicated the results based on f3-statistics using only the least contaminated sample (with <1% contamination estimate) and find very similar results (Supplementary Fig. 5), confirming that the moderate levels of modern DNA contamination in two of our samples did not affect our analyses. Finally, we used two methods to estimate the fractions of sub-Saharan African ancestry in ancient and modern Egyptians. Both qpAdm35 and the f4-ratio test39 reveal that modern Egyptians inherit 8% more ancestry from African ancestors than the three ancient Egyptians do, which is also consistent with the ADMIXTURE results discussed above. Absolute estimates of African ancestry using these two methods in the three ancient individuals range from 6 to 15%, and in the modern samples from 14 to 21% depending on method and choice of reference populations (see Supplementary Note 1, Supplementary Fig. 6, Supplementary Tables 5–8). We then used ALDER40 to estimate the time of a putative pulse-like admixture event, which was estimated to have occurred 24 generations ago (700 years ago), consistent with previous results from Henn and colleagues16. While this result by itself does not exclude the possibility of much older and continuous gene flow from African sources, the substantially lower African component in our ∼2,000-year-old ancient samples suggests that African gene flow in modern Egyptians occurred indeed predominantly within the last 2,000 years. |
|
|
|
Post by Admin on Jun 6, 2017 19:54:57 GMT
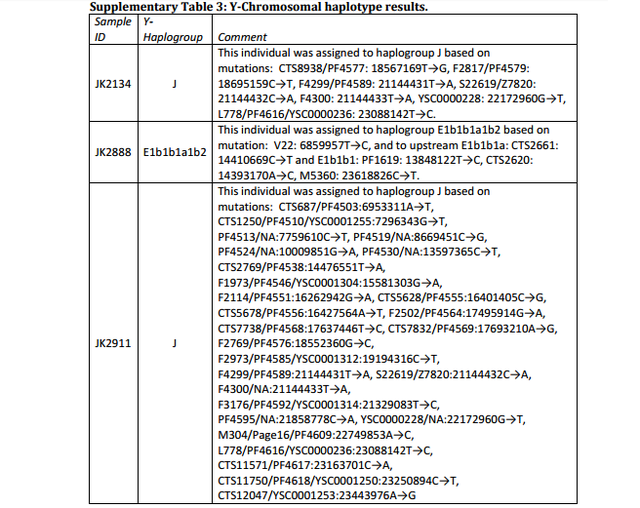 The affinity to the Middle East finds further support by the Y-chromosome haplogroups of the three individuals for which genome-wide data was obtained, two of which could be assigned to the Middle-Eastern haplogroup J, and one to haplogroup E1b1b1 common in North Africa (Supplementary Table 3). However, comparative data from a contemporary population under Roman rule in Asia Minor, from the Roman city Ağlasun today in Turkey31, did not reveal a closer relationship to the ancient Egyptians from the Roman period (Fig. 3b,c). 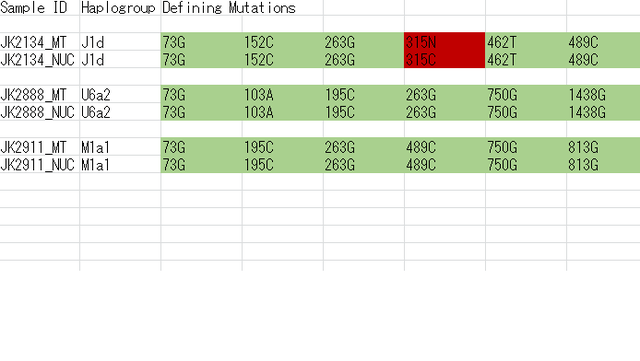 Supplementary Data 3 Schuenemann et al. (2017) found that the two  samples (JK2134 and JK2911) belong to Y-DNA haplogroup J, which is common in the Middle East, and one sample (JK2888) has haplogroup E1b1b1, which is essentially an African haplogroup. Overall, the ancient Egyptian samples showed certain genetic affinities with modern-day East Africans such as Ethiopians and the ancient Egyptians may have originated from the Horn of Africa. The data (Supplementary Data 3) further shows that the three ancient Egyptian samples JK2134, JK2888 and JK2911 belong to mtDNA haplogroups J1d, U6a2 and M1a1, respectively. J1d and its subclades are considered Near Eastern and U6a2 is close to the East African cluster U6a2a. The majority of the M1a lineages found outside and inside Africa had a more recent eastern African origin (González et al. 2007).  |
|
|
|
Post by Admin on Jun 7, 2017 19:17:47 GMT
 Y-chromosomal and phenotypic analysis We determined the Y chromosomal haplogroups for our three nuclear captured individuals by examining the state of phylogenetic relevant SNPs present in ISOGG version 11.228 (accessed 19 August 2016). The assignment was performed with reads that show a mapping quality of more than 30 only. We derived the haplogroups by identifying the most derived Y chromosomal SNPs in each individual (see Supplementary Table 3 for details). Our analysis furthermore shows that derived alleles for the genes SLC24A5, known to be responsible for partially lighter skin pigmentation were present in both JK2888 and JK2911 (see Supplementary Note 6 for details). For further genes such as SLC45A2, LCT and EDAR we were unable to find derived alleles for both JK2888 and JK2911. For JK2134, there was no sufficient coverage after quality filtering at all the specific sites, which is why the analysis revealed no further clues. 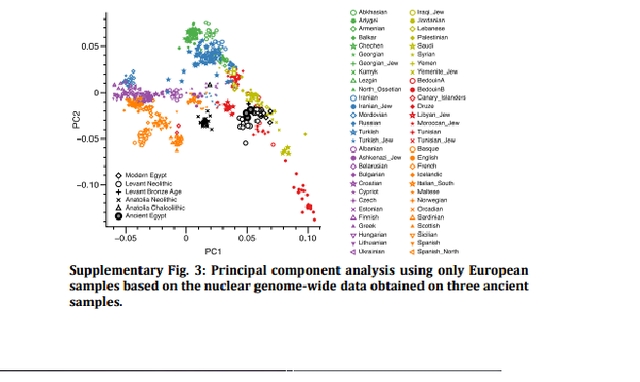 Note 6: Y-chromosomal & phenotypic analysis Chuanchao Wang, Alexander Peltzer The current distribution of E1b1b1 in North Africa could also be caused by the back migration from the Near East to Africa that have already been proposed by several authors (77-79). The high frequencies of haplogroup R1-M173 in Cameroon also supported the back migration from Eurasia to Africa (80). Since it’s still unclear whether E1b1b evolved in Northeast Africa or the Near East, we were deciding against attempting to conclude whether the two haplogroups provide information about different paternal origin information in our three samples. For our phenotypic analysis, we investigated a set of SNPs thought to be affected by selection in our samples. Only high-quality (q > 30) bases were counted. We were able to find derived alleles for the genes SLC24A5 (rs1426654), which are known to be responsible for lighter skin pigmentation in JK2888 and JK2911. Our further tests whether the genes SLC45A2 (rs16891982), LCT (rs4988235), EDAR (rs3827760) and HERC2 (rs12913832) revealed no derived alleles for both JK2888 and JK2911. For JK2134, no sufficient coverage after quality filtering was given at the specific sites, which is why the analysis revealed no further clues (see Supplementary Table 6 for details). LCT is responsible for lactase persistence in Europe (81, 82). The SNPs at SLC24A5 and SLC45A2 are responsible for lighter skin pigmentation (83). The SNP at EDAR affects tooth morphology and hair thickness (84, 85). The SNP at HERC2 is the primary determinant of light eye colour in present-day Europeans (86, 87). |
|


 samples (JK2134 and JK2911) belong to Y-DNA haplogroup J, which is common in the Middle East, and one sample (JK2888) has haplogroup E1b1b1, which is essentially an African haplogroup. Overall, the ancient Egyptian samples showed certain genetic affinities with modern-day East Africans such as Ethiopians and the ancient Egyptians may have originated from the Horn of Africa.