|
|
Post by Admin on Sept 23, 2021 20:48:31 GMT
Table 2 Summary of mapping, screening, sex determination, and haplotyping
Sample	Funadomari 5	Funadomari 23
Total paired reads (n)	476105876	2701697314
Paired-mapped reads with mapq >= 30 (n)	227587497	1897051428
(%)	47.8%	70.2%
Final reads for statistical analysis (n) *1	125592485	1324784403
Mitochondrial DNA haplogroup	N9b1	N9b1
Sex determination	Male	Female
Chromosome Y haplogroup	D1b2b	—
Chromosome X contamination estimates (%)	0.37–0.63	—
Kanzawa-Kiriyama et al. (2017) mitohondrial DNA contamination estimates (%)	0.00–0.61	0.15–0.47
Schmutzi mitochondrial DNA contamination estimates (%)	0 (0.0–0.5)	0 (0.0–0.5)
*  1: Total reads after all filtering (read length, PCR deplicates, soft-clipping and hard-clipping, realignment and recalibration).
Next, we estimated the error rates in Funadomari Jomon genome sequences. While the error rates of the F23 and F5 were 0.506% and 0.676% over all sites, respectively, the error rates in the transversion sites were only 0.023–0.038% and 0.018–0.035%, respectively (Supplementary Figure 4). F23 had high coverage, and the effects of the errors on genotype calling were negligible. We also found more transitional substitutions (A/G or C/T) in the Funadomari Jomon than in other modern humans, which appeared to be caused by postmortem changes (cytosine deamination) characteristic of ancient DNA. Treatment with uracil DNA glycosylase (UDG), which cleaves the deaminated cytosines and drives down the rate of ancient DNA error, was not performed in the current study so as to minimize the risk of contamination by reducing the experimental steps, to observe the deamination for proving the authenticity, and to use only damaged reads if the libraries had a large amount of contaminants, as Meyer et al. (2014) conducted. Contamination frequencies were less than 1% in both F5 and F23 (0.25% and 0.38%, respectively; Table 2 and Supplementary Table 3).
The postmortem changes affected genotyping quality for both single-sample genotyping and joint genotyping. Our filtering criteria filtered heterozygous sites on C/T and G/A that deviated from the binomial distribution (Supplementary Figure 5) and on high-depth sites (Supplementary Figure 6), and stabilized the depth distribution on C/T and G/A genotype calls (Supplementary Figure 7) and the transition/transversion ratio (Ts/Tv) of F23 and other ancient data (Supplementary Figure 8).
|
|
|
|
Post by Admin on Sept 24, 2021 0:32:16 GMT
Next, we estimated the error rates in Funadomari Jomon genome sequences. While the error rates of the F23 and F5 were 0.506% and 0.676% over all sites, respectively, the error rates in the transversion sites were only 0.023–0.038% and 0.018–0.035%, respectively (Supplementary Figure 4). F23 had high coverage, and the effects of the errors on genotype calling were negligible. We also found more transitional substitutions (A/G or C/T) in the Funadomari Jomon than in other modern humans, which appeared to be caused by postmortem changes (cytosine deamination) characteristic of ancient DNA. Treatment with uracil DNA glycosylase (UDG), which cleaves the deaminated cytosines and drives down the rate of ancient DNA error, was not performed in the current study so as to minimize the risk of contamination by reducing the experimental steps, to observe the deamination for proving the authenticity, and to use only damaged reads if the libraries had a large amount of contaminants, as Meyer et al. (2014) conducted. Contamination frequencies were less than 1% in both F5 and F23 (0.25% and 0.38%, respectively; Table 2 and Supplementary Table 3). The postmortem changes affected genotyping quality for both single-sample genotyping and joint genotyping. Our filtering criteria filtered heterozygous sites on C/T and G/A that deviated from the binomial distribution (Supplementary Figure 5) and on high-depth sites (Supplementary Figure 6), and stabilized the depth distribution on C/T and G/A genotype calls (Supplementary Figure 7) and the transition/transversion ratio (Ts/Tv) of F23 and other ancient data (Supplementary Figure 8). mtDNA and Y chromosome haplogroups in Funadomari Jomons We determined complete mitochondrial genome sequences of F5 and F23 and concluded that the mtDNA haplogroups of both individuals were N9b1. The results are consistent with those of Adachi et al. (2011), which classified the mtDNA haplogroups of F5 and F23 as N9b1 with amplified product-length polymorphism analysis and the sequencing of the hypervariable region. However, they were not classified into N9b1 subhaplogroups (N9b1a, N9b1b, or N9b1c) according to phylotree.org. Although F5 and F23 shared a particular mutation (T4047C), F23 alone had the individual specific mutation, C16234T (Supplementary Table 4), suggesting that F5 and F23 did not have the same maternal lineage. Moreover, F5 appeared to have heteroplasmy at position 16319, because 28% of the total reads covering the SNP site had the derived allele G16319A. The frequency is much higher than the contamination frequency of F5, and we concluded that the reads were authentic, and not contaminants. The Y chromosome of F5 belonged to haplogroup D1b2 (Supplementary Table 5). F5 had not only two of the eight D1b2a-specific mutations but also one D1b2b-specific mutation. Mutations characterizing D1b2a subhaplogroups (D1b2a1 and D1b2a2) were not observed. To clarify the phylogenetic position of F5 within the D1b2 lineage, we constructed a maximum likelihood tree using the Y chromosomes of F5 and 1233 modern human males. F5 was located in haplogroup D1b2 and clustered with NA19004 (a modern Japanese individual), who belonged to D1b2b (Figure 5). NA19004 shared some D1b2a-specific mutations with F5, indicating that some of the SNPs characterizing D1b2a may be shared between D1b2a and D1b2b. Therefore, we concluded that F5 belonged to D1b2b (Table 2). 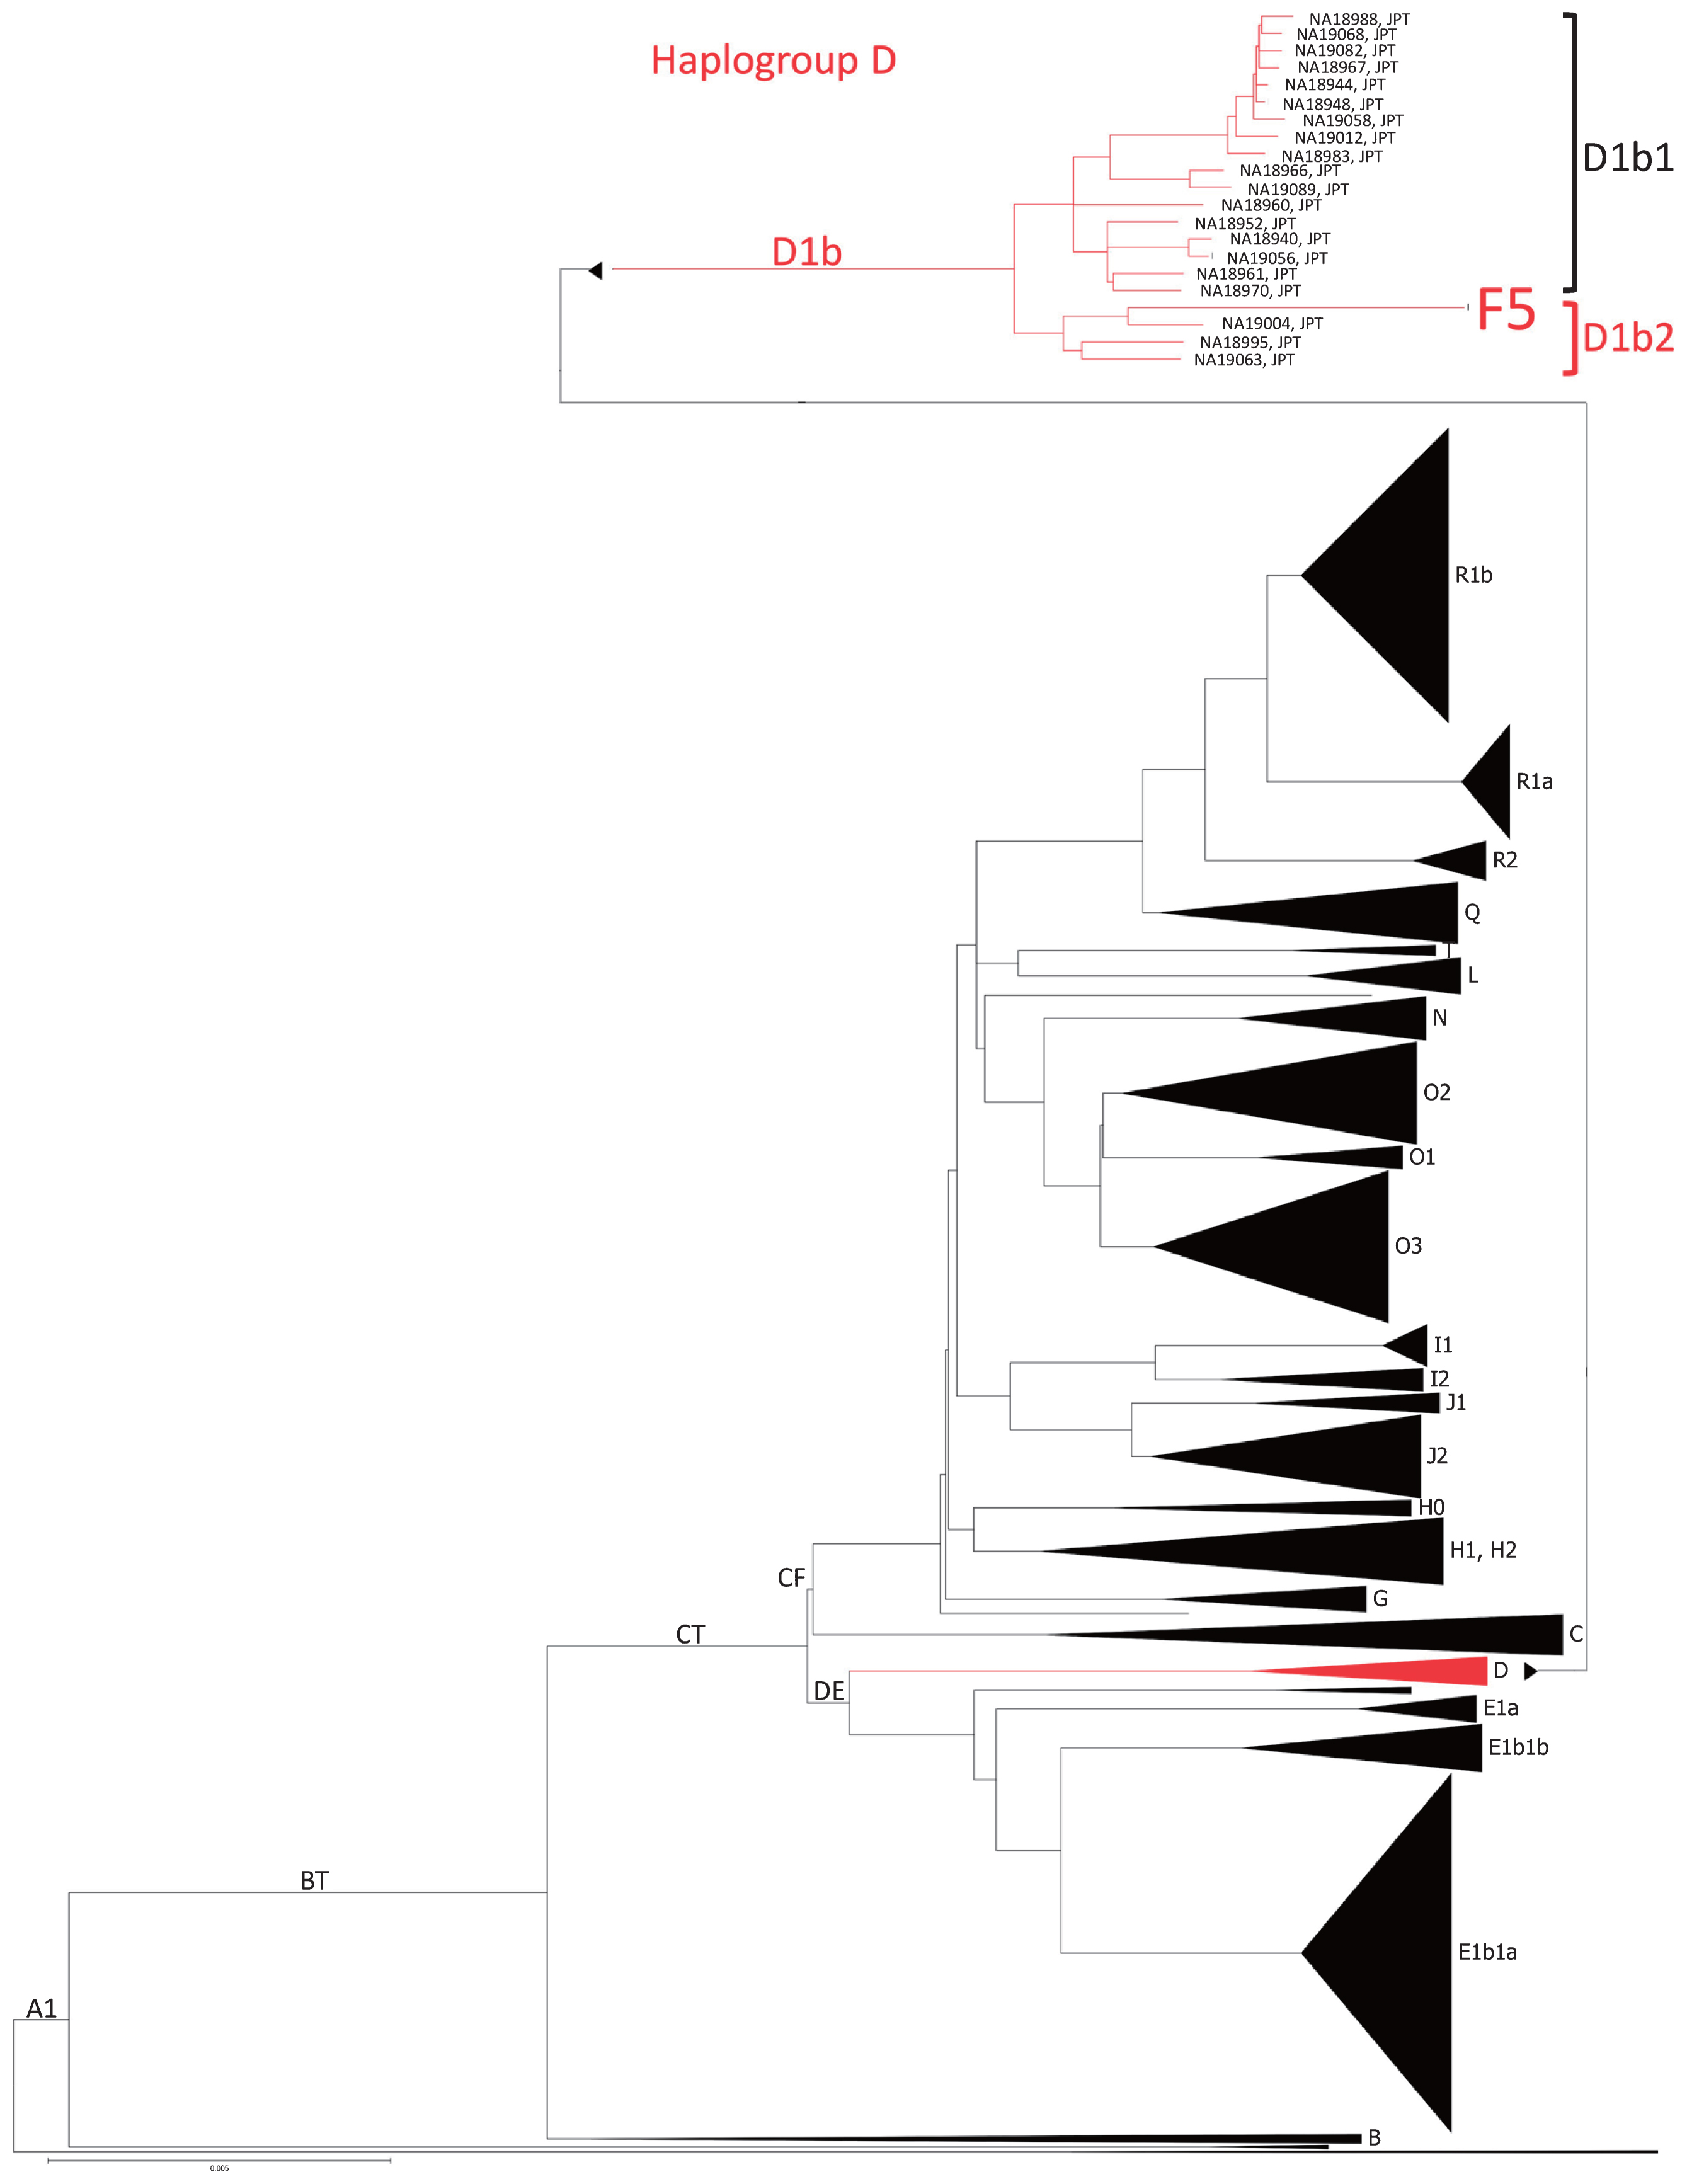 Figure 5 Maximum likelihood tree of the Y chromosome and haplogroup distributions of F5 and 1000 Genome Project individuals. Major haplogroups are shown as black triangles, and the tree of haplogroup D was expanded to the individual level. HLA haplotypes of F23 The top two highest read coverages of alleles at HLA class I classic loci in F23 estimated by VBseq were HLA-A*23:17 (coverage: 3.07) and HLA-A*24:02:01:01 (33.55), HLA-B*15:04:01:01 (10.11) and HLA-B*15:01:01:01 (15.48), and HLA-C*03:03:28 (4.98) and C*03:03:01:01 (30.46), respectively. The coverages of depth of HLA-A and HLA-C are near to the average depth of the entire genome, and it is considered that the two loci were homozygous. After realignment of misaligned reads among HLA-B and HLA-C, the HLA-B genotype was determined as HLA-B*15:01:01:01 homozygous. Thus, the HLA class I genotypes of F23 were HLA-A*24:02:01/A*24:02:01, B*15:01:01/B*15:01:01, and C*03:03:01/C*03:03:01. Genotypes of HLA class II genes could not be determined because insufficient reads were mapped to those genes. HLA-A*24:02 is widely observed in world populations and is one of the most common HLA haplotypes in Taiwan populations and Southeast Asians. Three Japanese populations (Ainu, Mainland Japanese, and Ryukyuan) also have this haplotype at high frequencies (24.0%, 32.7%, and 33.5%, respectively) (Bannai et al., 2000; Allele Frequencies Website, www.allelefrequencies.net/pop6001c.asp?pop_id=2032). The most frequent HLA-A*24:02 haplotype in Ryukyuan is A*24:02:01, which is the same as that of F23 and is not frequently observed in other East Asians (Supplementary Figure 9a). The B*15:01 allele is not frequent compared with A*24:02 in modern humans, but was observed in Ainu at a high frequency (29%, Supplementary Figure 9b) (Bannai et al., 2000). The C*03:03 allele is not widespread, but more than 10% of coastal East Asians (Nivkhi, Mainland Japanese, Koreans, and Taiwan populations) and Papuans have this allele (Supplementary Figure 9c). Nakaoka et al. (2013) reported that C*03:03 is more frequently observed in Ryukyuan than in Mainland Japanese and is associated with the population substructure in Japanese populations. Nakajima et al. (2001) reported 3-locus HLA haplotypes with haplotype frequencies (HF) ≥0.5% in modern Japanese, and the haplotype of F23 was not listed in this report, suggesting that the haplotype is rare in modern Japanese populations. Phenotypic inference of F23 We inferred 12 phenotypic traits in F23 that were validated in East Asians and were considered important to anthropological studies (Table 3, Supplementary Table 6). Six other traits observed in non-East Asians were also listed in Supplementary Table 6. Her ABO and Rh blood types were Ax02/O02 or O65 (AO) and DcE/DcE (RhD+), respectively. From the homozygous genotypes of rs3827760 (T/T) and rs10177996 (T/T) (Kimura et al., 2009), we estimated that her level of shovel-shaped incisors was slight, and tooth crown sizes were medium, consistent with the previously reported features of the Jomon people. Unfortunately, we could not verify the results of these nonmetric dental traits because of the absence of her incisors and the presence of occlusal wear of the tooth crown. Her hair thickness was inferred to be thin. The wet-type earwax of F23 (based on existence of G allele in rs17822931; Yoshiura et al., 2006) was concordant with the results showing that the frequency of the wet-type allele in the Jomon/Epi-Jomon people was higher than that in other Northeastern Asian populations (Sato et al., 2009b). Alcohol tolerance was high (variants: 47Arg in ADH1-B and 504Glu in ALDH2), and skin and iris colors were classified as moderately dark (variants: 163Arg in MC1R and His615Arg heterozygous in OCA2) and medium (His615Arg heterozygous in OCA2), respectively. The genotype score for height was moderately low (Z = −0.995), suggesting that the F23 female had a short stature compared with modern East Asians. The two amino acid change variants (92Met and 163Arg) in the MC1R gene (Motokawa et al., 2007) and three variants in the promoter region (−490C, −445G, and −226A) (Motokawa et al., 2008) were associated with an elevated risk of developing freckles and severe solar lentigines. For F23, we performed genotype calling of the Val92Met variant visually with IGV software since we failed to genotype the position using GATK because of the effects of postmortem changes (QUAL = 26.24, G = 44, A = 4, N = 2) and obtained a G/G genotype. F23 was homozygous for all five variant sites, and three risk variants were observed (163Arg, −445G, and −226A), suggesting that F23 was rather susceptible to freckles and solar lentigines. However, the association between freckling and 163Arg was not significant in a report by Yamaguchi et al. (2012). Thus, further association studies are needed to determine the risks of freckles and solar lentigines in F23. |
|
|
|
Post by Admin on Sept 24, 2021 4:36:31 GMT
Table 3 Inferred phenotypes of F23
Trait	Gene	SNP	Chromosome	Position (GRCh 37)	Genotype	Inferred phenotype	Reference
ABO blood type	ABO	—	9	—	Ax02/O02 or Ax02/O65	A
Rh blood type	RHD	—	1	—	D/D	D
RHCE	—	1	—	cE/cE	cE
Shovel-shaped incisors	EDAR	rs3827760	2	109513601	T/T	Slight	Kimura et al. (2009)
Tooth crown size	EDAR	rs3827760	2	109513601	T/T	Medium	Kimura et al. (2009)
WNT10A	rs10177996	2	219746561	T/T		Kimura et al. (2015)
Hair thickness	EDAR	rs3827760	2	109513601	T/T	Thin	Fujimoto et al. (2008)
Earwax	ABCC11	rs17822931	16	48258198	G/G or G/A	Wet	Yoshiura et al. (2006)
Alcohol tolerance	ADH1B	rs1229984	4	100239319	G/G	High	Edenberg and Bosron (1997)
ALDH2	rs671	12	112241766	G/G		Harada et al. (1981)
Skin lightness	OCA2	rs1800414	15	28197037	C/T	Moderately dark	Yang et al. (2016)
MC1R	rs885479	16	89986154	G/G		Yamaguchi et al. (2012)
Freckles	MC1R	rs2228479	16	89985940	G/G or G/A	ND	Yamaguchi et al. (2012)
Solar lentigines	MC1R	rs2228479	16	89985940	G/G or G/A	Moderately high risk	Motokawa et al. (2007)
MC1R	rs885479	16	89986154	G/G
Iris color (a*)	OCA2	rs1800414	15	28197037	C/T	Medium	Rawofi et al. (2017)
 (b*)	OCA2	rs1800414	15	28197037	C/T	Medium

ClinVar entries based on a pathogenic variant search revealed three pathogenic rare amino acid substitutions in CPT1A (NM_001031847:exon12:c.C1436T:p.P479L, NM_001876:exon12:c.C1436T:p.P479L) for carnitine palmitoyltransferase I deficiency, MYH7 (NM_000257:exon35:c. G4985A:p.R1662H) for distal myopathy and primary dilated cardiomyopathy, and PRODH (NM_001195226:exon11: c.T998C:p.L333P, NM_016335:exon12:c.T1322C:p. L441P) for proline dehydrogenase deficiency and schizophrenia (Table 4). The genotype of the CPT1A variant was homozygous, and those of the others were heterozygous. The PROVEAN scores of variants in CPT1A and PRODH were −8.25 and −6.35, respectively. The CADD scores of p.P479L in CPT1 and p.L333P/p.L441P in PRODH were 5.551 and 5.258, respectively, which were greater than the median of those of known pathogenic variants (3.498) (Mather et al., 2016).

Table 4 ClinVar pathogenic variants of F23
Chromosome	SNP position	rsID	Reference	Alternative	Depth	Allelic depth	Genotype	Gene	Substitution type	Amino acid change	Variant disease name	Alternative allele frequency
2kjpn	1000 genomes	ExAC AFR	ExAC AMR	ExAC EAS	ExAC FIN	ExAC NFE	ExAC SAS	ExAC OTH
11	68548130	rs80356779	G	A	72	0, 72	A/A	CPT1A	nonsynonymous	exon12:c.C1436T:p.P479L	Carnitine palmitoyltransferase I (CPT1) deficiency	.	.	0	8.7E-05	0	0	1.5E-05	0	0
14	23885010	rs370328209	C	T	54	24, 30	C/T	MYH7	nonsynonymous	exon35:c.G4985A:p.R1662H	Myopathy, primary dilated cardiomyopathy	.	.	9.6E-05	8.7E-05	0.0001	0	6.0E-05	0	0
22	18905934	rs2904551	A	G	25	19, 6	A/G	PRODH	nonsynonymous	exon11:c.T998C:p.L333P, exon12:c.T1322C:p.L441P	Proline dehydrogenase deficiency, schizophrenia	0.0022	0.0066	0.0078	0.0079	0.0081	0.0043	0.0049	0.0059	0.0011
2kjpn, whole-genome sequences of 2049 healthy Japanese individuals and construction of the highly accurate Japanese population reference panel; ExAC, Exome Aggregation Consortium; AFR, African/African American; AMR, American; EAS, East Asian; FIN, Finnish; NFE, non-Finnish European; SAS, South Asian; OTH, other.
Genomic features of F23 Heterozygosity and HBD are measures to infer the genetic diversity of diploid organisms. F23 had a low heterozygosity and a high HBD compared with other SGDP individuals (Supplementary Figure 10), indicating that F23 had a low genetic diversity, although she was located within the range of modern humans. We also assessed the extent of inbreeding and consanguinity from the length distribution of HBD. Some modern human populations exhibit increased levels of inbreeding in populations where consanguineous marriage practices are encouraged or in geographically isolated hunter-gatherer groups, such as those from the Amazon rainforest region (Sikora et al., 2017). Patterns of HBD among Upper Paleolithic individuals are consistent with randomly mating populations of moderate effective size (Ne~200), which suggests that close consanguineous mating was avoided (Sikora et al., 2017). For F23, we identified 1570 HBD tracks longer than 0.1 cM (Supplementary Table 7), and the sum of HBD was 885.72 cM, which was similar to the levels of Native Americans (Surui and Karitiana) and was much higher than that of most modern individuals (Figure 6a, Supplementary Table 8). However, the number of HBD fractions between 2.5 and 10 cM and longer than 10 cM was much smaller than those of Native Americans and Altai Neanderthal, who seemed to have experienced mating among close relatives (Prüfer et al., 2014), and many small HBD segments were instead observed over the genomes (Figure 6b, c). We simulated random mating in small effective population sizes to determine the length distributions of the HBD and the numbers of long (>10 cM) HBD tracks and compared them with the results from F23. The total length of HBD tracts was much longer than that of simulated data, which may be because of the small population size in northern Jomon populations, whereas the number of HBD tracks longer than 10 cM was mostly the same as that of simulated data (Supplementary Table 9); these data do not support consanguineous marriage for F23. 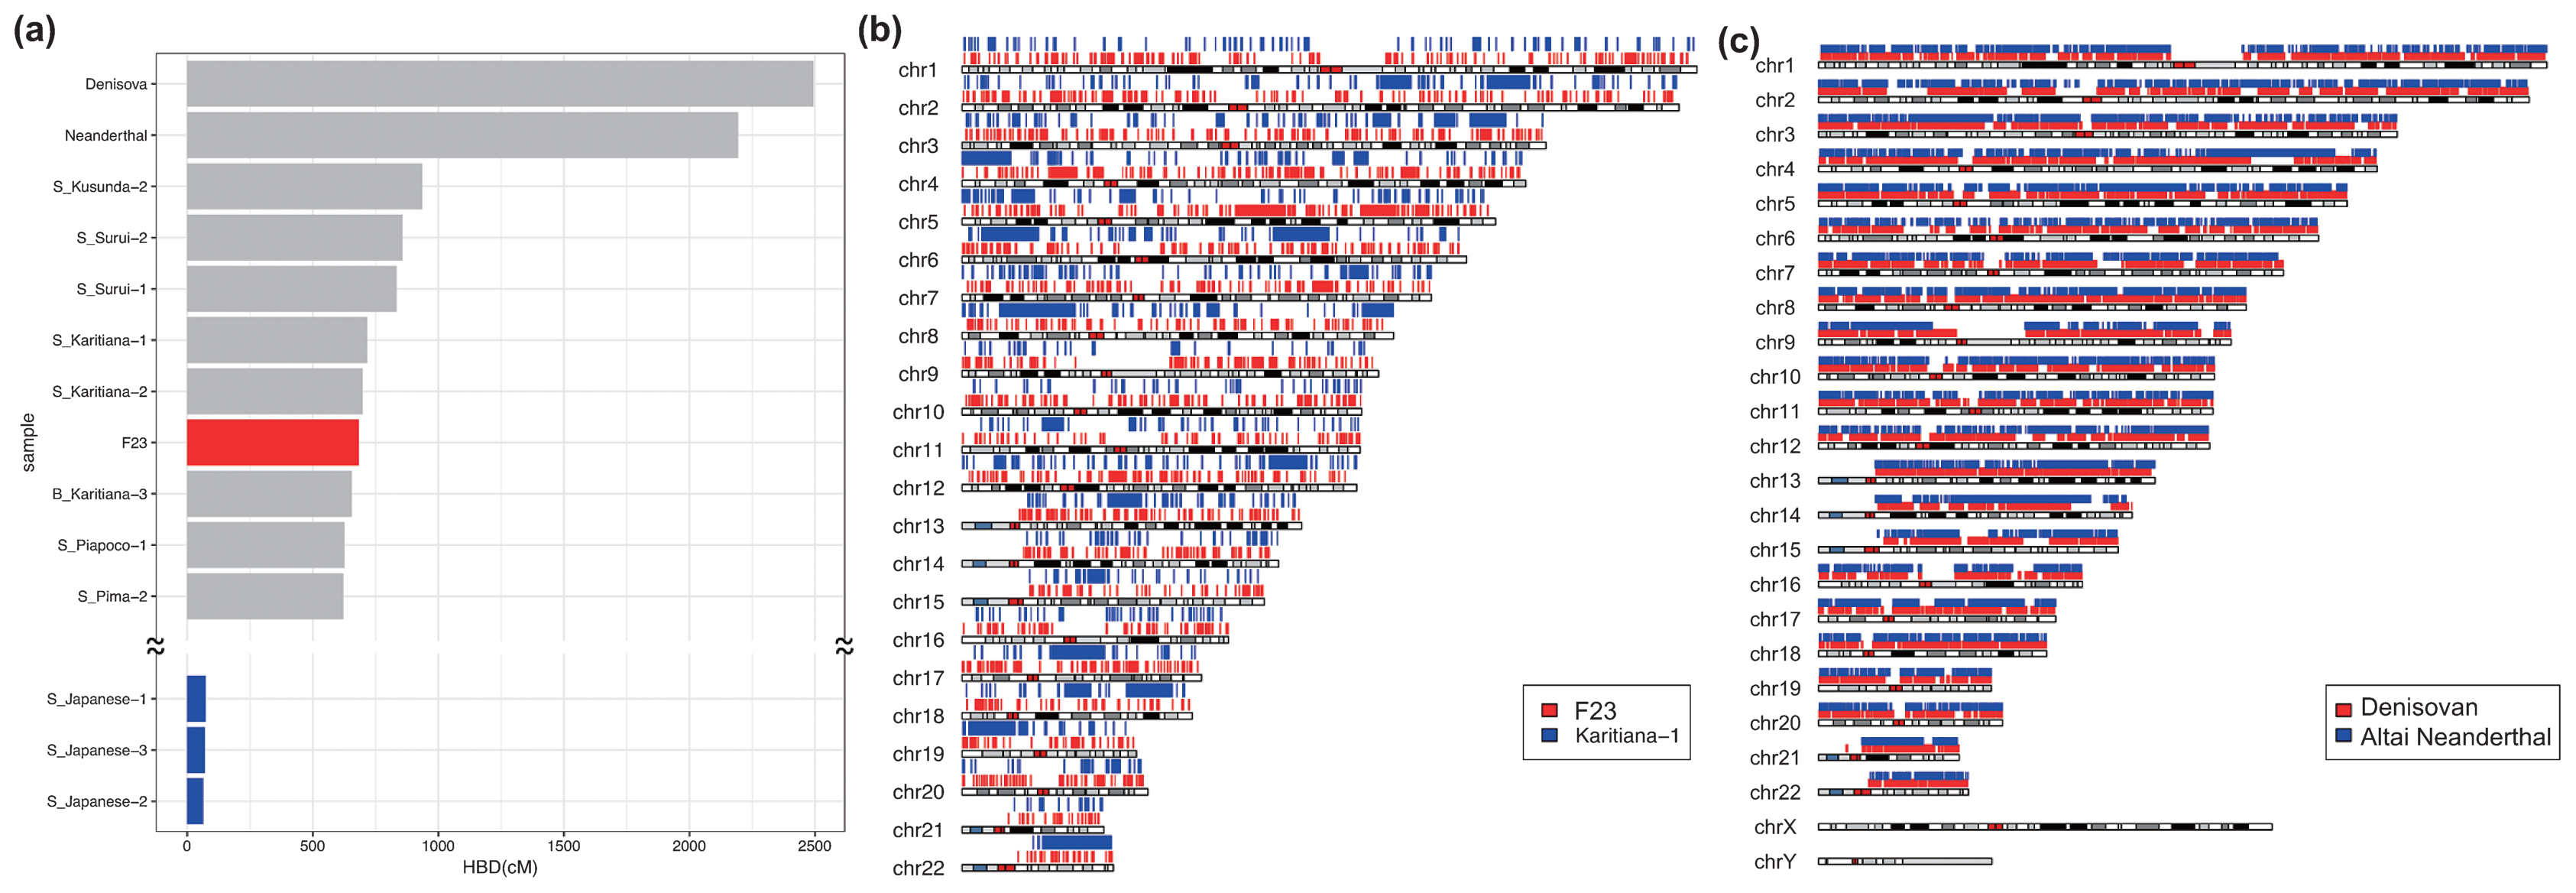 Figure 6 Homozygousity by descent (HBD) of F23, archaic, and modern humans. (a) Total HBD lengths of F23, SGDP modern humans, and two archaic individuals. Mapping of HBD segments across the genomes in (b) F23 and Karitiana-1 and in (c) Denisovan and Altai Neanderthal. Next, we estimated long-term effective population size (Ne) changes and divergence times using the MSMC program. For F23, Ne up to 10000 YBP could be estimated because only two haplotypes were available, and the date of F23 (3500–3800 YBP) should be added compared with that of modern humans. F23 showed Ne patterns similar to those of other out-of-Africa populations up to 50000 YBP (Figure 7a). After that point, F23 Ne continued to decrease, whereas European and East Asian Ne started to increase. We also estimated the average divergence times between F23 and worldwide populations. Figure 7b, c shows the relative cross-coalescence rate (RCCR) over time for each pair of populations. If the population pairs had not diverged (i.e. belonged to the same ancestral population), the RCCR value would be close to 1. Conversely, when the population pairs had completely diverged, RCCR would be 0. The actual process of population divergence can span several thousand years; however, for simplicity, we will focus on the mid-point of population divergence (RCCR 0.5). The F23–French and Han–French divergences were quite similar, approximately 40000 YBP. This was fairly consistent with previous ancient genome studies (Seguin-Orlando et al., 2014; Yang et al., 2017). The divergence time between F23 and Han was estimated to be 18000–38000 YBP. Caution is advised when interpreting population divergences because they are only an approximation and may vary when different individuals and/or filtering methods are used. 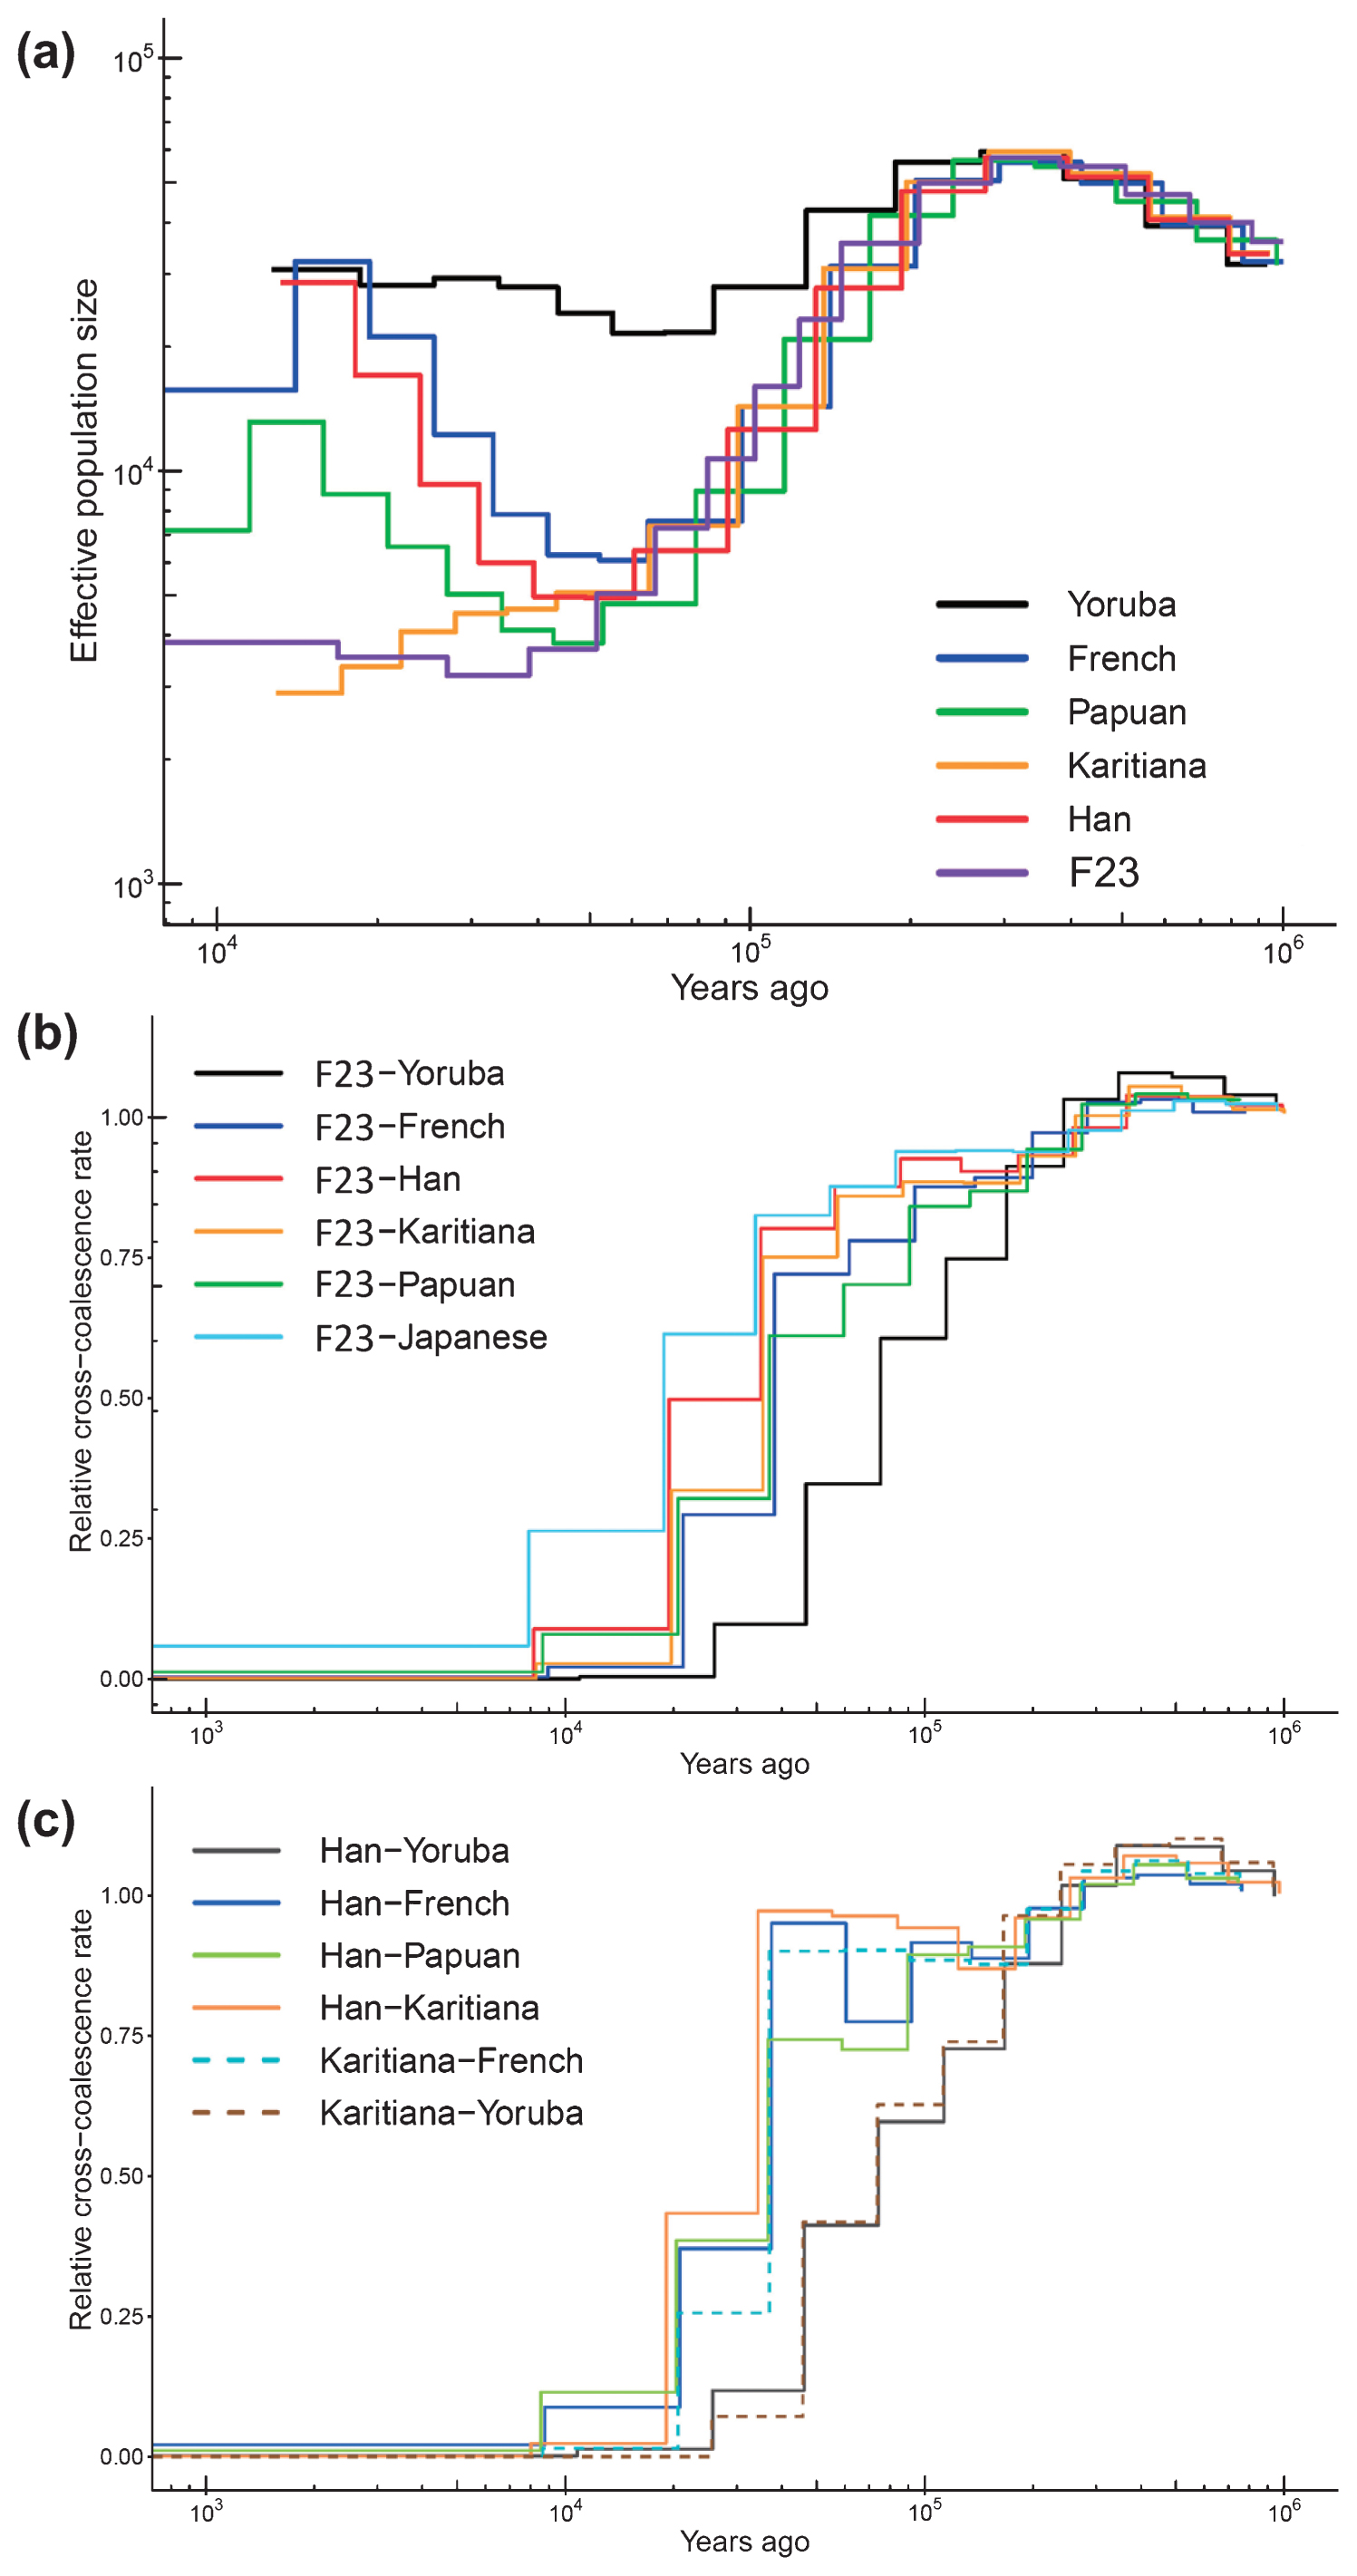 Figure 7 Effective population size and divergence time. (a) Estimated changes in historical effective population size. The estimates were based on MSMC analysis of F23 and five modern human genomes. Estimated divergence time (b) between F23 and worldwide populations and (c) among modern populations. |
|
|
|
Post by Admin on Sept 24, 2021 20:04:59 GMT
Genetic uniqueness of Funadomari Jomons When worldwide populations were compared with F23 using PCA, Funadomari Jomons were closer to East Eurasians than to Africans, Europeans, Sahulians, and Native Americans (Figure 8a), consistent with the previously reported Sanganji Jomon genome (Kanzawa-Kiriyama et al., 2017). Next, comparison with East Asians showed that Funadomari Jomons were distinct from other modern East Eurasians. Modern Japanese individuals were situated between Jomons (Funadomari, Sanganji, and Ikawazu) and continental Northeast Eurasians (CHB, Naxi, and Yi; Figure 8b). The four Jomon individuals clustered tightly. 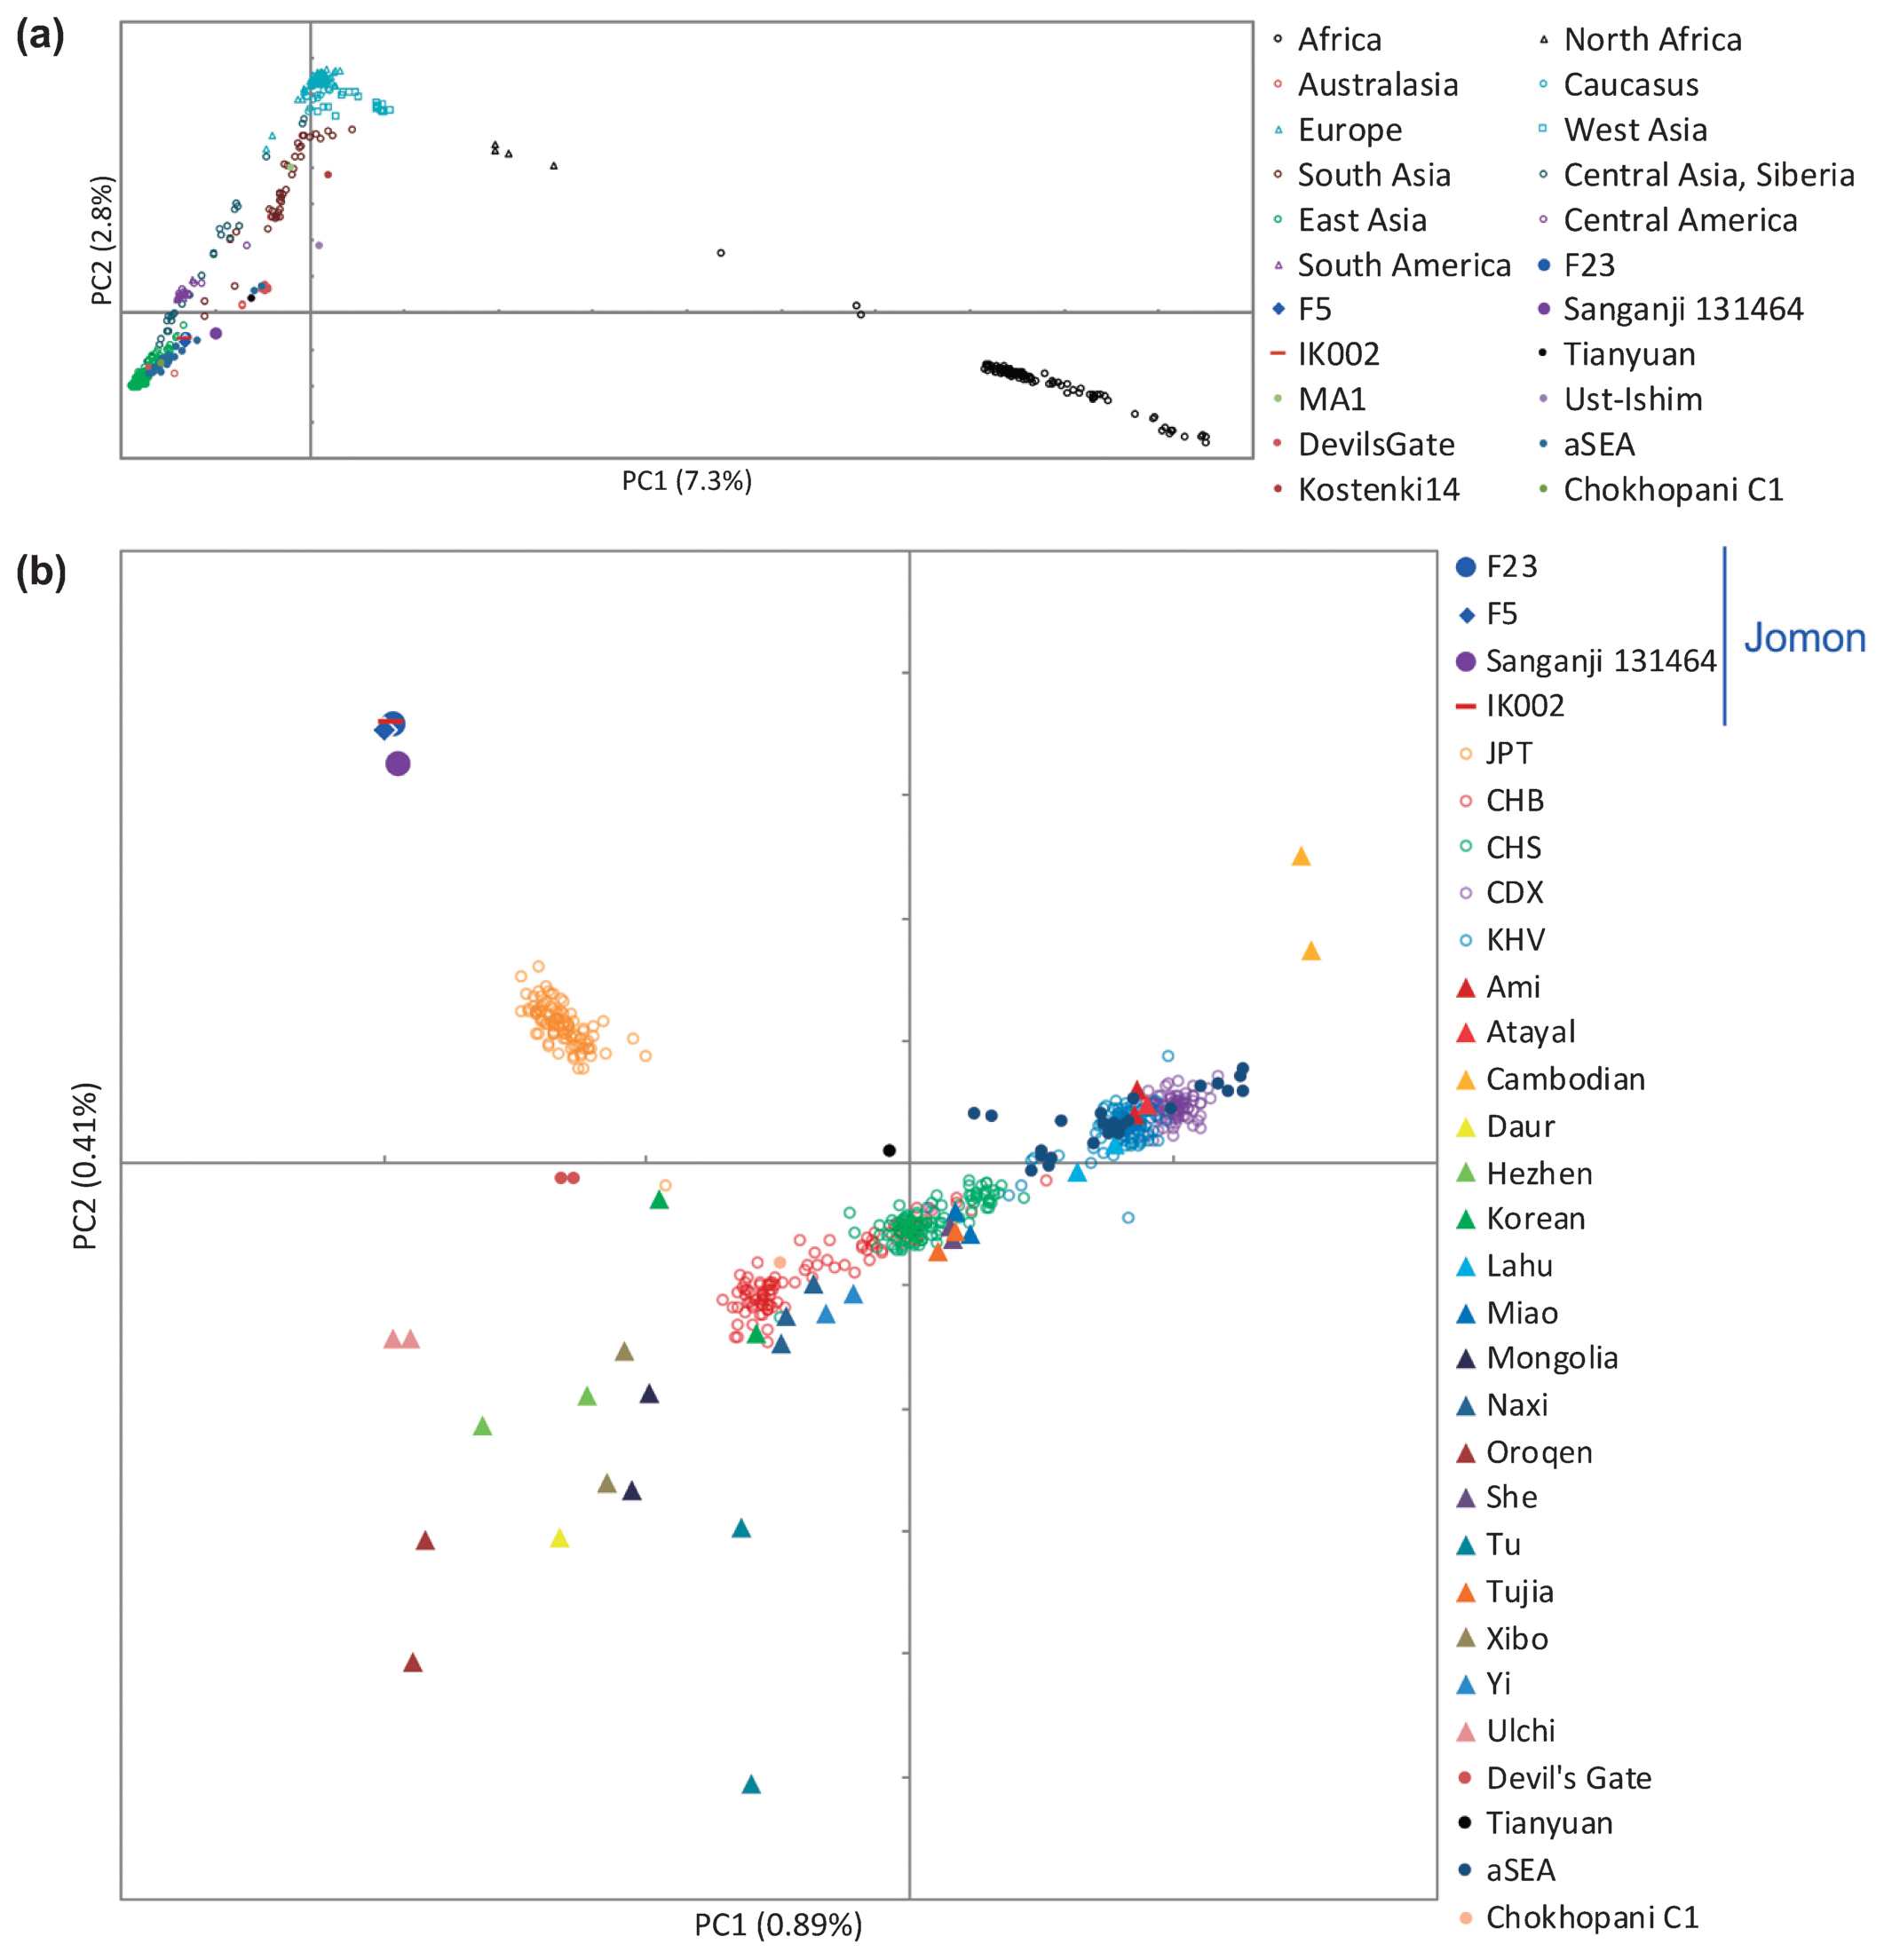 Figure 8 Principal component analysis. About 450000 SNPs are shared among all four Jomon individuals. (a) Funadomari Jomon, Ikawazu Jomon, Sanganji Jomon, Devil’s Gate, Tianyuan, ancient Southeast Asians (aSEA), MA1, Ust-Ishim, SGDP, and 1000 Genomes Project worldwide humans. (b) Funadomari Jomon, Ikawazu Jomon, Sanganji Jomon, Devil’s Gate, Tianyuan, ancient Southeast Asians (aSEA), SGDP, and 1000 Genomes Project East Asians. We then investigated the phylogenetic relationships between F23 and modern and other ancient human populations using pairwise Fst distances with the neighbor-joining method (Supplementary Figure 11). After the split with Papuans, F23 appeared basal to other South and East Asians, including Native Americans, consistent with the previous observation in Sanganji Jomon (Kanzawa-Kiriyama et al., 2017). Next, we used TreeMix for tree reconstruction with migration events. When one migration event was assumed, F23 diverged before the split of modern East Eurasians and Native Americans, after the separation of 40000 year old Tianyuan (Figure 9a and Supplementary Figure 12). The migration event from 24000 year old Mal’ta MA1 in south-central Siberia to the ancestor of Native Americans and Northeastern Siberians was observed, in agreement with Raghavan et al. (2014). Native Americans initially diverged from modern East Asians c. 36 ± 1.5 ka, with gene flow persisting until c. 25 ± 1.1 ka (Moreno-Mayar et al., 2018), implying that the split time of F23 from other populations was before or around 25000 YBP, which was within the range of divergence time between F23 and Han, i.e. 18000–38000 YBP, as estimated by MSMC analysis. The relative order of the population divergence time is also informative for interpreting whether the split of F23 was earlier than the ancestors of Han and Native Americans. The divergence times of Karitiana–F23 and Karitiana–Han were 39 and 38 kya, respectively, which again supports the older divergence of F23 in East Eurasia, including modern Native Americans (Figure 9a, Supplementary Figure 12) because the divergence time would be the same if the split of Karitiana–Han/F23 was earlier than that of F23–Han. In addition, the deep divergence of F23 was confirmed by f4-statistics. f4 (African, Amerindian; Han, F23) showed strong genetic affinity between Native Americans and Han compared with F23 (Supplementary Table 10), suggesting that the ancestor of Han and Native Americans maintained gene flow even after the ancestor of F23 diverged from these populations. f4 (African, Tianyuan; East Asian, F23) and f4 (African, F23; East Asian, Tianyuan) showed that Tianyuan was located in the outgroup of both Funadomari Jomons and modern East Asians (Supplementary Tables 11 and 12). TreeMix also inferred that modern Japanese carry 15.7% of Northern Jomon ancestry (Supplementary Figure 13), which is consistent with the result (12%) for the Sanganji Jomon genome (Kanzawa-Kiriyama et al., 2017). 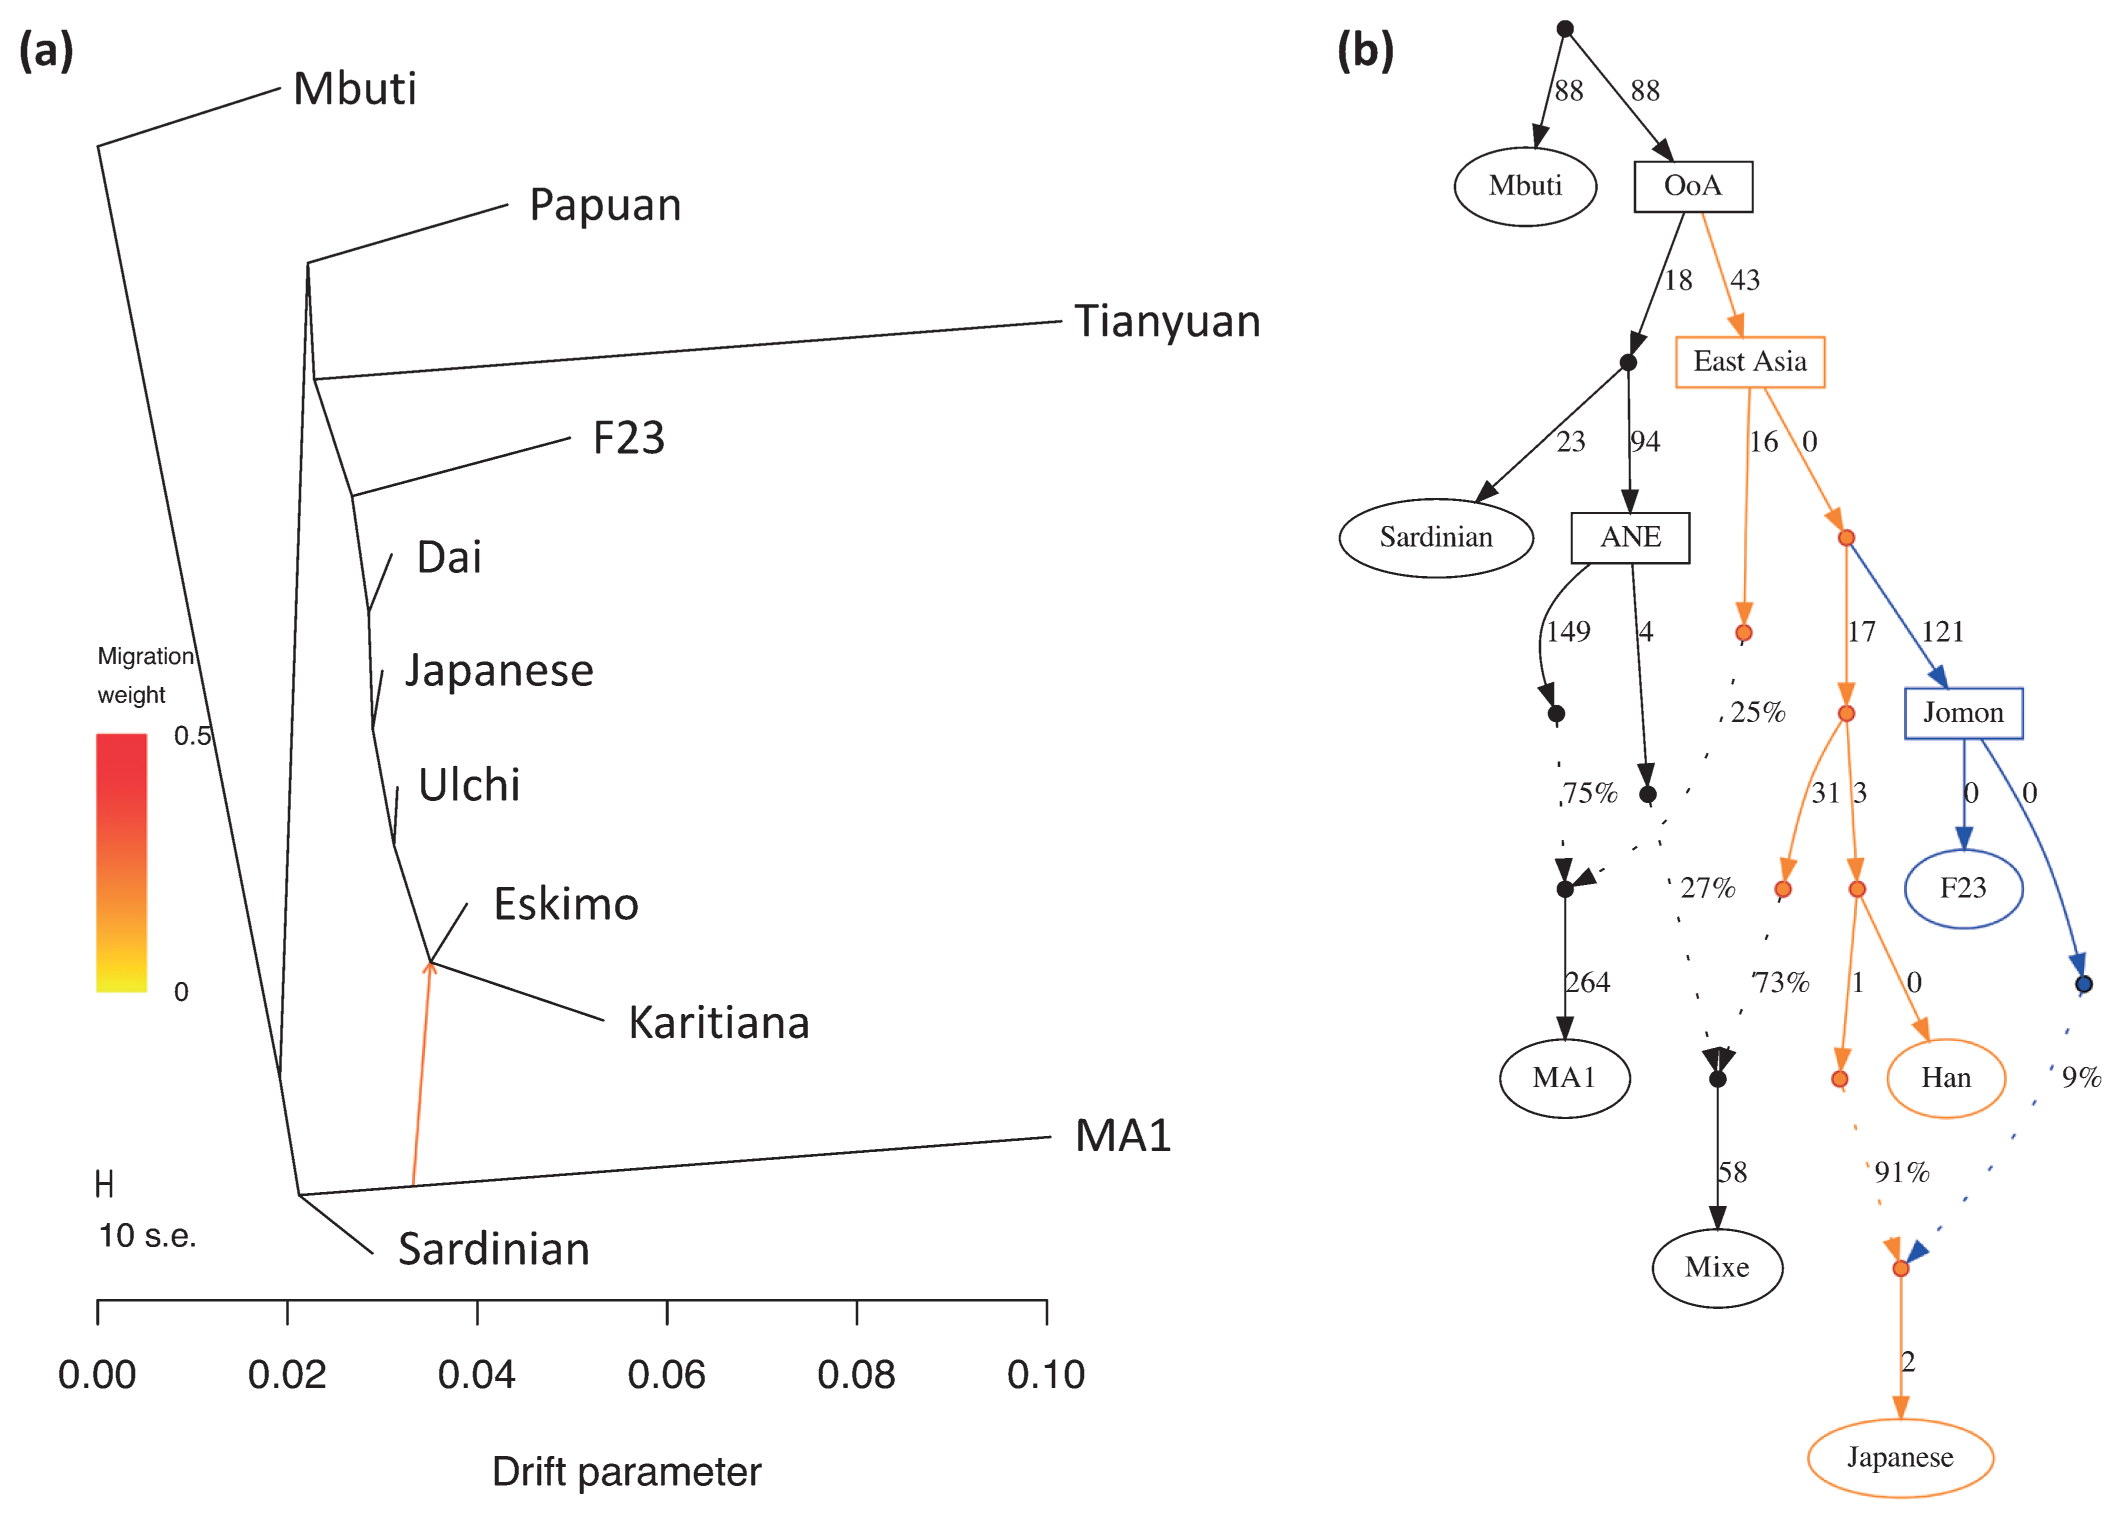 Figure 9 Phylogenetic tree of F23 and modern humans. (a) Maximum likelihood tree of F23, eight SGDP populations (Mbuti, Papuan, Dai, Japanese, Ulchi, Karitiana, Eskimo, and Sardinian), Mal’ta MA1, and Tianyuan. Mbuti was used as the outgroup, and one gene flow event was estimated. Arrows were manually added to this tree, and colors of migration weight (ratio of gene flow) follow TreeMix outputs. (b) Admixture graph model for comparing F23, Han, Native American (Mixe), and Japanese. OoA, out-of-Africa; ANE, ancient North Eurasian. Next, we assessed the possibility of gene flow between non-East Asians and the ancestor of Funadomari Jomons to explain the deep divergence. f4 (African, non-East Asian; East Asian, F23) showed that no modern populations, except for Sardinian, Relli, and Aboriginal Australian, who had small positive f4 values (but without statistical significance), supported the gene flow (Supplementary Table 13). The 24000 year old MA1 also did not support the gene flow (Supplementary Table 14). We also compared Funadomari Jomons with Ust’-Ishim, a 45000 year old Upper Paleolithic individual from Siberia who diverged from the Asian lineage c. 48000 years ago, soon after the initial divergence among Eurasians c. 52500 years ago (Sikora et al., 2017). Our results showed that Ust’-Ishim was equally distant to East Asians and Funadomari Jomons (Supplementary Table 15). The effects of postmortem changes are less likely to explain the deep divergence because the SGDP dataset we used in this analysis included only transversion sites, which had much smaller error rates than transition sites (Supplementary Figure 4). We also considered the possibility of reference bias in F23, but the affinity between the human reference genome (GRCh37) and F23 compared with that of other East Asians was not identified (Supplementary Table 16). Thus, it is more plausible that Funadomari Jomons had deep divergence without any gene flow with outgroups. We then tested models of the phylogenetic relationships among F23 and Eurasians and Native Americans based on F-statistics using qpGraph. We began with the tree of Mbuti, Sardinian, and Han. When 10 different simple or admix tree models were tested to add F23 into the three-population tree, two trees were supported: (1) the simple tree, in which F23 first clustered with Han (Z = 2.073); and (2) the admix tree, in which the admixture of East Eurasian Han (86%) and West Eurasian Sardinian (14%) explained the ancestor of F23 (Z = 0.011). When we used French instead of Sardinian, both the simple tree and the admix tree became the best model (Z = −0.241 for both trees and the proportion of the admixture was 99% and 1% in the admix tree model). Next, we added MA1, Native American Mixe, and Japanese to the simple tree sequentially to verify the earlier split of F23 than Native Americans. We found that the earlier split of F23 was best fit to the model (Z = 2.073; Figure 9b) and that none of the models assuming a later split of F23 was supported. It is also unlikely that the three populations had a star-like phylogeny (|Z| = 8.606–12.691). The earlier split was reproduced, even if gene flow from West Eurasians into F23 was assumed (Supplementary Figure 14). We reproduced the same tree topology and admixture, even when French was used instead of Sardinian (Supplementary Figure 15). |
|
|
|
Post by Admin on Sept 24, 2021 22:11:39 GMT
Genetic affinities to coastal and marine areas of East Asians in Funadomari Jomons We tested F-statistics using both array-based data and genomic data to examine the signature of the admixture event. Outgroup-f3-statistic tests showed that Ulchi, Taiwan aboriginal (Ami and Atayal), Taiwanese (Minnan and Hakka), Korean, Philippine (Igorot, Kankanaey, Illocano, and Urban), modern Japanese (Mainland Japanese and Ryukyuan) populations, and Devil’s Gate 1 and 2 tended to be genetically closer to Funadomari Jomons than to other East Eurasians (Figure 10, Supplementary Figure 16, and Supplementary Tables 17–19). Similarly, we computed f4-statistics and found that Funadomari Jomons shared significantly more alleles with modern Japanese, Ulchi, Korean, Taiwanese, and Urban in the Philippines than with Han Chinese (Z > 3; Supplementary Tables 20–22). The affinity between F23 as well as IK002 and ancient Southeast Asians, Ma911 and La368, as reported by McColl et al. (2018), was also identified (Supplementary Table 23). The affinity between Devil’s Gate and F23, observed in outgroup-f3-statistics, was not supported. Although Tibetan and F5 share the same Y-haplogroup, D, the affinity with F5 in Tibetan compared with other East Asians was not identified. 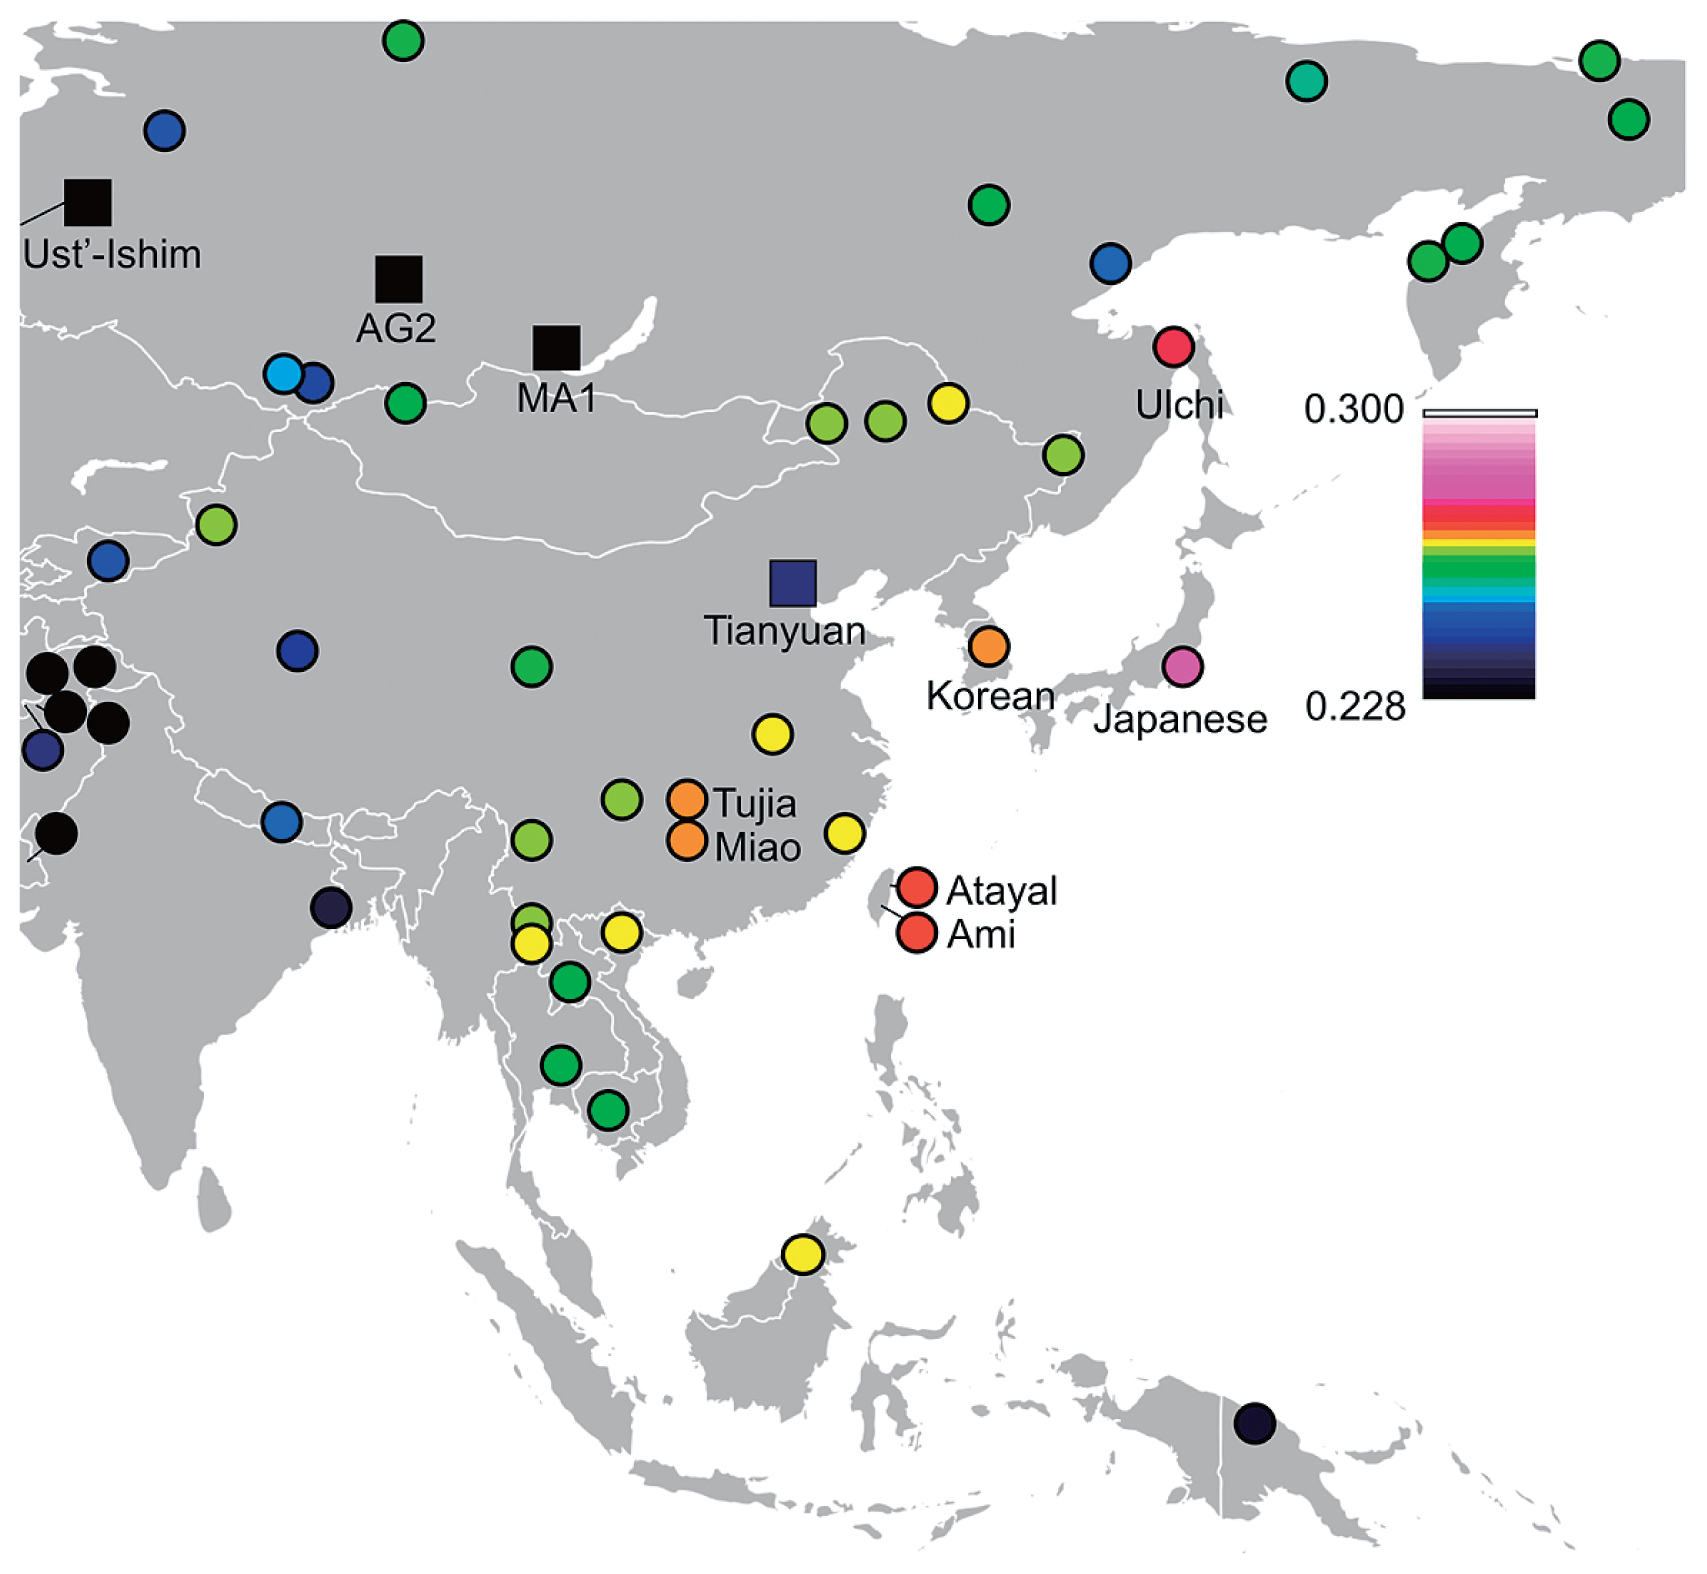 Figure 10 Heat map of outgroup f3-statistics between F23 and Tianyuan, MA1, Ust’-Ishim, and fully public Affymetrix Human Origins present-day individuals. High f3 values indicate high genetic affinity with F23. In contrast, Funadomari Jomons share fewer alleles with many Southeast Asians (e.g. Burmese, Cambodian, and Thai) and some Central and Northeast Asians (Daur, Mongolia, Naxi, Tu, Xibo, Yi, and Sherpa) than with the Han Chinese at significant level (Z < −3), although Funadomari Jomons formed a phylogenetic outgroup of these Asian populations. The reduced allele sharing was important for detecting ancient gene flow from outgroups into Asians and investigating Neolithic population structure. Thus, we next tested whether the reduced similarities could be explained by the gene flow between these populations and three outgroups (Papuan, Bengali, and French). Although the reduced similarities with some Northeast Asians could be explained by gene flow with the outgroup genetically close to French because Northeast Asians shares more alleles with French than Han Chinese, gene flow with the three outgroups was not identified in Southeast Asians (Supplementary Tables 24 and 25). We then analyzed shared long haplotypes, i.e. IBD, between F23 and SGDP individuals to identify admixture events. The IBD sharing showed that Mainland Japanese, followed by Ulchi, Hezhen, Korean, Ami, and Atayal, who were geographically closer to the Funadomari site, shared more genomic regions with F23 than the other East Eurasian and Native Americans, which are more or less consistent with the results of PCA and F-statistics (Figure 11a, Supplementary Figure 18, and Supplementary Table 26). The IBD segments were widely distributed in the Japanese genome (Supplementary Figure 19). Analysis of the length distributions of the IBD fragments showed that Japanese and Ulchi had longer IBD segments than other East Asians (Figure 11b), and the cumulative distributions were significantly different from those of other East Eurasians, including Hezhen, Korean, Ami, and Atayal (Figure 11c), suggesting that gene flow between F23 and Japanese/Ulchi occurred more recently than that of the other four populations. We also used phased genome data, which offered more sensitivity to subtle population structure than unphased data, and again observed that F23 shared more chunks of DNA with Japanese, Ulchi, and Korean than with other East Asians (Supplementary Figures 20, 21a, 21b). Intriguingly, we found that F23 shared more haplotypes with Aboriginal Australians than with most East Asians. IBD sharing analysis (Supplementary Table 26) and f4-statistics (Supplementary Table 13) also showed the same patterns, although the signal was weak and not significant (f4 (Mbuti, Australian; Han, F23) = 0.000115, Z = 1.092). Further studies with more northeast and southwest Jomon genomes are needed to verify this affinity. 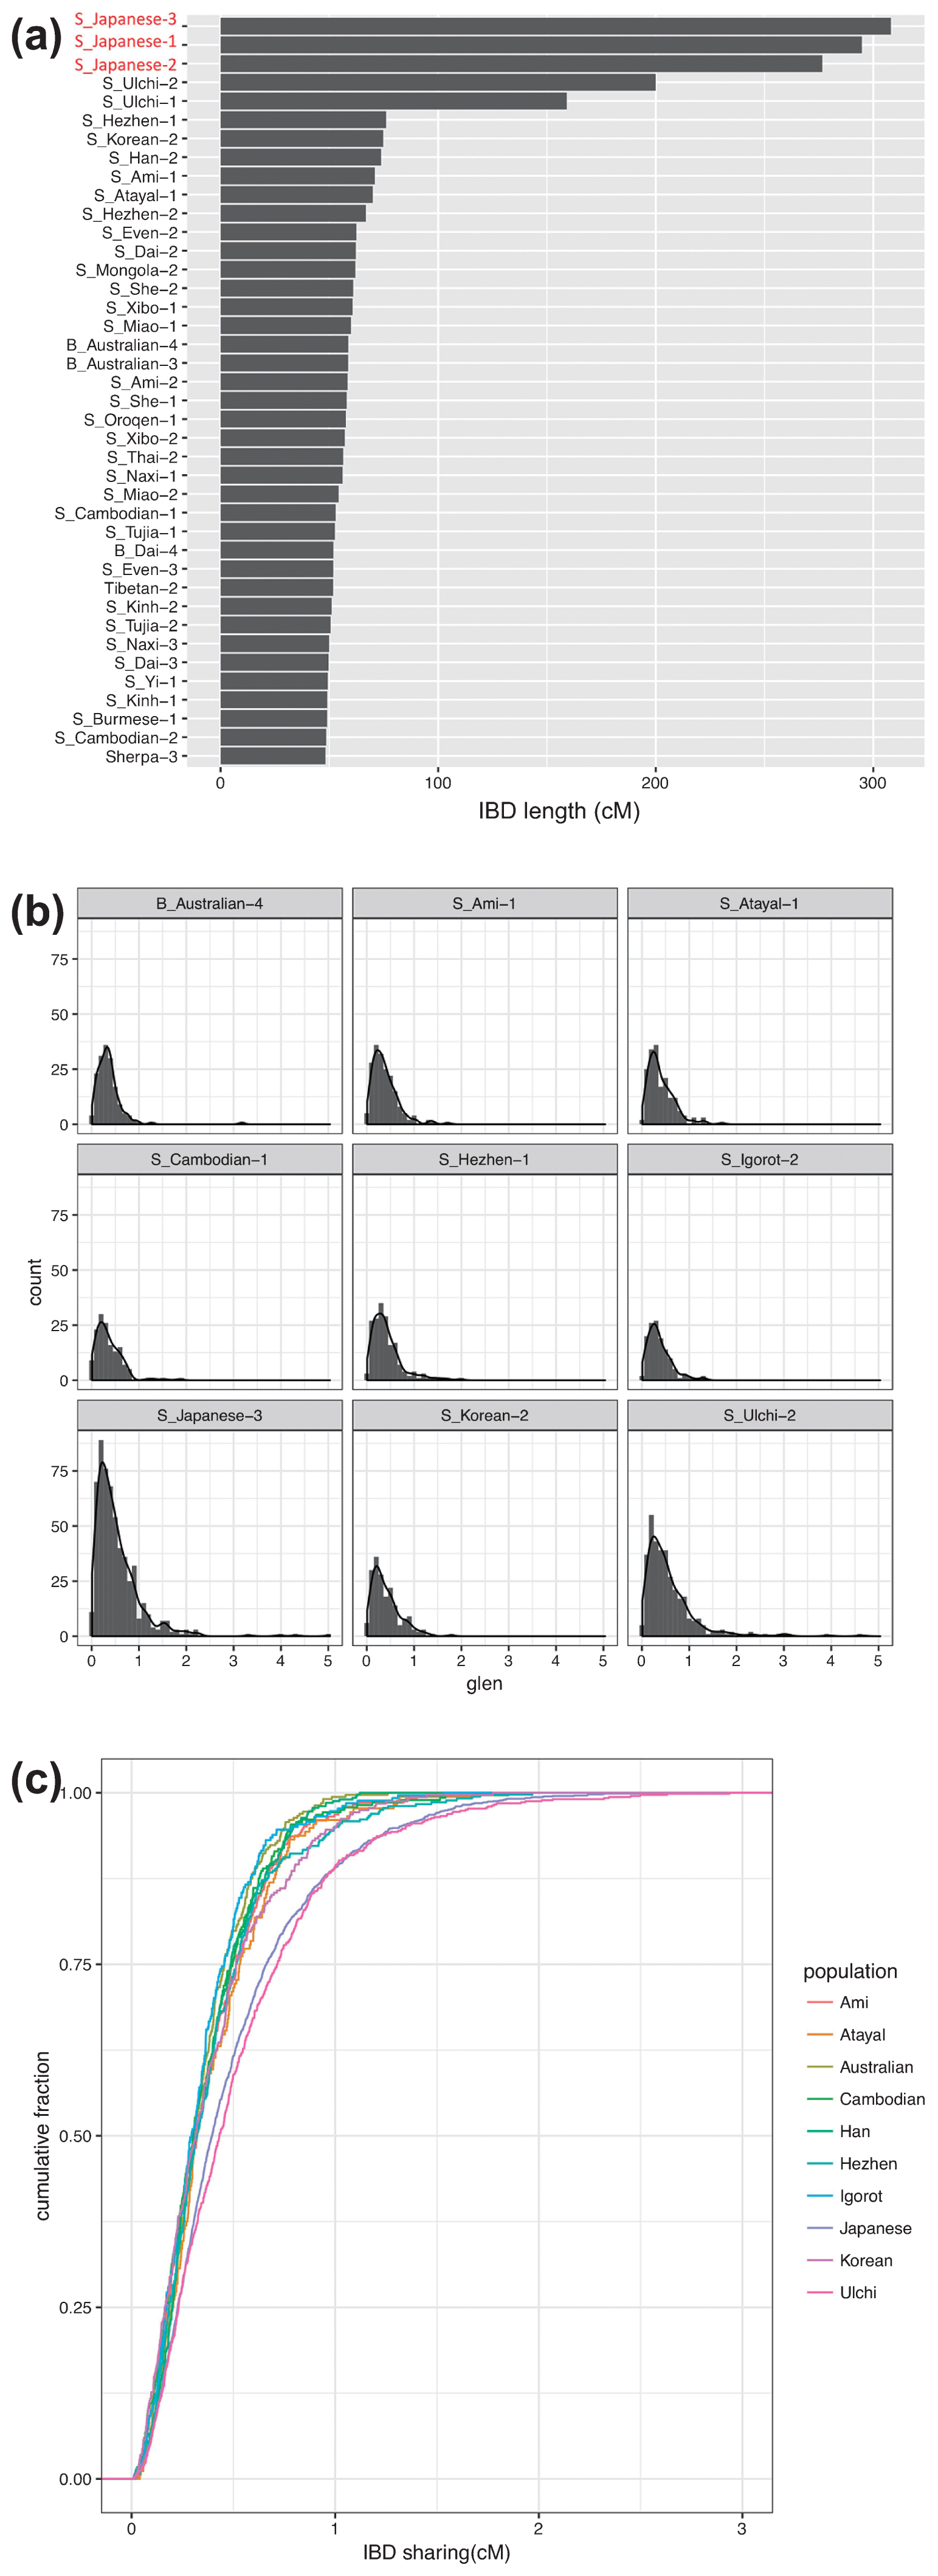 Figure 11 Identity by descent (IBD) sharing between F23 and modern individuals. (a) Total length of IBD segments shared between F23 and SGDP modern human individuals. (b) Length distribution per centimorgan (cM) and (c) cumulative distribution of inferred IBD segments shared between F23 and SGDP modern humans. Estimating ancient gene flow on the basis of the divergence of F23 A comparison of MA1 with the Funadomari Jomon genome and modern East Asians showed that MA1 was genetically equally distant to most East Asians and to Funadomari Jomons (Supplementary Table 14), consistent with a previous study (Kanzawa-Kiriyama et al., 2017). These results suggested that the gene flow event was close to or earlier than the split of the ancestor of Funadomari Jomons and East Asians. In contrast, f4-statistics detected that some modern northern and western Europeans were genetically closer to modern East Asians than to Funadomari Jomons, although the result was not significant (Supplementary Table 13). For more detail, we used S-statistics, which is a haplotype-based analytical method that is more sensitive than f4-statistics and is considered as insensitive to ancestral polymorphisms. We observed that Saami, Finnish, and Russian shared more alleles with East Asians than with F23 (Supplementary Table 27). Similar patterns were also observed in some of other non-African populations. Bougainville from Papua New Guinea shared more alleles with East Asians than with Funadomari Jomons (Supplementary Tables 13 and 27). Aboriginal Australian, Papuan, Andamanese Onge, and Tianyuan share more alleles with two Amazonians (Karitiana and Surui) than with other Native Americans, and it was estimated that the Amazonians could be described as a mixture of other Native Americans and 9–15% of an ancestral population related to Australian, Papuan, the Andamanese Onge, and Tianyuan (Skoglund et al., 2015; Yang et al., 2017). We again observed a significantly high level of affinity between Amerindians and Tianyuan as well as Igorot, Australian, Dusun, and Papuan (f4 test: Z > 3; Supplementary Table 28). In contrast, although Funadomari Jomons and some East Eurasians (e.g. Yi and Ami) also had positive f4-values, these relationships were not significant (Z > 3), suggesting that Funadomari Jomons and most East Asians were not related to the ancestral population contributing to Amazonians. Modern East Asians carry ancestry from both Neanderthal and Denisovan (Green et al., 2010; Reich et al., 2010, 2011). Funadomari Jomons shared as much Neanderthal and Denisovan DNA as other Native Americans and East Eurasians (Supplementary Tables 29–32). IBD also detected shared haplotypes between Funadomari Jomons and Altai Neanderthal (1.516 cM) and between Funadomari Jomons and Denisovans (0.120 cM), similar to the shared haplotypes among other Eurasian populations (Supplementary Tables 33 and 34). |
|

