Post by Admin on Jul 15, 2020 6:53:47 GMT
Early farmer ancestry in Fatyanovo Culture individuals
Then, we turned to the Bronze Age Fatyanovo Culture individuals and determined that their maternal
(subclades of mtDNA hg U5, U4, U2e, H, T, W, J, K, I and N1a) and paternal (chrY hg R1a-M417)
lineages (Table 1, Supplementary Fig. 5, Supplementary Data 2) were ones characteristic of CWC
individuals elsewhere in Europe13,14,29,32,28. Interestingly, in all individuals for which the chrY hg could
be determined with more depth (n=6), it was R1a2-Z93 (Table 1, Supplementary Data 2), a lineage now
spread in Central and South Asia, rather than the R1a1-Z283 lineage that is common in Europe38,39.
On the PCA, the Fatyanovo individuals (and the Estonian CWC individual) group together with many
European Late Neolithic/Bronze Age (LNBA) and Steppe Middle/Late Bronze Age (MLBA)
individuals on top of modern Northern and Eastern Europeans (Fig. 2A). This ancient cluster is shifted
towards Anatolian and European EF compared to Steppe Early/Middle Bronze Age (EMBA)
populations, including the Yamnaya. The same could be seen in ADMIXTURE analysis where the
Fatyanovo individuals are most similar to LNBA Steppe ancestry populations from Central Europe,
Scandinavia and the Eastern Baltic (Fig. 2B, Supplementary Fig. 1). These populations are composed
of the blue "WHG" and yellow "Khanty" component and two brown components maximized in HG
from the Caucasus and Iran, similarly to Yamnaya populations. However, the European LNBA
populations (including Fatyanovo) also display a green component most frequent in Anatolian and
European EF populations, which is not present in the Yamnaya from Russia.

Figure 2. Principal component and ADMIXTURE analyses’ results.
We compared the affinities of the Fatyanovo individuals to those of other populations using f3 and D
statistics and found that Fatyanovo shares more with European EF populations and modern Near
Easterners than Yamnaya_Samara does (Fig. 3C, Supplementary Fig. 2C, Supplementary Fig. 3C).
Importantly, this signal can also be seen when using either autosomal or X chromosome positions from
the Lazaridis et al. 201631 ancient dataset instead of the autosomal positions of the EBC-chipDB
(Supplementary Fig. 3A–B). However, when comparing Fatyanovo to Central_CWC, there were no
clear differences in their affinities to different ancient or modern population groups (Fig. 3D,
Supplementary Fig. 2D). Furthermore, we confirmed the presence of sex-biased admixture previously
seen in CWC individuals from Estonia, Poland and Germany40,41,32,42,43 in the Fatyanovo
(Supplementary Fig. 3D). This is also supported by the presence of mtDNA hg N1a in two Fatyanovo
individuals – a hg frequent in Linear Pottery Culture (LBK) early farmers, but not found in Yamnaya
individuals44,13,29.
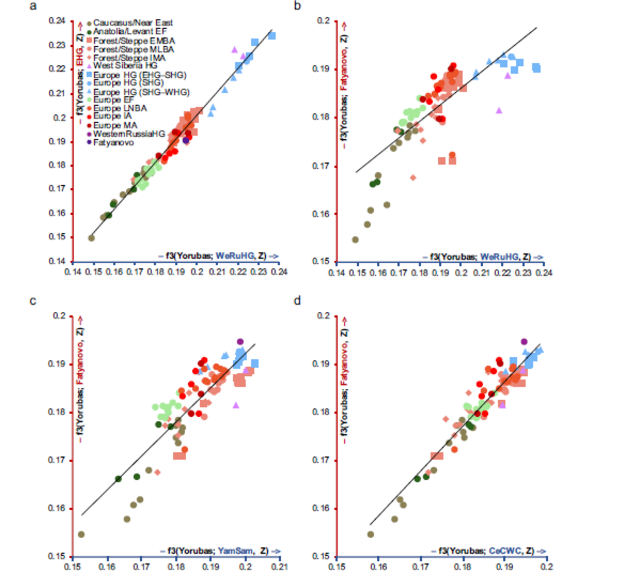
Figure 3. Outgroup f3 statistics' results of comparisons with ancient populations.
Since the previous analyses suggested that the genetic makeup of the Fatyanovo Culture individuals
was a result of admixture between migrating Yamnaya individuals and contemporary European
populations, we used two complementary methods (qpAdm and ChromoPainter/NNLS) to determine
the most suitable proxies for the admixing populations and the mixing proportions. The model with the
highest p-value and the lowest standard errors for qpAdm had Yamnaya and Levant Neolithic (N) as
sources while the model with the smallest residuals for ChromoPainter/NNLS included also WHG, so
we are presenting both models for both analyses (Fig. 4A–B). We ran the analyses for Fatyanovo,
Central CWC and Baltic CWC and saw that in the results of the more complex model, some of the
Yamnaya ancestry from the simpler model got reassigned as WHG but the proportions of Levant N
ancestry remained similar (within 4%). We found that although the results from qpAdm and
ChromoPainter/NNLS differed somewhat, both showed more Levant N ancestry in Fatyanovo (~22%
and ~17%) than in Central/Baltic CWC (~11% and ~10%). What is more, this result is supported by
models where Fatyanovo and Central/Baltic CWC are modeled as a mixture of Levant N and
Baltic/Central CWC, respectively (Supplementary Fig. 4A).
Lastly, we looked for closely related individuals in the Fatyanovo Culture sample-set using READ45.
There were no confirmed cases of 2nd degree or closer relatives (Supplementary Fig. 4B).
Then, we turned to the Bronze Age Fatyanovo Culture individuals and determined that their maternal
(subclades of mtDNA hg U5, U4, U2e, H, T, W, J, K, I and N1a) and paternal (chrY hg R1a-M417)
lineages (Table 1, Supplementary Fig. 5, Supplementary Data 2) were ones characteristic of CWC
individuals elsewhere in Europe13,14,29,32,28. Interestingly, in all individuals for which the chrY hg could
be determined with more depth (n=6), it was R1a2-Z93 (Table 1, Supplementary Data 2), a lineage now
spread in Central and South Asia, rather than the R1a1-Z283 lineage that is common in Europe38,39.
On the PCA, the Fatyanovo individuals (and the Estonian CWC individual) group together with many
European Late Neolithic/Bronze Age (LNBA) and Steppe Middle/Late Bronze Age (MLBA)
individuals on top of modern Northern and Eastern Europeans (Fig. 2A). This ancient cluster is shifted
towards Anatolian and European EF compared to Steppe Early/Middle Bronze Age (EMBA)
populations, including the Yamnaya. The same could be seen in ADMIXTURE analysis where the
Fatyanovo individuals are most similar to LNBA Steppe ancestry populations from Central Europe,
Scandinavia and the Eastern Baltic (Fig. 2B, Supplementary Fig. 1). These populations are composed
of the blue "WHG" and yellow "Khanty" component and two brown components maximized in HG
from the Caucasus and Iran, similarly to Yamnaya populations. However, the European LNBA
populations (including Fatyanovo) also display a green component most frequent in Anatolian and
European EF populations, which is not present in the Yamnaya from Russia.

Figure 2. Principal component and ADMIXTURE analyses’ results.
We compared the affinities of the Fatyanovo individuals to those of other populations using f3 and D
statistics and found that Fatyanovo shares more with European EF populations and modern Near
Easterners than Yamnaya_Samara does (Fig. 3C, Supplementary Fig. 2C, Supplementary Fig. 3C).
Importantly, this signal can also be seen when using either autosomal or X chromosome positions from
the Lazaridis et al. 201631 ancient dataset instead of the autosomal positions of the EBC-chipDB
(Supplementary Fig. 3A–B). However, when comparing Fatyanovo to Central_CWC, there were no
clear differences in their affinities to different ancient or modern population groups (Fig. 3D,
Supplementary Fig. 2D). Furthermore, we confirmed the presence of sex-biased admixture previously
seen in CWC individuals from Estonia, Poland and Germany40,41,32,42,43 in the Fatyanovo
(Supplementary Fig. 3D). This is also supported by the presence of mtDNA hg N1a in two Fatyanovo
individuals – a hg frequent in Linear Pottery Culture (LBK) early farmers, but not found in Yamnaya
individuals44,13,29.

Figure 3. Outgroup f3 statistics' results of comparisons with ancient populations.
Since the previous analyses suggested that the genetic makeup of the Fatyanovo Culture individuals
was a result of admixture between migrating Yamnaya individuals and contemporary European
populations, we used two complementary methods (qpAdm and ChromoPainter/NNLS) to determine
the most suitable proxies for the admixing populations and the mixing proportions. The model with the
highest p-value and the lowest standard errors for qpAdm had Yamnaya and Levant Neolithic (N) as
sources while the model with the smallest residuals for ChromoPainter/NNLS included also WHG, so
we are presenting both models for both analyses (Fig. 4A–B). We ran the analyses for Fatyanovo,
Central CWC and Baltic CWC and saw that in the results of the more complex model, some of the
Yamnaya ancestry from the simpler model got reassigned as WHG but the proportions of Levant N
ancestry remained similar (within 4%). We found that although the results from qpAdm and
ChromoPainter/NNLS differed somewhat, both showed more Levant N ancestry in Fatyanovo (~22%
and ~17%) than in Central/Baltic CWC (~11% and ~10%). What is more, this result is supported by
models where Fatyanovo and Central/Baltic CWC are modeled as a mixture of Levant N and
Baltic/Central CWC, respectively (Supplementary Fig. 4A).
Lastly, we looked for closely related individuals in the Fatyanovo Culture sample-set using READ45.
There were no confirmed cases of 2nd degree or closer relatives (Supplementary Fig. 4B).


