Post by Admin on Jan 30, 2017 20:22:18 GMT

Figure 3: Genetic structure of Bronze Age Asia. a, Principal component analysis (PCA) of ancient individuals (n = 40) from different periods projected onto contemporary non-Africans. Grey labels represent population codes showing coordinates for individuals (small) and population median (large). Coloured circles indicate ancient individuals. b, ADMIXTURE ancestry components (K = 16) for ancient (n = 40) and selected contemporary individuals. The width of the bars representing ancient individuals is increased to aid visualization. Individuals with less than 20,000 SNPs have lighter colours. Coloured circles indicate corresponding group in the PCA. Shared ancestry of Mal’ta with Yamnaya (green component) and Okunevo (grey component) is indicated by dashed arrows.
Historical linguists have argued that the spread of the Indo-European
languages must have required migration combined with social or
demographic dominance, and this expansion has been supported by
archaeologists pointing to striking similarities in the archaeological
record across western Eurasia during the third millennium BC15,18,31.
Our genomic evidence for the spread of Yamnaya people from the
Pontic-Caspian steppe to both northern Europe and Central Asia
during the Early Bronze Age (Fig. 1) corresponds well with the
hypothesized expansion of the Indo-European languages. In contrast
to recent genetic findings32, however, we only find weak evidence for
admixture in Yamnaya, and only when using Bronze Age Armenians
and the Upper Palaeolithic Mal’ta as potential source populations
(Z 5 22.39; Supplementary Table 12). This could be due to the
absence of eastern hunter-gatherers as potential source population
for admixture in our data set. Modern Europeans show some genetic
links to Mal’ta4 that has been suggested to form a third European
ancestral component (Ancestral North Eurasians (ANE))10. Rather
than a hypothetical ancient northern Eurasian group, our results
reveal that ANE ancestry in Europe probably derives from the spread
of the Yamnaya culture that distantly shares ancestry with Mal’ta
(Figs 2b and 3b and Extended Data Fig. 3).

Figure 4: Allele frequencies for putatively positively selected SNPs. a, Coloured circles indicate the observed frequency of the respective SNP in ancient and modern groups (1000 Genomes panel). The size of the circle is proportional to the number of samples for each SNP and population. b, Allele frequency of rs4988235 in the LCT (lactase) gene inferred from imputation of ancient individuals. Numbers indicate the total number of chromosomes for each group. BA, Bronze Age; IA, Iron Age.

The size of our data set allows us to investigate the temporal dynamics
of 104 genetic variants associated with important phenotypic traits or
putatively undergoing positive selection33 (Supplementary Table 13).
Focusing on four well-studied polymorphisms, we find that two single
nucleotide polymorphisms (SNPs) associated with light skin pigmentation
in Europeans exhibit a rapid increase in allele frequency
(Fig. 4). For rs1426654, the frequency of the derived allele increases
from very low to fixation within a period of approximately 3,000 years
between the Mesolithic and Bronze Age in Europe. For rs12913832, a
major determinant of blue versus brown eyes in humans, our results
indicate the presence of blue eyes already in Mesolithic hunter-gatherers
as previously described33.Wefind it at intermediate frequency in
Bronze Age Europeans, but it is notably absent from the Pontic-
Caspian steppe populations, suggesting a high prevalence of brown
eyes in these individuals (Fig. 4).

Figure 4: Allele frequencies for putatively positively selected SNPs.
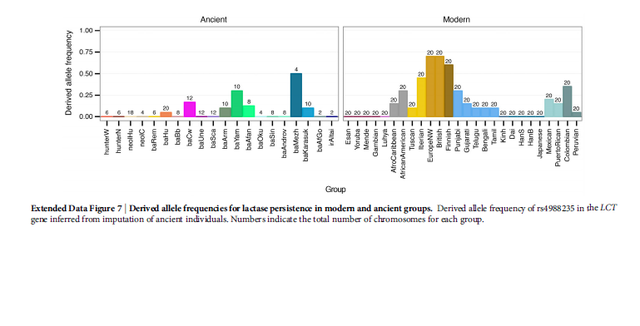
The results for rs4988235, which is associated with lactose tolerance, were
surprising. Although tolerance is high in present-day northern Europeans, we
find it at most at low frequency in the Bronze Age (10% in Bronze Age Europeans;
Fig. 4), indicating a more recent onset of positive selection than previously
estimated34. To further investigate its distribution, we imputed all
SNPs in a 2 megabase (Mb) region around rs4988235 in all ancient
individuals using the 1000 Genomes phase 3 data set as a reference
panel, as previously described12. Our results confirm a low frequency
of rs4988235 in Europeans, with a derived allele frequency of 5% in
the combined Bronze Age Europeans (genotype probability.0.85)
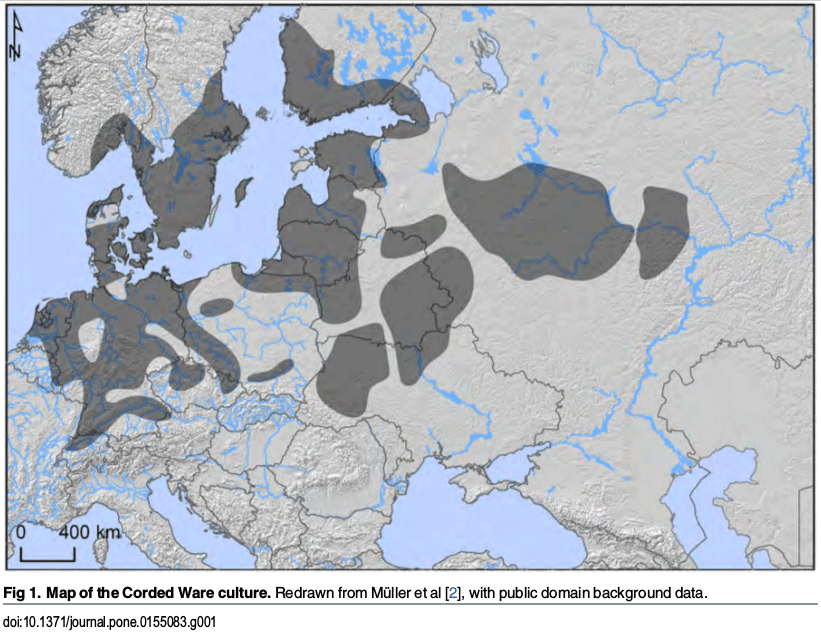
(Fig. 4b). Among Bronze Age Europeans, the highest tolerance frequency
was found in Corded Ware and the closely-related
Scandinavian Bronze Age cultures (Extended Data Fig. 7).

Extended Data Figure 7: Derived allele frequencies for lactase persistence in modern and ancient groups.


