|
|
Post by Admin on Oct 25, 2023 22:00:47 GMT
Since the 1950s, numerous studies have addressed the genetic origin of the Sami.3, 4, 5, 6 Many markers show allele frequency differences between the Sami and non-Sami populations in Sweden, and some markers indicate a similarity with Asian populations.7, 8, 9, 10, 11 In addition, a multilocus analysis has positioned the Sami as outliers among European populations.12 Over 80% of the Sami have one of two mitochondrial DNA (mtDNA) motifs.13 The Sami-specific mtDNA lineage carrying one of those motifs, denoted haplogroup U5b1b1, has been suggested to be of eastern European origin14 but is a subgroup of the more diverse haplogroup U5b1b that is found throughout Europe.14 The second common mtDNA haplogroup in the Sami (haplogroup V) has a likely origin in western Europe and is proposed to have reached Scandinavia via eastern Europe.14, 15 Among the haplogroups that are found at low frequencies in the Sami, both D5 and Z are of Asian origin.14, 16 Three major Y-chromosome haplogroups in the Sami (I, N3 and R1a), accounting for 80% of Sami Y-chromosomes, have been identified. The I and R1a haplogroups are common in many European populations, whereas N3 is common in eastern Europe and northern Asia.14 Accordingly, both mtDNA and Y-chromosome analyses indicate an Asian contribution to the Sami gene pool.
Here, we revisit the hypothesis of a mixed genetic origin of Sami and estimate the contribution of non-European ancestry. In Sweden, there are two separate Sami populations that speak two different languages (‘South Sami’ and ‘North Sami’) out of the 10 discrete languages spoken by different Sami groups in Scandinavia.17 A second aim was to study the genetic similarity of these two populations. In order to study the genetic structure of the Swedish Sami population, we performed high-resolution genetic typing of five HLA class I and class II loci. The human leukocyte antigen (HLA) genes on chromosome 6 (6p21.3) encode polymorphic class I and class II molecules that play a major role in the presentation of foreign antigens to circulating T lymphocytes. The HLA region is characterized by high levels of linkage disequilibrium (LD) between loci and very high levels of polymorphism.18 The polymorphism at HLA loci has been subjected to balancing selection19 but the allele frequency distribution has nevertheless proven to be a valuable tool in genetic studies of human populations. Balancing selection may contribute to the maintenance of new alleles that initially occur at low frequency and may otherwise be easily lost by genetic drift. This may result in a higher number of alleles being maintained in a population and available for tracing the evolutionary history.
|
|
|
|
Post by Admin on Oct 26, 2023 21:13:56 GMT
Materials and methods
Participants
The participants were from the northern Swedish Sami (County of Norrbotten) and the southern Swedish Sami (County of Västerbotten) (Figure 1). A total of 284 unrelated individuals were genotyped (northern Sami n=154; southern Sami n=130). For comparison, we used HLA data of 252 unrelated non-Sami individuals from the Swedish population.20 This study has been approved by the regional ethics committee.
HLA genotyping
For class I HLA-A and HLA-B loci and the class II DRB1, DQB1 and DQA1 loci, DNA (50 ng) was amplified by PCR using biotinylated primers and hybridized to arrays of immobilized oligonucleotide probes.21, 22 Genotypes were assigned using a pattern recognition algorithm implemented in StripScan version 5.7.1 (Roche Molecular Systems).
Allele and haplotype frequencies
Allele and haplotype frequencies were estimated using Arlequin software.23 HLA data specifically collected for anthropological studies from a worldwide selection of populations and available in dbMHC database (http://www.ncbi.nlm.nih.gov/projects/mhc) and in Allelefrequencies.net database (http://www.allelefrequencies.net) were used for comparison. The assignment of populations to geographic regions refers to the original inhabitants of these regions. Data from the Finnish population was included due to the strategic position of this population. As HLA data from all regions were not available in dbMHC, we used DQB1 and DQA1 allele frequencies from the South Korean population (pop 1) and DQA1 allele frequencies from Urumqi Han (China) to represent the Northeast Asian populations. Both datasets are available from the worldwide population allele frequency database (http://www.allelefrequencies.net). Also, the DRB1–DQB1 haplotype frequencies from the Khoton Tarialan population (Mongolia) were chosen to represent the Northeast Asian populations. The following populations from different geographic regions were used in this study – European populations: Bulgarian, Croatian, Czech, Danish, English, Finnish, French, Georgians, German, Irish, Kurds, non-Sami Swedish, northern Swedish Sami, Polish, Portuguese, Romanian, Russian, southern Swedish Sami, Spanish and Svaneti; Northeast Asian populations: Ami, Atayal, Chukchi, Evenks, Han Chinese, Japanese, Ket, Khalkh, Khanty, Khoton Tarialan, Koryaks, Kushun, Mongolian, South Korean, Thao, Tibetans, Tofalar, Tuva and Yami; Southeast Asian populations: Dai Lue, East Timorese, Fijian, Filipino, Indonesian, Ivatan, Javanese, Malay, Moluccan and Thai; American populations: Athabaskans, Canoncito, Guarani-Kaiowa, Pima and Yupik; Australian population: Yuendumu; African populations: Doggon, Kenyan, Pygmy Biaka, Shona and Zulu.
Statistical and phylogenetic analysis
Population differentiation among samples was tested by analysis of molecular variance (AMOVA)24 and observed and expected Hardy–Weinberg genotypic proportions were compared using an exact test,25 both implemented in the Arlequin population genetics software package.23 MDS analyses (for two dimensions, based on the Euclidian distance matrix computed for pairwise populations using allele frequencies) and hierarchical clustering were performed using MATLAB 7.3.0 (statistic toolbox). Nei's standard genetic distance between populations26 was calculated from the allele frequencies and used to reconstruct neighbor-joining (NJ) trees27 using the PHYLIP package28 and the trees were plotted as networks using TreeView.29
The model for uncorrelated allele frequencies between populations, implemented in STRUCTURE,30 was used to construct four population clusters based on the HLA-A, HLA-B and DRB1 genotypes of 100 randomly sampled individuals from each of 14 populations (when 100 individuals were not available from a population, all individuals were sampled). The fraction of genotypes from a population as well as for each individual of a population belonging to each of the four clusters was then visualized. The proportion of admixture in the Swedish Sami was estimated by LEADMIX31 based on HLA-A, HLA-B and HLA-DRB1 allele frequencies.
|
|
|
|
Post by Admin on Oct 27, 2023 21:00:30 GMT
Results
Allele, genotype and haplotype frequencies
We compared the allele and haplotype frequencies between the two Sami populations and between Sami and non-Sami populations. There was no significant difference in heterozygosity between the northern and southern Sami populations (Table 1). For all loci, the allele frequencies were significantly different (P<0.05) in pairwise tests among the northern Sami, southern Sami and non-Sami Swedish populations. Fewer class I alleles were found in northern Sami than in southern Sami (Table 1), and southern Sami showed a higher allelic overlap with other European populations than shown by northern Sami (Supplementary material, Supplementary Table S1–S3). Similarly, there were fewer alleles at class II loci in the northern Sami (Table 1). Observed genotype frequencies did not deviate from expected binomial (Hardy–Weinberg) proportions (P>0.05) at any locus in the two Sami populations. The Ewens–Watterson homozygosity test of neutrality32, 33 showed statistically significant negative values for the normal deviate of the homozygosity (Fnd) for DQA1 and DQB1 in both the southern and northern Sami, consistent with balancing selection acting on the HLA polymorphism at these two loci (Table 1). LD (D′) was high for all combinations of loci, with the northern Sami showing higher D′ values than the southern Sami (Table 1).
Population affinities
Several of the alleles (B*0702, B*1501, B*4002, A*0301) that are uncommon in Asian populations (Supplementary Tables S1–S3) showed similar frequencies in northern Sami as in other European populations, consistent with a predominantly European contribution to the Sami gene pool. Other alleles (B*4001, A*2402, DRB1*0901, DRB1*1101) showed similar frequencies between northern Sami and several Asian populations, while they occurred at a lower frequency in other European populations, indicative of an Asian influence in the Swedish Sami. Three of the alleles in the latter group were found on one northern Sami class I–class II haplotype (A*2402–B*4001–DRB1*0901). Finally, for two alleles (DRB1*0801, B*2705) the frequency in northern Sami was much higher than in any other population used for comparison. This pattern may either be due to selection for these alleles in Swedish Sami or genetic drift.
The MDS analysis resulted in stress values of 0.063, 0.091 and 0.077 for the class I, class II and class I+DRB1 data, respectively. In the MDS plots of the class I data from 14 worldwide populations, both Sami populations were located together with other European populations (Figure 2a). For class II loci (18 populations), both Sami populations were located somewhat outside other European populations and in the vicinity of two Siberian populations (Tuva, Khalkh; Figure 2b). In the combined analysis of HLA-A, HLA-B and DRB1 (15 populations), both Sami populations were found close to other European populations (Figure 2c). In MDS plots with only European populations (data not shown), southern Sami clustered with other European populations, whereas northern Sami were located outside this group, consistent with a different genetic contribution to this population.
|
|
|
|
Post by Admin on Oct 29, 2023 5:36:09 GMT
Figure 2 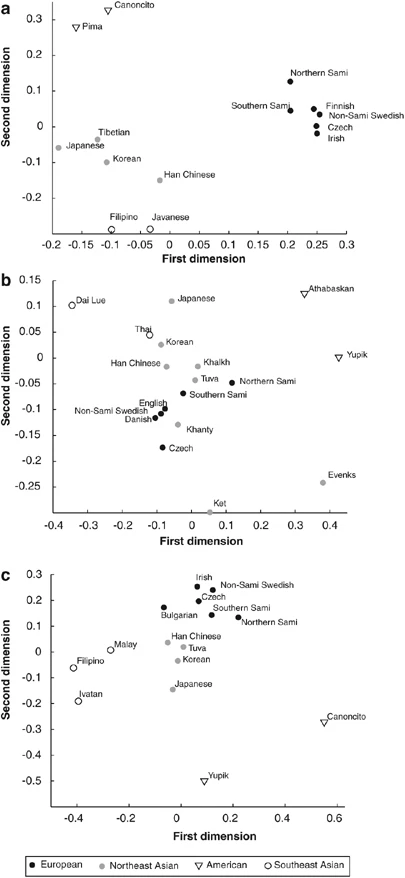 Two dimensional MDS plots for HLA allele frequencies. The plots are based on (a) class I A and B allele frequencies, (b) class II, DRB1, DQB1 and DQA1 allele frequencies and (c) combined allele frequencies of HLA A, B and DRB1. In the phylogenetic network for class I data from 29 populations, both Sami populations were found in close proximity to other European populations (Figure 3a), whereas for class II loci (35 populations), the southern Sami clustered with the other European populations and the northern Sami were again found in the group with Northeast Asian populations (Figure 3b). Interestingly, the northern Sami were found in between south (Tuva and Mongolian) and north (Ket and Evenk) Siberian populations. |
|
|
|
Post by Admin on Oct 30, 2023 5:26:08 GMT
Figure 3 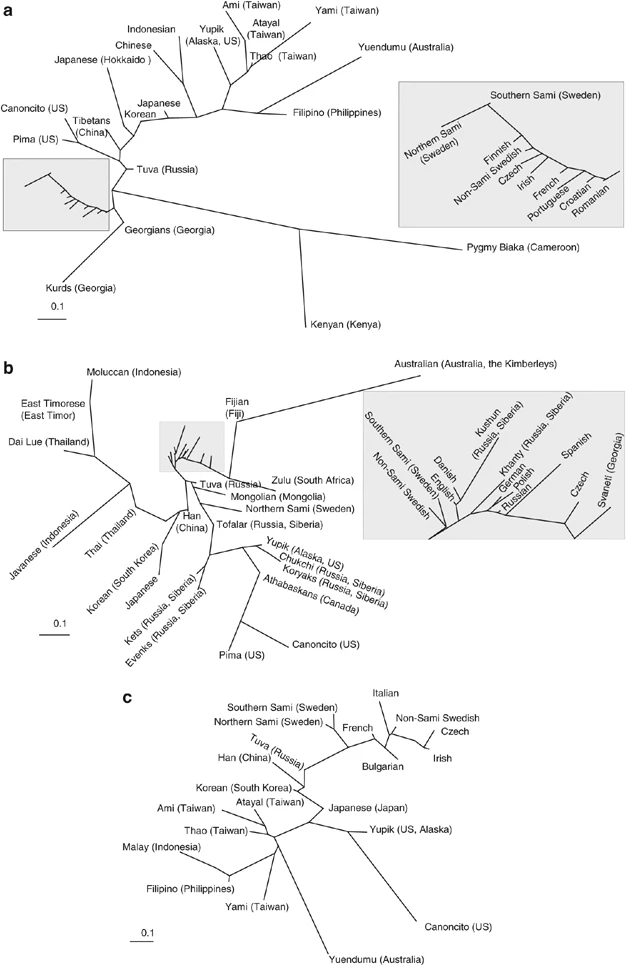 Phylogeny based on HLA allele frequencies. Neighbor-Joining networks based on Nei's genetic distance among populations. The networks are based on (a) class I A and B allele frequencies, (b) class II DRB1, DQB1 and DQA1 allele frequencies and (c) combined allele frequencies of HLA A, B and DRB1. Using the combined HLA-A, HLA-B and HLA-DRB1 allele frequencies of 21 populations, both the northern and southern Sami were found on the same branch, located between Northeast Asian and European populations (Figure 3c). The STRUCTURE analysis showed African populations mainly belonging to the first cluster (green), the European populations to the second (blue) cluster, the Asian and Australian populations to the third (yellow) cluster, and the Native American populations to the fourth (red) cluster (Figure 4a). The two Sami populations belonged predominantly to the blue (European) cluster and to a lesser degree to the yellow (Asian and Australian) cluster. On the individual level, about 60% of the Sami individuals belonged mainly (more than 90%) to the blue (European) cluster. A few Sami belonged almost entirely to the yellow (Asian) cluster and about 30% of the individuals represented various mixtures of the two clusters (Figure 4b). |
|

