|
|
Post by Admin on May 14, 2016 22:43:46 GMT
Admixture Graph Modeling of high coverage ancient genomes Strategy We began with the Admixture Graph (Figure S6.1) in supplementary Information section 8, which relates the high coverage Mbuti (African outgroup), UstIshim, Malta1, Kostenki14, and GoyetQ116-1. This tree fits the allele frequency correlation patterns in the data to within the limits of our resolution, in the sense that the f2-, f3-, and f4-statistics among all possible pairs, triples, and quadruples of populations match the observed values within three standard errors (using an empirical standard error computed with a Block Jackknife). We proceeded by attempting to fit representative high coverage (>1×) samples—Vestonice16, ElMiron, Villabruna, Loschbour—into the Admixture Graph in turn, starting with the oldest and moving forward in time. We evaluated whether each tested model was a fit to the data, again by testing whether the predicted values of all the f2-, f3-, and f4-statistics among all possible pairs, triples, and quadruples of populations matched the observed values, and assessing the significance of the difference using a Block Jackknife. In each of the admixture Graphs shown in this note, the labels on the solid edges give the estimated genetic drift in f2-units of squared frequency difference (parts per thousand). The labels on the dotted edges give mixture proportions. 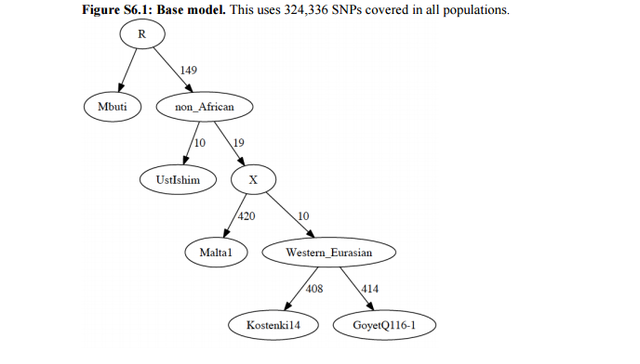 Vestonice16 (~31,000 BP) We added Vestonice16 to all possible nodes of Figure S6.1 either as a simple branch without mixture, or as a mixture between two branches. Altogether, we identified 3 models that fit the data (maximum |Z|<3). We show these in Figure S6.2: Figure S6.2A shows a fit in which Vestonice16, Kostenki14 and GoyetQ116-1 have an unresolved splitting order: a trifurcation. Figure S6.2B shows Vestonice16 as a clade with Kostenki14, with GoyetQ116-1 as an outgroup to both of them. FigureS6.2CshowsVestonice16 mixed of lineages related to Kostenki14 and GoyetQ116-1. 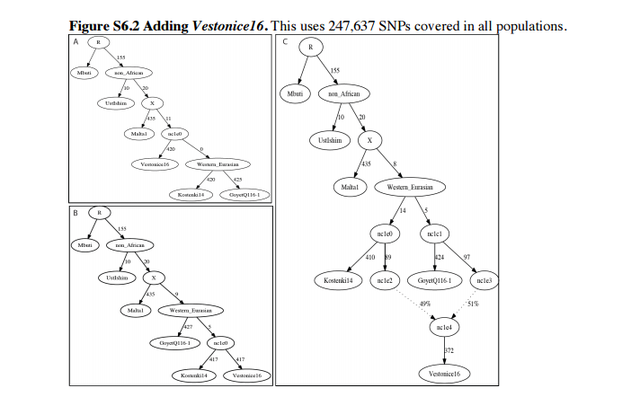 ElMiron (~19,000 BP) We added ElMiron to all possible nodes of the 3 models that fit the data for Vestonice16 (Figure S6.2). We added it either as a simple branch without mixture, or as a mixture of two branches. Figure S6.3 shows the three models that fit. Figure S6.3A shows ElMiron as a clade with GoyetQ116-1 and Vestonice16 as mixed. Figure S6.3B shows Vestonice16 as not mixed and ElMiron is mixed. Figure S6.3C shows both as mixed. 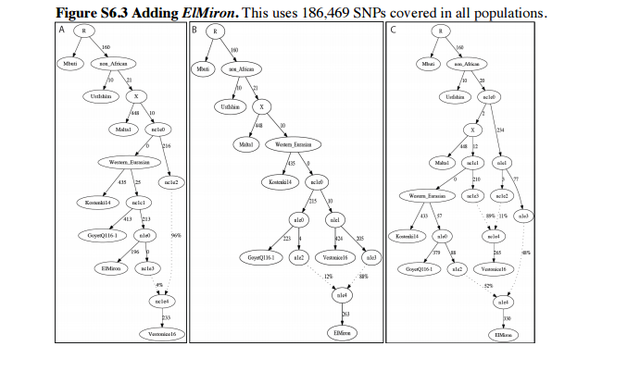 Villabruna (~14,000 BP) We added Villabruna to all possible branches of the 3 models that fit the data for Vestonice16 and ElMiron (Figure S6.3), again either as a simple branch or as a mixture between two branches. A total of nine models fit the data with at least three admixture events. We highlight two in Figure S6.4 (the other 7 models are qualitatively similar, with slight differences in the insertion points for the admixing lineages). 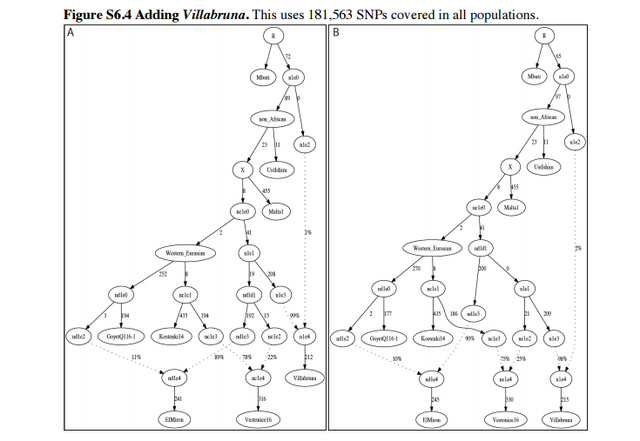 The models that fit the data for Villabruna have the shared features that: - Vestonice16 is a mixture of lineages related to Kostenki14 and Villabruna. - ElMiron is a mixture of lineages related to GoyetQ116-1 and a lineage that contributed most of the ancestry of Villabruna. |
|
|
|
Post by Admin on Sept 4, 2016 21:10:11 GMT
 To these two clear-cut conflict sites we can now add another with unequivocal osteoarchaeological evidence of indiscriminate lethal violence, torture and mutilation, and disposal of the corpses in a commingled and chaotic mass grave (Fig. 1). Although isolated cases of interpersonal violence are known from much older periods (27, 28), as are some pictorial representations of possible violent behavior (29), direct evidence for targeted collective violence is very rare in the preagricultural record of Central Europe. One of the most frequently discussed sites in this regard is the Ofnet Cave in Germany, which shows the deposition of selected human remains with clear evidence of perimortem injuries and cut marks in Mesolithic times (30, 31). At that site, however, only detached and ochre-covered heads with articulated vertebrae were deposited carefully along with animal teeth ornaments in a special location, indicating much more complex behavior than a massacre (32).  Assessing the overall antemortem disease load, we find lesions typical for the LBK: probable signs of tuberculosis in some ribs (50), traces of vitamin C deficiency (48), healed rib and long-bone fractures, a likely well-healed cranial surgery following trauma (Fig. 2A) (59), and osteomyelitis. Joint and dental diseases remain rare. The general health status therefore is as expected for an LBK group from Central Europe, as previously determined from larger population samples.  The lesions that provide the most telling evidence for the interpretation of this mass grave feature are the very frequent perimortem cranial and postcranial fractures (49). These features characterize the assemblage in a way comparable to the other known LBK massacre sites of Talheim and Asparn/Schletz (24⇓–26). Unequivocal perimortem blunt-force injuries affect most cranial bones and can be securely attributed in part to the known adze weapon-tools of the LBK (Fig. 2 B–D). Because most crania were only partly preserved, incomplete, and fragmentary, exact impact sites could not always be determined with confidence. Instead, the overall patterning of perimortem fracture zones was analyzed per cranial element for subadults and adults separately. The highest percentage of traumatized bone was found in the left parietal for both groups, a classic location for blows delivered in face-to-face confrontations during interpersonal violence (60, 61). Injuries to the other larger cranial elements are prevalent as well (Table 1). In the subadult sample, the left halves of the occipital and the frontal are the second and third most frequent cranial injuries (Table 2).  In addition to the extensive cranial trauma, a very high number of perimortem-fractured long bones were recorded (Fig. 3), but traces of carnivore activity could not be identified. Again, because of the high overall fragmentation, an element count based upon anatomically identified and isolated bone units was used for analysis (Table 3). The differences in fracture frequency between the major long bones are very apparent. On average, 19% of the fragments of the upper extremity bones show perimortem fracture [including at least one case of intended amputation of a humerus (Fig. 3D)], but the fracture frequency is much higher for the distal elements of the lower extremity. Some 31–42% of fibula units and a staggering 53–63% of tibia units show perimortem fractures, double to triple the percentage found in the upper limb bones. The lowest overall frequency was found in the femur, where a maximum of only 7% of identified units show perimortem fractures. This pattern clearly reveals a highly significant bias toward perimortem fragmentation of the distal segment of the lower limb and, especially, the tibia (χ2 = 56.011; P < 0.001). Suggestive but not definite lesions that could be attributed to arrow injuries were found in two vertebrae. Early Neolithic Mass Graves as Evidence for Lethal Collective Violence Building on both the evidence previously available for the LBK and the evidence presented here, we suggest that the repeated occurrence of almost indiscriminate massacres, the possible abduction of selected members, and the patterns of torture, mutilation, and careless disposal all fit into the concept of prehistoric warfare as currently understood within anthropology (54, 64, 75). Particular LBK groups were singled out for as yet unknown reasons, attacked with brute force, and annihilated by others, probably close neighbors and very likely other LBK groups of the wider region (25, 76). As has been shown, even within the overall quite homogenous-appearing LBK, recognizable boundaries did exist in many places (77⇓⇓–80). These borders most probably were a result of the spread of different groups without close social or biological kinship ties to one another who came in to close contact as a consequence of the LBK colonization pattern (4, 80). In fact, because the LBK was the first complete Neolithic culture in Central Europe (3), today all farmers of this time and region are classified as members of the LBK by default, regardless of how these people defined themselves and how they differentiated themselves from their contemporaries. Alternative cultural attributions, based almost exclusively on pottery styles, arise only with the decline of the LBK in its final phases (4). The suggested regional differentiation, the possible collapse of previous exchange systems, and increasing defensive architecture are all compatible with increasing levels of widespread social tensions and the looming threat of utmost violence (3). The massacres now known from three widely separated localities but dating to a rather short period give direct evidence that outbreaks of lethal collective violence unquestionably occurred repeatedly within the later LBK (19, 24⇓–26). Although the particular triggers for each massacre might have been different, the overarching patterns of extreme violence and the atypical treatment of the dead are recognizably similar (35). In this context, it is especially telling that all three of the unequivocal massacre sites currently known date to the later phases of the LBK (17, 25), but there is no evidence for comparable levels of violence in the earlier periods. The Kilianstädten massacre, which occurred within an archaeologically suggested border zone of different LBK subgroups (43, 80), with its high potential for intergroup conflict (54, 76), provides an illuminating example of characteristics of nonstate warfare identified earlier from the ethnographic record; the abduction of younger women and the torture, mutilation, and killing of enemies can be seen clearly in the osteological record of Early Neolithic Central Europe (54). Although some earlier works supporting the notion of widespread warfare during the later LBK were based, at least in part, on a premature interpretation of several LBK sites (15, 16, 41) that now are interpreted differently (20⇓⇓–23), the evidence has become more conclusive again with the Kilianstädten site. Importantly, more skeletal remains, the only direct evidence for collective lethal violence, are now available (16, 41, 49). Although the underlying supraregional causes for the recognized increase in mass violence in the late LBK undoubtedly were complex and multifactorial, a significant increase in population followed by adverse climatic conditions (drought), possibly coupled with the inability of long-settled farmers to practice the avoidance behavior by which hunter-gatherers typically evade conflict (75), seems to have been an important component of the overall picture (4). As previous research has shown, climatic changes, especially those leading to increasing unpredictability of or even significant decreases in agricultural production, have played major roles in the change and collapse of societies throughout human history (4, 81, 82). Ecological imbalance and perceived or actual resource stress were suggested previously as some of the main reasons for massacres and warfare in general (55, 64, 83), and at the end of the LBK aggression might have been aggravated further by patrilineally determined social inequality, especially with regard to access to coveted, high-quality farmland, food, and possibly prestige goods (9, 13, 14, 76, 84). Published online before print August 17, 2015, doi: 10.1073/pnas.1504365112 |
|
|
|
Post by Admin on May 13, 2020 20:32:51 GMT
The genetic history of Ice Age Europe Qiaomei Fu, Cosimo Posth, [...], and David Reich Abstract Modern humans arrived in Europe ~45,000 years ago, but little is known about their genetic composition before the start of farming ~8,500 years ago. We analyze genome-wide data from 51 Eurasians from ~45,000-7,000 years ago. Over this time, the proportion of Neanderthal DNA decreased from 3–6% to around 2%, consistent with natural selection against Neanderthal variants in modern humans. Whereas the earliest modern humans in Europe did not contribute substantially to present-day Europeans, all individuals between ~37,000 and ~14,000 years ago descended from a single founder population which forms part of the ancestry of present-day Europeans. A ~35,000 year old individual from northwest Europe represents an early branch of this founder population which was then displaced across a broad region, before reappearing in southwest Europe during the Ice Age ~19,000 years ago. During the major warming period after ~14,000 years ago, a new genetic component related to present-day Near Easterners appears in Europe. These results document how population turnover and migration have been recurring themes of European pre-history. Modern humans arrived in Europe around 45,000 years ago and have lived there ever since, even during the Last Glacial Maximum 25,000-19,000 years ago when large parts of Europe were covered in ice1. A major question is how climatic fluctuations influenced the population history of Europe and to what extent changes in material cultures documented by archaeology and correlating to climatic events corresponded to movements of people. To date, it has been difficult to address this question because genome-wide ancient DNA has been retrieved from just five Upper Paleolithic individuals in Eurasia2–4. Here we assemble and analyze genome-wide data from 51 modern humans dating from 45,000 to 7,000 years ago (Table 1; Extended Data Table 1; Supplementary Information section 1).  Figure 1 Ancient DNA data We extracted DNA from human remains in dedicated clean rooms5, and transformed the extracts into Illumina sequencing libraries6–8. A major challenge in ancient DNA research is that the vast majority of the DNA extracted from most specimens is of microbial origin, making random shotgun sequencing prohibitively expensive. We addressed this problem by enriching the libraries for between 390,000 and 3.7 million single nucleotide polymorphisms (SNPs) in the nuclear genome via hybridizing to pools of previously synthesized 52-base-pair oligonucleotide probes targeting these positions (this strategy makes it possible to generate genome-wide data from samples with high percentages of microbial DNA that are not practical to study by shotgun sequencing)3,9. We sequenced the isolated DNA fragments from both ends, and mapped the consensus sequences to the human genome (hg19), retaining fragments that overlapped the targeted SNPs. After removing fragments with identical start and end positions to eliminate duplicates produced during library amplification, we chose one fragment at random to represent each individual at each SNP. Contamination from present-day human DNA is a danger in ancient DNA research. To address this we took advantage of three characteristic features of ancient DNA (Supplementary Information section 2). First, for an uncontaminated specimen, we expect only a single mitochondrial DNA sequence to be present, allowing us to detect contamination as a mixture of mitochondrial sequences. Second, because males carry a single X chromosome, we can detect contamination in male specimens as polymorphisms on chromosome X10. Third, cytosines at the ends of genuine ancient DNA molecules are often deaminated, resulting in apparent cytosine to thymine substitutions11. Thus, restricting analysis to molecules with evidence of such deamination filters out the great majority of contaminating molecules12. For libraries from males with evidence of mitochondrial DNA contamination or X chromosomal contamination estimates >2.5%—as well as for all libraries from females—we restricted the analyses to sequences with evidence of cytosine deamination (Supplementary Information section 2). After merging libraries from the same individual and limiting to individuals with >4,000 targeted SNPs covered at least once, 38 individuals remained, which we merged with newly generated shotgun sequencing data from the Karelia individual9 (2.0-fold coverage), and published data from ancient2–4,7,13–19 and present-day humans20. The final dataset includes 51 ancient modern humans, of which 16 had at least 790,000 SNPs covered (Figure 1; Table 1; Extended Data Table 1). |
|
|
|
Post by Admin on May 14, 2020 4:35:02 GMT
Natural selection has reduced Neanderthal ancestry over the last 45,000 years We used two previously published statistics3,7,21 to ask if the proportion of Neanderthal ancestry in Eurasians changed over the last 45,000 years. Whereas on the order of 2% of present-day Eurasian DNA is of Neanderthal origin (Extended Data Table 2), the ancient modern human genomes carry significantly more Neanderthal DNA (Figure 2) (P≪10−12). Using one statistic, we estimate a decline from 4.3–5.7% from a time shortly after introgression to 1.1–2.2% in Eurasians today (Figure 2). Using the other statistic, we estimate a decline from 3.2–4.2% to 1.8–2.3% (Extended Data Figure 1, Extended Data Table 3). Because all the European samples we analyzed dating to between 37,000 and 14,000 years ago are consistent with descent from a single founding population, admixture with populations with lower Neanderthal ancestry cannot explain the steady decrease in Neanderthal-derived DNA that we detect during this period, showing that natural selection against Neanderthal DNA must have driven this phenomenon (Figure 2). We also obtain an independent line of evidence for selection from our observation that the decrease in Neanderthal-derived alleles is more marked near genes than in less constrained regions of the genome (P=0.010) (Supplementary Information section 3; Extended Data Table 3)22–25.  Figure 2 Decrease of Neanderthal ancestry over time Y chromosomes, mitochondrial DNA and phenotypically important mutations We used the proportion of sequences mapping to the Y chromosome to infer sex (Extended Data Table 4; Supplementary Information section 4), and determined Y chromosome haplogroups for the males. We were surprised to find haplogroup R1b in the ~14,000-year-old Villabruna individual from Italy. While the predominance of R1b in western Europe today is owes its origin to Bronze Age migrations from the eastern European steppe9, its presence in Villabruna and in a ~7,000-year-old farmer from Iberia9 document a deeper history of this haplotype in more western parts of Europe. Additional evidence of an early link between west and east comes from the HERC2 locus, where a derived allele that is the primary driver of light eye color in Europeans appears nearly simultaneously in specimens from Italy and the Caucasus ~14,000-13,000 years ago. Extended Data Table 5 presents results for additional alleles of known phenotypic importance. When analyzing the mitochondrial genomes we note the presence of haplogroup M in a ~27,000-year-old individual from southern Italy (Ostuni1) in agreement with the observation that this haplogroup, which today occurs in Asia and is absent in Europe, was present in pre-Last Glacial Maximum Europe and became lost during the Ice Age26. We also find that the ~33,000 year old Muierii2 from Romania carries a basal version of haplogroup U6, in agreement with the hypothesis that the presence of derived versions of this haplogroup in North Africans today is due to back-migration from western Eurasia27.  Figure 3 Genetic clustering of the ancient specimens This dataset provides an unprecedented opportunity to study the population history of Upper Paleolithic Europe over more than 30,000 years. In order to not prejudice any association between genetic and archaeological groupings among the individuals studied, we first allowed the genetic data alone to drive the groupings of the specimens and only afterward examined their associations with archaeological cultural complexes. We began by computing f3-statistics14 of the form f3(X, Y; Mbuti), which measure shared genetic drift between a pair of ancient individuals after divergence from an outgroup (here Mbuti from sub-Saharan Africa), which allowed us to observe clear clusters of samples (Figure 3A; Extended Data Figure 2). Through Multi-Dimensional Scaling (MDS) analysis of this matrix (Figure 3B), as well as through D-statistic analyses28 (Supplementary Information section 5), we identified five clusters of individuals with substantial shared genetic drift, which we name after the oldest individual with >1.0-fold coverage in each cluster (Supplementary Information section 5; Table 1; Extended Data Table 1). In contrast, we were not able to identify clear structure among these samples based on model-based clustering29,30, which may reflect the fact that many of the samples are so ancient that present-day patterns of human variation are not very relevant to understanding their patterns of genetic differentiation4,13. The “Vestonice Cluster” is composed of 14 pre-Ice Age individuals from 34,000-26,000 years ago, who are all associated with the archaeologically defined Gravettian culture. The “Mal’ta Cluster” is composed of three individuals from the Glacial Maximum 24,000-17,000 years ago from the Lake Baikal region of Siberia. The “El Mirón Cluster” is composed of 6 Late Glacial individuals from 19,000-14,000 years ago, who are all associated with the Magdalenian culture. The “Villabruna Cluster” is composed of 13 post-Ice Age individuals from 14,000-7,000 years ago, associated with the Azilian, Epipaleolithic and Mesolithic cultures. The “Satsurblia Cluster” is composed of two individuals from 13,000-10,000 years ago from the northern Caucasus2. There were ten samples that we did not assign to any cluster, either because of evidence of representing distinct early lineages, (Ust’-Ishim, Oase1, Kostenki14, GoyetQ116-1, Muierii2, Cioclovina1, Kostenki12), or because they were admixed between major clusters (Karelia or Motala12), or of very different ancestry (Stuttgart). To classify the ancestry of additional low coverage samples, we built an admixture graph that fits the allele frequency correlation patterns among high coverage samples28 (Supplementary Information section 6; Figure 4a). We fit each low coverage sample into the graph in turn, including all fragments from every individual rather than just ones with evidence of cytosine deamination, accounting for contamination bias by modeling (Supplementary Information section 7). |
|
|
|
Post by Admin on May 14, 2020 23:32:04 GMT
 Figure 4 A single founding population during most of the Upper Paleolithic period in Europe Prior to this work, the most ambitious genetic analysis of early modern humans in Europe was based on the ~37,000-year-old Kostenki144. That analysis suggested that the population to which Kostenki14 belonged harbored within it the three major lineages that exist in mixed form in Europe today15: (1) a lineage related to all later pre-Neolithic Europeans, (2) a “Basal Eurasian” lineage that split from the ancestors of Europeans and East Asians before they separated from each other; and (3) a lineage related to the ~24,000-year-old Mal’ta1 from Siberia. With our more extensive sampling of Ice Age Europe, we find no support for this model. When we test whether the ~45,000-year-old Ust’-Ishim – an early Eurasian without any evidence of Basal Eurasian ancestry – shares more alleles with one test individual or another by computing statistics of the form D(Test1, Test2; Ust’-Ishim, Mbuti), we find that the statistic is consistent with zero when the Test populations are any pre-Neolithic Europeans or present-day East Asians3,13,31. This would not be expected if some of the pre-Neolithic Europeans, including Kostenki14, had Basal Eurasian ancestry (Supplementary Information section 8). We also find no evidence for the suggestion that the Mal’ta1 lineage contributed to Upper Paleolithic Europeans4, because when we compute the statistic D(Test1, Test2; Mal’ta1, Mbuti), we find that the statistic is consistent with zero when the Test populations are any pre-Neolithic Europeans beginning with Kostenki14, implying descent from a single founder population since separation from the lineage leading to Mal’ta1 (Supplementary Information section 9). A corollary of this finding is that the widespread presence of Mal’ta1-related ancestry in present-day Europeans15 is due to migrations from the Eurasian steppe in the Neolithic and Bronze Age periods9; it is not due to population structure within pre-Neolithic Europe as proposed in the initial analysis of the Kostenki14 genome4. Resurgence of an early branching European lineage during the Last Glacial Maximum Among the newly reported individuals, GoyetQ116-1 from present-day Belgium is the oldest at ~35,000 years ago. It is similar to the ~37,000 year old Kostenki14 and all later samples in that it shares more alleles with present-day Europeans (e.g. French) than with East Asians (e.g. Han). In contrast, Ust’-Ishim and Oase1, which predate GoyetQ116-1 and Kostenki14, do not show any distinctive affinity to later Europeans (Extended Data Table 6). Thus, from at least about 37,000 years ago, populations in Europe shared at least some ancestry with present Europeans. However, GoyetQ116-1 differs from Kostenki14 and from all individuals of the succeeding Vestonice Cluster in that both f3-statistics (Figure 3; Extended Data Figure 2) and D-statistics show that it shares more alleles with members of the El Mirón Cluster who lived 19,000-14,000 years ago than with other pre-Neolithic Europeans (Supplementary Information section 10). Thus, GoyetQ116-1 has affinity to individuals who lived more than fifteen thousand years later. While at least half of the ancestry of all El Mirón Cluster individuals comes from the GoyetQ116-1 cluster, this proportion varies, with the largest amount in individuals outside Iberia (Z=−4.8) (Supplementary Information section 10). A drawing together of the ancestry of Europe and the Near East after ~14,000 years ago Beginning around 14,000 years ago with the Villabruna Cluster, the strong affinity to GoyetQ116-1 seen in El Mirón Cluster individuals who belong the Late Glacial Magdalenian Culture is greatly attenuated (Supplementary Information section 10). To test if this change might reflect gene flow from populations that did not descend from the >37,000 year old European founder population, we computed statistics of the form D(Early European, Later European; Y, Mbuti) where Y are various present-day non-Africans. If no gene flow from exogenous populations occurred, this statistic is expected to be zero. Figure 4b shows that it is consistent with zero (|Z|<3) for nearly all individuals dating to between about 37,000 and 14,000 years ago. However, beginning with the Villabruna Cluster, it becomes highly significantly negative in comparisons where the non-European population (Y) is Near Easterners (Figure 4b; Extended Data Figure 3; Supplementary Information section 11). This must reflect gene flow into the Villabruna Cluster from a population related to present-day Near Easterners rather than gene flow in the reverse direction, because we do not see similar patterns in earlier Europeans although they share substantial amounts of their ancestry with the Villabruna Cluster (Figure 4b). The “Satsurblia Cluster” individuals from the Caucasus dating to ~13,000-10,000 years ago2 share more alleles with the Villabruna Cluster individuals than they do with earlier Europeans, indicating that they are related to the population that contributed new alleles to people in the Villabruna Cluster, although they cannot be the direct source of the gene flow, among other reasons because they have large amounts of Basal Eurasian ancestry while Villabruna Cluster individuals do not2 (Supplementary Information section 12; Extended Data Figure 4). One possible explanation for the sudden drawing together of the ancestry of Europe and the Near East at this time is long-distance migrations from the Near East into Europe. However, a plausible alternative is population structure, whereby Upper Paleolithic Europe harbored multiple groups that differed in their relationship to the Near East, with the balance shifting among groups as a result of demographic changes after the Ice Age. The Villabruna Cluster includes the largest group of samples in this study. This allows us to study heterogeneity within this cluster (Supplementary Information section 13). First, we detect differences in the degree of allele sharing with members of the El Mirón Cluster, as revealed by significant statistics of the form D(Test1, Test2; El Mirón Cluster, Mbuti). Second, we detect an excess of allele sharing with East Asians in a subset of Villabruna Cluster individuals - beginning with a ~13,000 year old sample from Switzerland - as revealed by significant statistics of the form D(Test1, Test2; Han, Mbuti) (Figure 4b and Extended Data Figure 3). For example, Han Chinese share more alleles with two Villabruna Cluster individuals (Loschbour and LaBrana1) than they do with Kostenki14, as reflected in significantly negative statistics of the form D(Kostenki14, Loschbour/LaBrana1; Han, Mbuti)4. This statistic was originally interpreted as evidence of Basal Eurasian ancestry in Kostenki14. However, because this statistic is consistent with zero when Han is replaced with Ust’-Ishim, these findings cannot be driven by Basal Eurasian ancestry (as we also discuss above), and must instead be driven by gene flow between populations related to East Asians and the ancestors of some Europeans (Supplementary Information section 8). |
|

