|
|
Post by Admin on Sept 22, 2023 21:03:48 GMT
3.2. The Main Patterns of Geographic Variation The frequency distribution maps reveal the patterns of geographic distribution for individual haplogroups that can be summarized for further analysis. Another cartographic method for exploring these patterns is based on the maps of Nei’s genetic distances that aggregate data for all the haplogroups included in the analysis. Every map shows the degree of similarity between the studied populations (Figure 3). The maps of genetic distances expose differences between populations along the entire spectrum of the studied haplogroups, provide a general characteristic of the Y-chromosome gene pool for each population, and highlight regions with the most genetic similarity. 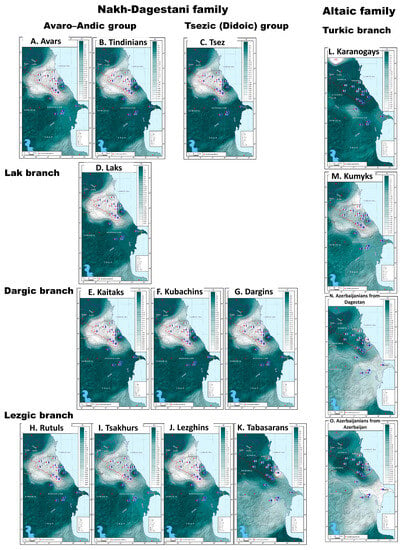 Figure 3. Nei’s genetic distances from 15 Eastern Caucasus populations: (A) Avars; (B) Tindinians; (C) Tsez; (D) Laks; (E) Kaitaks; (F) Kubachins; (G) Dargins; (H) Rutuls; (I) Tsakhurs; (J) Lezghins; (K) Tabasarans; (L) Karanogais; (M) Kumyks; (N) Azerbaijanians from Dagestan; (O) Azerbaijanians from Azerbaijan. The Dagestani pattern. The maps of genetic distances from the Avar-Andi-Dido, Lak, Dargin, and Lezgi linguistic groups representing the Nakh-Dagestanian language family (Figure 3A–K) share a common pattern, the only exception being the Tabasaran people (Figure 3K). This Dagestani pattern is characterized by close genetic distances between the populations (0.01 < đ < 0.11), occurs only in Dagestan, and is not correlated with the language. It is quite distinct although not so intense (0.07 < đ < 0.17) for the Turkic-speaking Kumyks (Figure 3M). The Dagestani pattern shows a deep connection between the gene pools of Dagestan’s populations in terms of Y-chromosome haplogroups. This pattern is largely defined by the presence of haplogroup J1-M267(×P58): its frequency distribution map (Figure 2D) shows its peak frequencies for most Dagestani populations. Within the scope of this study, a genetic similarity is observed between the populations of Dagestan and North Iran, which is determined by the contribution of haplogroups J1 and J2 (Figure 2D,F) and may echo the earliest waves of migration into the East Caucasus. The Steppe pattern. The maps of Nei’s genetic distances from Turkic-speaking populations demonstrate significant differences between these groups (Figure 3L–O). The Kumyk gene pool is close to that of the Caucasian-speaking populations of Dagestan (Figure 3M). The Azerbaijani gene pool (Figure 3N–O) is similar to that of Iranian-speaking peoples of the Caucasus. The only pattern that reflects a very distinct connection to the gene pools of the Eurasian steppe is found among the Karanagais (Figure 3L). This pattern is not characteristic of other populations studied in this paper, except that there is a slight increase in the haplogroup frequency among the Azerbaijani Karapapakhs. It would be fair to call it the “steppe pattern” since it reflects the genetic link to the populations of the Eurasian steppe. The Iranian pattern. There is a genetic similarity between all Azerbaijani populations (0.03 < đ < 0.21, Figure 3N–O) and the Iranian-speaking populations of the Caucasus (Tats, Talysh, Yezidi, Kurds). The contribution of haplogroups J2-M172(×M67, M12) and R1b-M269 to this pattern is the greatest, which can be seen by comparing the maps of their distribution (Figure 2E,H) and the Iranian pattern of genetic distances (Figure 3K,N,O). This pattern manifests on the map of genetic distances from the Tabasaran, who represent the Lezgi branch of the Nakh-Dagestanian language family, although its intensity for the Tabasaran is slightly lower. Note. The colors on the maps correspond to the values of genetic distances: the white color is the minimum difference between populations, and the richer the turquoise color, the higher the genetic distances. The color scale (matching colors to values) is shown in the upper right corner of each map. Legend: 1—Karanogais, 2—Chechen, 3—Kumyks, 4—Tindi, 5—Avars, 6—Dargins, 7—Tsez (Dido) and Hinukh, 8—Laks, 9—Kaitak, 10—Azerbaijanis from Dagestan, 11—Kubachi, 12—Tabasarans, 13—Tsakhur, 14—Rutuls, 15—Lezgins, 16—Karapapakhs, 17—Azerbaijanis (including Karapapakhs) from Azerbaijan, 18—Azerbaijanis (excluding Karapapakhs) from Azerbaijan, 19—Iranian-speaking peoples of the Caucasus (Tats, Talysh, Kurds), 20—Iranian-speaking peoples of the Caucasus (Yezidis). Overall, the gene pool of the East Caucasus is represented by three main patterns: Dagestani, Iranian, and Steppe. They may correspond to three “layers” of the gene pool formed during different periods in the past. In this hypothesis, the name “Dagestani” shows a connection to the ancient autochthonous Caucasian population that gave rise to a wealth of gene pools (that still retain their unity) due to a powerful genetic drift. The Iranian pattern is associated with an ancient Iranian population descended from Media and earlier waves of migration in the 3rd–2nd millenniums BC. The Steppe pattern is more recent in terms of its origin and its contribution to the gene pool of the East Caucasus; this pattern reflects one of the latest migration waves of Turkic populations. |
|
|
|
Post by Admin on Sept 23, 2023 21:22:38 GMT
3.3. East Caucasus in Multidimensional Genetic Space The cartographic analysis of genetic distances identifies the areas of genetic similarity for one population on the one map. In turn, the visual representation of the entire pairwise matrix of Nei’s genetic distances (Table 2) by means of multidimensional scaling reveals the relationship among all studied populations. The constructed genetic space (Figure 4) comprises three different clusters (Figure 4) that reflect geographic but not linguistic patterns. The northeastern vector of Eurasian-steppe influence manifests in the Steppe cluster. The southeastern vector reflects the influence of West Asia and shapes the arbitrary Iranian cluster. The vector of autochthonous Caucasian populations exerts its influence in the Dagestani cluster that unites all Dagestani-speaking peoples. The shortest distance is between the Iranian and Steppe clusters (đ = 0.77). The distance between the Iranian and the Dagestani clusters is slightly longer (đ = 0.93); distances between other pairs of clusters are 1.5–2 times greater (Supplementary Table S4). Similar patterns are reproduced in the analysis of principal components (Supplementary Figure S1, Supplementary Table S5). 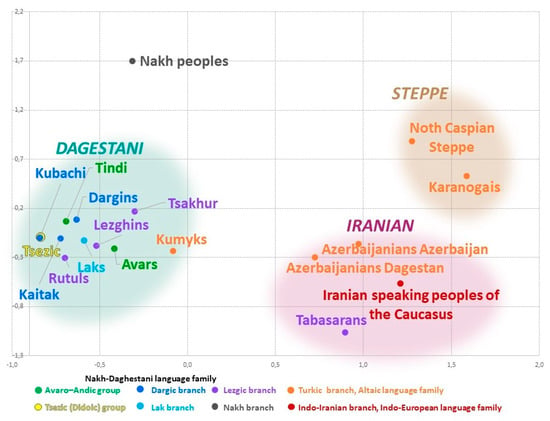 Figure 4. Eastern Caucasus populations on the multidimensional scaling plot (Stress 0.07, Alienation 0.09). The Steppe cluster is formed by the Karanogais of Dagestan and the pooled population of Turkic speakers inhabiting the north of the Caspian steppe (Stavropol Trukhmens and Nogais, Astrakhan Tatars, and Nogais). It is characterized by the highest heterogeneity (đ = 0.24, Table 2) and reflects migrations inside the Eurasian steppe, including the medieval migration waves that impacted the gene pools of Nagais and Astrakhan Tatars, the most recent migration of Trukhmens from the Caspian region in the 17th century, etc. Genetic interactions of the past between the populations of the East Caucasus and the Eurasian steppe only show through on the northern border of the region in the gene pool of Dagestani Karanogais and are much weaker for Kumyks and Karapapakhs. The Iranian cluster comprises representatives of three language families: the Turkic-speaking Azerbaijanis from Dagestan and Azerbaijan, the Iranian-speaking populations of the Caucasus, and the Lezgic-speaking Tabasaran. This cluster is much denser (đ = 0.14, Table 2) than the Steppe cluster but less consolidated than the Dagestani cluster. The presence of the Tabasaran in this cluster might reflect the legacy of the Tabasaran maisum state in the south of Dagestan, where they lived next to other populations of the cluster, or, alternatively, might indicate the impact of medieval migrations from the Tabaristan province in the north of Iran. The Iranian cluster reflects interactions between the local populations and the populations of West Asia and, therefore, can be called Iranian. The populations of the East Caucasus and West Asia maintained their contacts throughout long periods of history; their contacts occurred across the vast territory that stretches beyond the East Caucasus, so further research is needed to study the sources and history of this component. The Dagestani cluster includes all Caucasian-speaking populations of Dagestan, except for the Tabasaran, and the Turkic-speaking Kumyks of Dagestan that are geographically close to each other (the average Nei’s genetic distance between all 11 populations is đ = 0.05, Table 2). The manner in which the populations are distributed within the cluster remotely resembles their geography: the Dargin, Lak, and Tsez populations that live further to the north occupy the top and the left part (“the north-west”) of the plot. Lezgian populations settled further to the south occupy the “south-east” of the plot, i.e., the opposite portion of the cluster. Kumyks’s position on the cluster’s border represents the main layer of their gene pool that connects them to Caucasian-speaking populations and suggests genetic “borrowings” from other Turkic-speaking populations. The periphery of the plot is occupied by the pooled Nakh populations (Chechen and Ingush). The geographically dense Dagestani component of the East Caucasus gene pool found in most Dagestani populations is largely shaped by the high frequency of haplogroup J1-M267(×P58); its structure will be analyzed below. |
|
|
|
Post by Admin on Oct 15, 2023 20:32:56 GMT
3.4. Phylogeography of Haplogroup J1-M267(×P58) Table (Supplementary Table S6) shows the results of screening conducted among the populations of the East Caucasus and the neighboring regions. The DNA samples were screened for 31 SNPs that characterize the J1-M267(×P58) lineage. Branch J1-Y3495 dating back to 6.4 ± 0.6 kya is the most prevalent in the region ([https://www.yfull.com/tree/J-Y3476/, accessed on 31 May 2023], Figure 5A, Supplementary Table S6). 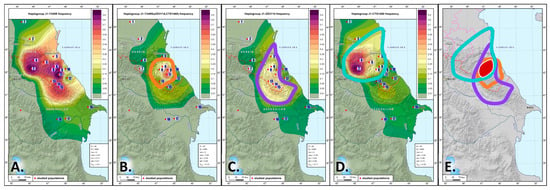 Figure 5. The distribution of Y-haplogroup J1-Y3495 and its main branches in the Eastern Caucasus: (A) J1-Y3495; (B) J1-Y3495(×ZS3114,CTS1460); (C) J1-ZS3114; (D) J1-CTS1460; (E) area of J1-Y3495 haplogroup origin. Note. The red dots on the map represent the analyzed populations. Areas of grey indicate haplogroup frequencies below 1%, areas of green indicate low frequencies of 1–20%, areas of yellow are the zones of moderate frequencies (20–50%), and areas of red and purple are zones of high frequencies (>50%). The region with haplogroup frequency ≥20% in Figure 5B–E is outlined by a line: orange color—for J1-Y3495(×ZS3114,CTS1460), purple—for J1-ZS3114, turquoise—for J1-CTS1460. Legend: 1—Karanogais, 2—Chechen, 3—Kumyks, 4—Tindi, 5—Avars, 6—Dargins, 7—Tsez (Dido) and Hinukh, 8—Laks, 9—Kaitak, 10—Azerbaijanis from Dagestan, 11—Kubachi, 12—Tabasarans, 13—Tsakhur, 14—Rutuls, 15—Lezgins, 16—Azerbaijanis (including Karapapakhs) from Azerbaijan, 17—Iranian-speaking peoples of the Caucasus (Tats, Talysh, Kurds), 18—Iranian-speaking peoples of the Caucasus (Yezidis). So far, subhaplogroup J1-Y3495 has not been described in detail in the literature, but its ancestral lineage J1-Z18375 (or phylogenetic equivalent Z1841) is well known [36]. We focused on its phylogenetic equivalent Z1841. For J1-Z1841/Z18375, TMRCA is 8.1 ± 1.0 kya according to YFull [https://www.yfull.com/tree/J-Z1828/, accessed on May 31 2023] and 6.5 ± 1.5 kya according to [36]. This lineage was detected in one of the three representatives of the Kura–Araxes culture (Velikent, Derbent region, Dagestan) that dates back to the Bronze Age (~5000 years ago [48]). This led us to hypothesize its geographic origin in the Caucasus or in the vicinity of the region [36]. Its subbranch J1-Z1842 was found in a man from East Anatolia who lived ~5000 years ago [49]. The fact that the J1-Z1841/Z18375 lineage was common in Anatolia and Levant about 3000 years ago suggests contacts between the speakers of the Hurro-Urartian and the Nakh-Dagestanian languages [36]. The only lineage that represents haplogroup J1-Z1841 in the populations of the East Caucasus is J1-Y3495. We were able to identify 17 polymorphic lineages of this haplogroup (Supplementary Table S6); frequency distribution maps were constructed for the most common of the identified variants (Figure 5A–D and Figure S2). The maps show that lineages J1-ZS3114 and J1-CTS1460 (~6 kya, Supplementary Table S6), as well as J1-Y3495(×ZS3114,CTS1460), occur almost everywhere in the region (Figure 5B–D). There is a cumulative effect: J1-ZS3114 is more common for the speakers of the Dargin, Lak, and Lezgi branches; J1-CTS1460 is typical for the speakers of the Avar-Andi-Dido languages; J1-Y3495(×ZS3114, CTS1460) is widespread among the Dargin speakers and slightly less frequent in the speakers of Lezgi languages (Supplementary Table S6). The geographies of these three lineages overlap at a noticeable frequency (over 20%) in Dagestan, suggesting that J1-Y3495 may have originated here (Figure 5E). There is only a slight difference in the average dates of origin between haplogroup J1-Y3495 and its two branches J1-ZS3114 and J1-CTS1460 (300 to 500 years), which indicates population growth in the region in the early Bronze Age (~6 kya), the time of new metalwork technologies, social change, and tribal unions. Linguistic data suggests that the Nakh-Dagestanian protolanguage split occurred at the end of the 3rd millennium BC (~5 kya) [50]. This is consistent with our genetic data: older lineages dating back ~6000 years occur in almost all Dagestani populations analyzed in this work and in some Nakh groups (Figure 5, Supplementary Table S6), although frequency peaks for J1-CTS1460 and J1-ZS3114 are observed in a number of different linguistic groups. Thus, the main portion of the Y gene pool of Dagestan’s populations (carriers of haplogroup J1-M267(×P58) can be traced to the ancestral lineage J1-Y3495. We hypothesize that in the late Copper Age and the early Bronze Age (~6.5 kya), carriers of this lineage were settled in the central part of mountainous Dagestan, where the geographies of the main J1-Y3495 clades overlap (Figure 5E), and were part of the community that spoke the ancestral pan-East-Caucasian language [50]. Other authors [22] came to the same conclusion based on the analysis of three marker sets (genome-wide, Y-chromosome, and mtDNA panels), although the comparison relied on STR markers and only four SNPs. The single founder of the major haplogroup in the gene pool of Dagestan may suggest a reduction of the ancient population in earlier periods when other lineages that co-existed with J1-Y3495 became extinct because of the bottleneck effect. The main impact of the Avar-Andi-Dido J1-CTS1460 lineage is observed for its branch J1-Y6916 (5.8 ± 1.1 kya, Supplementary Figure S2A). The gene geography of the most common variants of this lineage (Y6916(×ZS2872), Y61473, ZS2910(×ZS2878, ZS7652), and ZS2878) reveals its geographic center in the areas occupied by Avar-Andi-Dido speakers (Supplementary Figure S2B–F) and extends to some areas further to the south. The dating of the lineages (4–5 kya, Supplementary Table S6) suggests continuous population growth after the lineage split in the diverged population. |
|
|
|
Post by Admin on Oct 16, 2023 22:23:05 GMT
4. Conclusions Three components of the East Caucasus gene pool are unequal and may have arisen in different periods of population history. The Steppe component occurs only in the north of the region among Karanogais and reflects the most recent migration wave of Turkic-speaking nomads from the Eurasian steppe in the Middle Ages. Two other components (Dagestani and Iranian) shape two opposite poles and contribute the most to the East Caucasus gene pool. The Dagestani component is largely shaped by lineage J1-Y3495 (6.5 ± 0.6 kya), whose emergence may have been preceded by a population decline followed by a population growth. The analysis of J1-Y3495 phylogeography allowed us to trace its origin to the central part of mountainous Dagestan, to an ancestral population that spoke the pan-East-Caucasian language. The split in the gene pool after ~6 kya can be linked to the population growth, dispersal of communities, and their long-lasting isolation in the mountains. This is confirmed by the split of this haplogroup in Avar-Andi-Dido populations ~4–5 kya. The Iranian component shows the genetic similarity of Azerbaijanis, the Tabasaran, and the Iranian-speaking populations of the Caucasus to the populations of West Asia that can be linked to a series of ancient migration waves. This pattern results from the contribution of haplogroups J2-M172(×M67, M12) and R1b-M269 that may have been carried into the region by migrations of West Asian tribes, mostly Iranian speakers, throughout its history. Detailed analysis of the origin of this component and its dating will be conducted in the future in a broader genogeographic context. Supplementary Materials The following supporting information can be downloaded at: www.mdpi.com/article/10.3390/genes14091780/s1, Figure S1: Eastern Caucasus populations on PC1vsPC2 plot (PC1 26%, PC2 17,5%); Figure S2: The distribution of Y-haplogroup J1-Y6916 and its branches in the Eastern Caucasus, note: the red dots on the map represent the analyzed populations, areas of grey indicate haplogroup frequencies below 1%, areas of green indicate low frequencies of 1–20%, areas of yellow are the zones of moderate frequencies (20–50%), areas of red and purple are zones of high frequencies (>50%), (A): haplogroup J1-Y6916 frequency, (B): haplogroup J1-Y6916(×ZS2872) frequency, (C): haplogroup J1-ZS2872(×ZS2910,Y61473) frequency, (D): haplogroup J1-Y61473 frequency, (E): haplogroup J1-ZS2910(×ZS2878,ZS7652) frequency, (F): haplogroup J1-ZS2878 frequency; legend: 1—Karanogais, 2—Chechen, 3—Kumyks, 4—Tindi, 5—Avars, 6—Dargins, 7—Tsez (Dido) and Hinukh, 8—Laks, 9—Kaitak, 10—Azerbaijanis of Dagestan, 11—Kubachi, 12—Tabasarans, 13—Tsakhur, 14—Rutuls, 15—Lezghins, 16—Azerbaijanis (including Karapapakhs) from Azerbaijan, 17—Iranian speaking peoples of the Caucasus (Tats, Talysh, Kurds), 18—Iranian speaking peoples of the Caucasus (Yezidis); Table S1: Data sources and sample size; Table S2: List of studied Y-SNPs; Table S3: Y-haplogroup frequencies in the Eastern Caucasus populations; Table S4: Average Nei’s genetic distances among clusters; Table S5: Principal Component Analysis results; Table S6: Y-haplogroup J1-M267(×P58) genotyping data. Author Contributions Conceptualization, A.A., E.B.; methodology, E.B.; software, S.K.; validation, A.A., V.P. and G.P.; formal analysis, A.A., V.P. and G.P.; investigation, G.P. and V.P.; resources, N.I., V.P., V.S., E.P. and Z.K.; data curation, A.A. and V.P.; writing—original draft preparation, N.I., A.A. and E.B.; writing—review and editing, N.I., A.A. and E.B.; visualization, A.A. and G.P.; supervision, E.B.; project administration, A.A.; funding acquisition, A.A. and E.B. All authors have read and agreed to the published version of the manuscript. |
|
|
|
Post by Admin on Oct 17, 2023 21:09:03 GMT
Genes reveal traces of common recent demographic history for most of the Uralic-speaking populations Abstract Background The genetic origins of Uralic speakers from across a vast territory in the temperate zone of North Eurasia have remained elusive. Previous studies have shown contrasting proportions of Eastern and Western Eurasian ancestry in their mitochondrial and Y chromosomal gene pools. While the maternal lineages reflect by and large the geographic background of a given Uralic-speaking population, the frequency of Y chromosomes of Eastern Eurasian origin is distinctively high among European Uralic speakers. The autosomal variation of Uralic speakers, however, has not yet been studied comprehensively. Results Here, we present a genome-wide analysis of 15 Uralic-speaking populations which cover all main groups of the linguistic family. We show that contemporary Uralic speakers are genetically very similar to their local geographical neighbours. However, when studying relationships among geographically distant populations, we find that most of the Uralic speakers and some of their neighbours share a genetic component of possibly Siberian origin. Additionally, we show that most Uralic speakers share significantly more genomic segments identity-by-descent with each other than with geographically equidistant speakers of other languages. We find that correlated genome-wide genetic and lexical distances among Uralic speakers suggest co-dispersion of genes and languages. Yet, we do not find long-range genetic ties between Estonians and Hungarians with their linguistic sisters that would distinguish them from their non-Uralic-speaking neighbours. Conclusions We show that most Uralic speakers share a distinct ancestry component of likely Siberian origin, which suggests that the spread of Uralic languages involved at least some demic component. Background The linguistic landscape of North Eurasia is dominated by three language families—Turkic, Indo-European (IE) and Uralic. It has recently been shown that the spread of Turkic languages was mediated by gene flow from South Siberia [1]. Similarly, ancient DNA evidence of a major episode of gene flow from the Ponto-Caspian Steppe Belt to Central Europe and Central Asia during the Late Neolithic and Early Bronze Age (BA) has been interpreted as supporting the ‘Steppe Hypothesis’ of the spread of IE languages [2, 3]. However, while historical linguists have some level of consensus over the origin and spread of the Uralic languages and archaeologists have views about the dynamics of material culture over the relevant time and space [4,5,6,7,8], the genetic history of Uralic-speaking populations has remained poorly known. The Uralic family contains 40–50 different languages [9,10,11] and covers a vast territory mainly from the shores of the Baltic Sea in Europe to the West Siberian Plain and the Taymyr Peninsula in Asia (Fig. 1a). According to the classical view, the Uralic languages derive from a protolanguage that split into two major branches—the Finno-Ugric (FU) and the Samoyed. The suggested age of the Uralic language family is 6,000–4,000 years before present (BP) (see e.g. [12,13,14], cf. [15, 16]). The most widely accepted hypotheses place the homeland of the Uralic language family into the watershed of river Volga and its tributaries Oka and Kama (see e.g. [17,18,19,20] and references therein), while some scholars propose a Siberian homeland [12, 21, 22]. The precursors of present-day FU languages gradually spread west towards the Baltic Sea (Proto-Finnic) [13, 23], north-west (Proto-Saami) [24], north (Proto-Permian branch giving rise to Komi) [9], whereas some (Udmurt, Mordovian and Mari) remained in the Volga area. The precursors of the Ugric (Khanty, Mansi and Hungarian) and Samoyed languages (e.g. Nenets, Nganasan, Selkup), spoken today mostly to the east of the Ural Mountains, but also in Central Europe (Hungarian) and in Northeast (NE) Europe (Nenets), are thought to have descended from the easternmost varieties of the Uralic proto-languages spoken in western [18] or eastern [12] side of the Ural Mountains. Their geographic range expansion occurred most likely as a combination of demic and cultural dispersal processes [9]. The proto-Hungarian spread southwest towards Central Europe during the first millennium AD, while the linguistic ancestors of Mansi and Khanty remained mostly in West Siberia [9]. The Samoyed languages reached the periphery of their present-day spread area in the Taimyr Peninsula as late as on sixteenth century AD [25, 26]. Recent linguistic studies associate the diversification of the Uralic family with climatic and cultural changes [13] that may have led to a considerable demographic changes since the Mesolithic times in their core areas and to further migrations towards the north and northwest. genomebiology.biomedcentral.com/articles/10.1186/s13059-018-1522-1 |
|

