|
|
Post by Admin on Jan 18, 2024 17:49:39 GMT
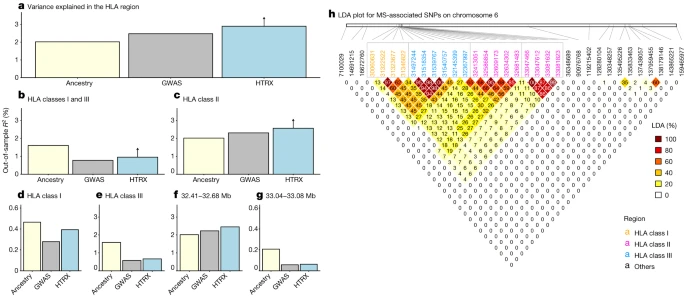 a–g, Comparison of variance explained in MS within the UK Biobank for all fine-mapped HLA SNPs with an independent contribution4. The plots compare GWAS (treating SNPs as having independent effects), local ancestry at the SNPs and HTRX (haplotypes), after accounting for covariates (Methods), for fine-mapped MS-associated SNPs in the HLA region (a), the HLA class I and class III regions (b), the HLA class II region (c), the HLA class I region (d), the HLA class III region (e) and subregions of the HLA class II region chosen from LD (f,g). Upward-pointing arrows for HTRX indicate where the values are lower bounds (Methods). h, Genetic correlations in the HLA region at our time depth from ancestry-based LD (LDA; Methods; see Supplementary Fig. 50 for LD). We further tested whether co-occurring ancestries at each locus were associated with MS (see Methods and Supplementary Fig. 7) but found no evidence that risk was associated with any ancestry other than steppe ancestry. Having established that steppe ancestry contributes most of the HLA-associated risk for MS, we investigated whether MS risk evolved under selection. We tested for evidence of directional selection across all associated SNPs, decomposed by ancestry, over time. This test used a ‘pathway-based chromosome painting’ technique (see Methods) based on inference of a sample’s nearest neighbours in the marginal trees of an ancestral recombination graph (ARG) that contains labelled individuals11. The resulting ancestral path labels, for haplotypes in both ancient and modern individuals, allowed us to infer allele frequency trajectories for risk-associated variants while controlling for changes in admixture proportions over time. The paths extend backwards from the present day to approximately 15,000 years ago and are labelled with the unique population through which a path travels (ANA, CHG, EHG or WHG). Because it uses distinct pathways, the approach does not use the labels of the relatively recent steppe admixture or outgroup populations, and the path labels are not representative of a continuous population but rather represent a path backwards in time that encompasses the corresponding population. For example, the CHG path originates in the CHG population, before merging with EHG to form the steppe population, and then merges with other ancestries in later European populations (Fig. 1). In our ancestry path analysis, a substantial fraction of the fine-mapped MS-associated variants were not imputed in our ancient dataset, owing to quality-control filtering and the difficulty of accurately inferring HLA alleles in ancient samples18. To address this, we LD pruned genome-wide-significant summary statistics from the same study4, for which we could reliably assign ancestry path labels (n = 62; see Methods). This allowed us to test for polygenic selection across disease-associated variants using CLUES19 and PALM20. For MS, we found evidence that disease risk was selectively increased, when considering all ancestries collectively (P = 1.02 × 10⁻⁵, polygenic selection gradient (ω) = 0.017), between 5,000 and 2,000 years ago (Fig. 5). Conditioning on each of the four long-term ancestral paths (CHG, EHG, WHG and ANA), we found a statistically significant signal of selection in the WHG (P = 7.22 × 10⁻⁵, ω = 0.021), EHG (P = 2.60 × 10⁻³, ω = 0.016) and CHG (P = 3.06 × 10⁻², ω = 0.009) paths but not in the ANA path (P = 0.64, ω = 0.004). Again, it is likely that selection occurred in the pastoralist population of the steppe, as that population consisted of approximately equal proportions of EHG and CHG ancestry21 (Fig. 1). The SNP driving the largest change in genetic risk over time in the pan-ancestry analysis was rs3129934 (P = 1.31 × 10⁻¹¹, selection coefficient (s) = 0.018), which tags the HLA-DRB1*15:01 haplotype22. We also tested three other SNPs that tag the HLA-DRB1*15:01 haplotype (rs3129889, rs3135388 and rs3135391) for evidence of selection and found that the ancestry-stratified signal was consistently strongest in CHG (Fig. 5b). Fig. 5: Evidence for selection on MS-associated SNPs. |
|
|
|
Post by Admin on Jan 22, 2024 21:50:45 GMT
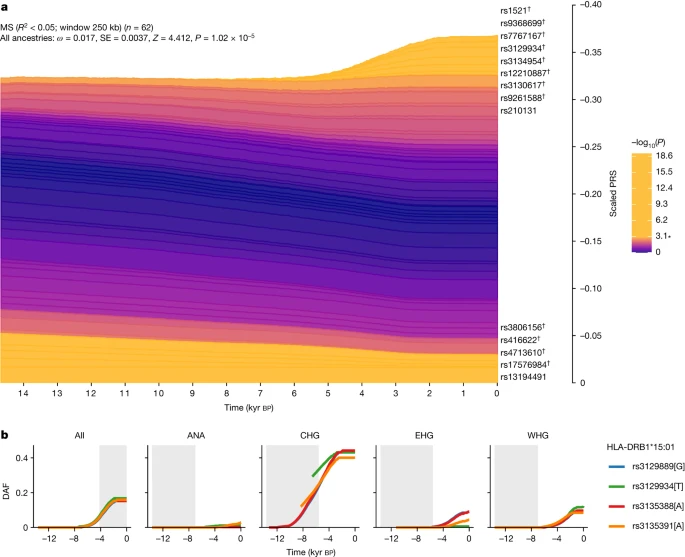 a, Stacked line plot of the pan-ancestry PALM analysis for MS, showing the contribution of SNPs to disease risk over time. SNPs are shown as stacked lines, with the width of each line proportional to the population frequency of the positive risk allele, weighted by its effect size. When a line widens over time, the positive risk allele has increased in frequency, and vice versa. SNPs are sorted by the magnitude and direction of selection, with positively selected SNPs at the top, negatively selected SNPs at the bottom and neutral SNPs in the middle. SNPs are coloured by their corresponding P value in a single-locus selection test. The asterisk marks the Bonferroni-corrected significance threshold, and nominally significant SNPs are shown in yellow and labelled by their rsID. SNPs marked with the dagger symbol are located in the HLA locus. The y axis shows the scaled average PRS in the population, ranging from 0 to 1, with 1 corresponding to the maximum possible average PRS (that is, when all individuals in the population are homozygous for all positive risk alleles), and the x axis shows time in units of thousands of years before the present. SE, standard error. b, Maximum-likelihood trajectories for four SNPs tagging HLA-DRB1*15:01, for all ancestry paths combined (All) and for each path separately (Extended Data Fig. 1 and Methods). Portions of the trajectories with high uncertainty (that is, posterior density of <0.08) have been masked. The background is shaded for the approximate time period in which the ancestry existed as an actual population. The y axis shows the derived allele frequency (DAF), and the x axis shows time in units of thousands of years before the present. Full size image To further examine the nature of selection, we developed a new summary statistic: linkage disequilibrium of ancestry (LDA). LDA is the correlation between local ancestries at two SNPs, measuring whether recombination events between ancestries have occurred at a high frequency compared with recombination events within ancestries. We subsequently defined the ‘LDA score’ of a SNP as the total LDA of the SNP with the rest of the genome. A high LDA score indicates that the haplotype inherited from the reference population is longer than expected, whereas a low score indicates that the haplotype is shorter than expected (that is, underwent more recombination). For example, the LCT/MCM6 region exhibited a high LDA score (Extended Data Fig. 3), as expected from a relatively recent selective sweep23.The HLA region had significantly lower LDA scores than the rest of chromosome 6 (Extended Data Fig. 3). Through simulations, we showed that this signal must have been driven by selection favouring haplotypes of mixed ancestry over single-ancestry haplotypes (Supplementary Figs. 46–48 and Methods). Extending multi-SNP selection models24, our explanation is that at least two separate loci arose selectively in separate populations that later admixed and remained selected in the HLA region, justifying a new term, ‘recombinant-favouring selection’. This means that there was selection for diverse ancestry in the HLA region, driven by recombination. Unlike other measures of balancing selection such as FST, LDA describes excess ancestry LD from specific, dated populations and therefore is an independent signal. For the HLA class II region, the selection measures all lined up (LDA score, FST and π; Extended Data Fig. 4), but for the HLA class I region the LDA score had an additional non-diverse minimum at 30.8 Mb, implying that here the genome is ancestrally diverse but genetically strongly constrained. The LDA score is thus informative about the type of selection being detected and whether it has been subject to change. Because MS would not have conferred a fitness advantage on ancient individuals, it is likely that this selection was driven by traits with shared genetic architecture, of which increased risk for MS in the present is a pleiotropic by-product. We therefore looked at LD-pruned MS-associated SNPs that showed statistically significant evidence for selection using CLUES (n = 32) in one or more ancestries and which also had a genome-wide-significant trait association (P < 5 × 10⁻⁸) for any of the 4,359 traits from the UK Biobank (ref. 10; UK Biobank Neale laboratory, round 2; www.nealelab.is/uk-biobank/) and any of the 2,202 traits in the FinnGen study25. We observed that all selected SNPs were also associated with multiple other traits (Supplementary Figs. 19–27). To determine whether the observed signal of polygenic selection favouring MS risk could be better explained by selection acting on a genetically correlated trait, we performed a systematic analysis of traits in UK Biobank and FinnGen with at least 20% overlap among the MS-associated selected SNPs (n = 115 traits). Using a joint test in PALM specifically designed for disentangling polygenic selection on correlated traits, we found no UK Biobank or FinnGen traits for which the selection signal favouring MS risk was significantly attenuated by selection acting on a genetically correlated trait, when accounting for the number of tests (Supplementary Note 6). This demonstrates that the selection signal for MS could not be explained by selection acting on any genetically correlated trait that we tested. Because both the UK Biobank and FinnGen are underpowered with respect to many traits and diseases, we also undertook a manual literature search (Methods) for all LD-pruned MS-associated SNPs that showed statistically significant evidence for selection using CLUES (n = 32, of which 25 (78%) are in the HLA region). We found that most of the alleles under positive selection were associated with protective effects against specific pathogens and/or infectious diseases (disease or pathogen associated/total selected in ancestry path: pan-ancestry, 11/14; ANA, 8/9; CHG, 6/9; EHG, 6/7; WHG, 17/18; Supplementary Note 8, Supplementary Table 11 and Extended Data Fig. 5), although we note that GWAS data are not available for many infectious diseases. We observed that the selected alleles had protective associations with several chronic viruses (EBV, varicella-zoster virus, herpes simplex virus and cytomegalovirus) and with viruses or diseases not associated with transmission in small hunter-gatherer groups (for example, mumps and influenza). Moreover, many selected alleles conferred a reduction of risk for parasites, for skin and subcutaneous tissue, gastrointestinal, respiratory, urinary tract and sexually transmitted infections, or for pathogens associated with these or other infections (for example, Clostridioides difficile, Streptococcus pyogenes, Mycobacterium tuberculosis and coronavirus) (Supplementary Note 8, Supplementary Table 11 and Extended Data Fig. 5). We emphasize that, although this evidence is strongly suggestive, many of these putative associations may not be statistically robust owing to underpowered GWAS and the bias in candidate gene studies. We compared these findings for MS with results for RA, which in contrast to MS is a systemic inflammatory disease, although it is mostly known for its characteristic joint lesions13. Our findings for RA show a strikingly different ancestry risk profile. HLA-DRB1*04:01 is the largest genetic risk factor for RA; in CLUES analysis, the tag SNP for this allele (rs660895) showed evidence of continuous negative selection until approximately 3,000 years ago (P = 7.95 × 10⁻⁷; Extended Data Fig. 6). We found that WHG and EHG ancestries often conferred the most risk at SNPs associated with RA (relative risk ratio of RA-associated SNPs based on WAP; see Methods), and these ancestries contributed the greatest risk for RA in aggregate, as reflected by a higher ARS for these ancestries (Supplementary Note 4), while the steppe and outgroup ancestries had the lowest scores (Extended Data Fig. 7). These results were recapitulated in a local ancestry GWAS (Supplementary Note 3). We found that RA-associated SNPs have undergone negative polygenic selection (P = 3.26 × 10⁻³; Extended Data Fig. 6) over the last approximately 15,000 years. When decomposing by ancestry path, we found that all paths exhibited a negative selection gradient; none achieved nominal significance, although the CHG path came close (P = 6.33 × 10⁻², ω = −0.014). |
|
|
|
Post by Admin on Jan 26, 2024 22:35:42 GMT
Discussion
The last 10,000 years have seen some of the most extreme global changes in lifestyle, with the emergence of farming in some regions and pastoralism in others. While 5,000 years ago farmer ancestry predominated across Europe, a relatively diverged genetic ancestry arrived with the steppe migrations around this time26,27. We have shown that this genetic ancestry contributes the most genetic risk for MS today and that these variants were the result of positive selection coinciding with the emergence of a pastoralist lifestyle on the Pontic-Caspian steppe and continued selection in the subsequent admixed populations in Europe. These results address the long-standing debate around the north–south gradient in MS prevalence in Europe and indicate that the steppe ancestry gradient in modern populations—specifically in the HLA region—across the continent may cause this phenomenon, in combination with environmental factors. Furthermore, although epistasis between MS-associated variants in the HLA region has been demonstrated before28,29,30,31, we have shown that accounting for this explains more variance than independent SNP effects alone. Many of the haplotypes carrying these risk alleles have ancestry-specific origins, which could be exploited for individual risk prediction and may offer a pathway from genetic ancestry associations to a mechanistic understanding of MS risk. We have compared these findings with results for RA, another HLA class II-associated chronic inflammatory disease, and found that the genetic risk for RA exhibits a contrasting pattern; for RA, genetic risk was highest in Mesolithic hunter–gatherer ancestry and has decreased over time.
Our interpretation of this history is that co-evolution between a range of pathogens and their human hosts may have resulted in massive and divergent genetic ancestry-specific selection on immune response genes according to lifestyle and environment followed by recombinant-favouring selection after these populations merged. Similar examples of pathogen-driven evolution have recently been published32,33. The late Neolithic and Bronze Age were a time of massively increased prevalence of infectious diseases in human populations, owing to increased population density as well as contact with, and consumption of, domesticated animals and their products. The most recent common ancestor of many disease-associated pathogens existed in this period34,35,36,37,38,39,40,41,42; although these diseases are common today, it is difficult to infer their geographical ranges in the past, which may have been more limited43. We have shown that many of the MS- and RA-associated variants under selection confer some resistance to a range of infectious diseases and pathogens (Supplementary Note 8; for example, HLA-DRB1*15:01 is associated with protection against tuberculosis44 and increased risk for lepromatous leprosy45). We were, however, underpowered to detect specific associations beyond this hypothesis owing to poor knowledge of the distribution and diversity of past diseases, poor preservation of endogenous pathogens in the archaeological record and a lack of well-powered GWAS for many infectious diseases, partly owing to widespread vaccination programmes. Together, these findings indicate that population dispersals, changing lifestyles and increased population density may have resulted in high and sustained transmission of both new and old pathogens, driving selection of variants in immune response genes, which are now associated with autoimmune diseases.
A pattern that repeatedly appears is that of lifestyle change driving changes in risk and phenotypic outcomes. Our data indicate that, in the past, environmental changes driven by lifestyle innovation may have inadvertently driven an increase in genetic risk for MS. Today, with increasing prevalence of MS cases observed over the last five decades46,47, we again observe a striking correlation with changes in our environment, including lifestyle choices and improved hygiene, which no longer favours the previous genetic architecture. Instead, the fine balance of genetically driven cell functions within the immune system, which are needed to combat a broad repertoire of pathogens and parasites without harming self-tissue, has been met with new challenges, including a potential absence of requirement. For example, while a population of immune cells, CD4+ T helper type 1 (TH1) cells, direct strong cellular immune responses against intracellular pathogens, T helper type 2 (TH2) cells mediate humoral immune responses against extracellular bacteria and parasites and aid tissue homeostasis and repair. We have shown that the majority of selected MS-associated SNPs are associated with protection against a wide range of infectious challenges, in line with selection for strong but balanced TH1/TH2 immunity in the Bronze Age. The skewed TH1/TH2 balance observed in MS may partly result from the developed world’s increased sanitation, which has led to a substantially reduced burden of parasites, which the immune system had evolved to efficiently combat48.
Similarly, the new pathogenic challenges associated with agriculture, animal domestication, pastoralism and higher population densities might have substantially increased the risk of triggering a systemic RA-associated inflammatory state in genetically predisposed individuals. This could have led to an increased risk of a serious outcome following subsequent infections49, years before any potential joint lesions50, resulting in negative selection and might thus represent a parallel between RA-associated inflammation in the Bronze Age and MS today, in which lifestyle changes have exposed previously favourable genetic variants as risks for autoimmune disease.
More broadly, it is clear that the late Neolithic and Bronze Age were a critical period in human history during which highly genetically and culturally divergent populations evolved and mixed2. These separate histories probably dictate the genetic risk and prevalence of several autoimmune diseases today. Unexpectedly, the emergence of the pastoralist steppe lifestyle may have had an impact on immune responses as great as or greater than that of the emergence of farming during the Neolithic transition, which is commonly held to be the greatest lifestyle change in human history.
|
|

