|
|
Post by Admin on May 13, 2019 18:14:11 GMT
X02	Iru, Harju, EST	BA	1090–910 BCa	M	XY	T1a1b	R1a	0.031
0LS11	Jõelähtme, Harju, EST	BA	1060–850 BCa	M	XY	H1c	R1a1	0.214
V9	Jõelähtme, Harju, EST	BA	1220–1010 BCa	M	XY	K1c1h	R1a1’2	0.474
V14	Muuksi, Harju, EST	BA	1280–1050 BCa	M	XY	U2e2a1	R1a1’2	0.443
X05	Muuksi, Harju, EST	BA	1210–1010 BCa	M	XY	T2a1b1a1	R1a1’2	0.029
X08	Muuksi, Harju, EST	BA	930–810 BCa	M	XY	T2a1b1a2	R1a1c	0.306
X09	Muuksi, Harju, EST	BA	820–770 BCa	M	XY	J1b1a	R1a	<0.017
X10	Muuksi, Harju, EST	BA	1220–1020 BCa	M	XY	U5a2a1	R1a1’2	0.22
X11	Napa, Ida-Viru, EST	BA	1030–890 BCa	M	XY	J1c2k	R1a	0.224
X12	Napa, Ida-Viru, EST	BA	900–790 BCa	M	XY	W6	R1a1’6	0.023
X13	Rebala, Harju, EST	BA	780–480 BCa	M	?	K1b2a	–	<0.017
X14	Rebala, Harju, EST	BA	780–430 BCa	M	XY	H1b2	R1a1c	0.307
V16	Väo, Harju, EST	BA	730–390 BCa	M	XY	H1b2	R1a1’2	0.22
X16	Väo, Harju, EST	BA	1080–910 BCa	M?	XY	J1c4	R1a	0.018
X17	Väo, Harju, EST	BA	930–810 BCa	M	XY	U4a2b	R1a1c	0.387
X18	Väo, Harju, EST	BA?	1200 BC–…b	M	XY	U3b2a	?	<0.017
X19	Väo, Harju, EST	BA	1200–400 BCb	?	XX	U	–	<0.017
X20	Väo, Harju, EST	BA	900–800 BCa	?	XY	U4a2b	R1a	0.085
X15	Vehendi, Tartu, EST	BA	1210–1000 BCa	M?	XY	U5b1b1	R1a1c	0.339
0LS09	Ilmandu, Harju, EST	IA	540–380 BCa	F	XX	H6a1a	–	<0.017
V7	Ilmandu, Harju, EST	IA	790–430 BCa	M	XY	T2a1b1a1	R1a	<0.017
V8	Ilmandu, Harju, EST	IA	730–400 BCc	M?	XX	HV0	–	<0.017
0LS10	Kunda, Lääne-Viru, EST	IA	770–430 BCc	M	XY	H13a1a1a	N3a3′5	0.319
V10	Kunda, Lääne-Viru, EST	IA	790–430 BCa	M	XY	H1a	R1a1c	0.403
V11	Kurevere, Saare, EST	IA	390–200 BCa	M?	XX	W3a1d	–	0.277
V12	Kurevere, Saare, EST	IA	360–40 BCa	M?	XY	I1a1c	N3a3a	0.245
X04	Loona, Saare, EST	IA	480–360 BCa	M	XY	H1c	R1a1’2	0.256
VII3	Poanse, Pärnu, EST	IA	380–180 BCa	M	XY	U5a1d	?	<0.017
VII4	Võhma, Lääne-Viru, EST	IA	760–400 BCa	M	XY	T1a1b	N3a3a	0.342
VII15	Kerstovo, Ingria, RUS	IA	45 BC–77 ADa	?	XY	U5a2a1	R1a	0.244
VIII7	Kerstovo, Ingria, RUS	IA	75–200 ADb	?	XX	H2a1a	–	0.062
VIII8	Kerstovo, Ingria, RUS	IA	75–200 ADb	?	XY	H3h	R1a1c	0.0517
VIII9	Kerstovo, Ingria, RUS	IA	75–200 ADb	?	XX	U4a2	–	0.3
VIII5	Malli, Ingria, RUS	IA	75–300 ADb	?	XX	T1a1b	–	0.398
IIa	Karja, Saare, EST	MA	1230–1300 ADb	M	XY	H3h1	N3a3a	0.734
0LS03	Kukruse, Ida-Viru, EST	MA	1180–1220/1240 ADb	M	XY	U4d1	R1a1a’b	0.0696
IVLS09KT	Mäletjärve, Tartu, EST	MA	1570–1600 ADb	M	XY	H2a1	J2b2	0.332
IIf	Otepää, Valga, EST	MA	1360–1390 ADb	M	XY	T2b	N3a3a	0.206
IIg	Pada, Lääne-Viru, EST	MA	1210–1230/1240 ADb	M	XY	U4a2b	N3a3a	0.102
IIIt	Vaabina, Võru, EST	MA	1250–1450 ADb	F	XX	U5a2a1	–	0.0413
ILS01	Vana-Kuuste, Tartu, EST	MA	1500–1625 ADb	M	XY	H11a1	R1a	0.0827

See also Figure S3, Tables S1 and S2, and Data S2. <0.017, not included in autosomal analyses; Av. cov., average genomic coverage; BA, Bronze Age; EST, Estonia; F, female; Gen., genetic; IA, Iron Age; M, male; MA, Middle Ages; Morph., morphological; MT hg, mtDNA haplogroup; RUS, Russia; Y hg, Y chromosome haplogroup.
We identified chrY hgs for 30 male individuals (Tables 1 and S2; STAR Methods). All 16 successfully haplogrouped EstBA males belonged to hg R1a, showing no change from the CWC period, when this was also the only chrY lineage detected in the Eastern Baltic [11, 13, 30, 31]. Three EstIA and two IngIA individuals also belonged to hg R1a, but three EstIA males belonged to hg N3a, the earliest so far observed in the Eastern Baltic. Three EstMA individuals belonged to hg N3a, two to hg R1a, and one to hg J2b. ChrY lineages found in the Baltic Sea region before the CWC belong to hgs I, R1b, R1a5, and Q [10, 11, 12, 13, 17, 32]. Thus, it appears that these lineages were substantially replaced in the Eastern Baltic by hg R1a [10, 11, 12, 13], most likely through steppe migrations from the east [30, 31]. Although we did not detect N3a chrYs in our BA sample, unlike in BA Fennoscandia [26], we cannot rule out its presence due to small sample size. However, the frequency should not exceed 0.17 with 95% and 0.25 with 99% confidence [33]. The frequency of hg N3a was significantly higher in our IA than our BA group (Fisher’s exact test p value 0.013). Our results enable us to conclude that, although the expansion time for R1a1 and N3a3′5 in Eastern Europe is similar [25], hg N3a likely reached Estonia or at least became comparably frequent to modern Estonia [1] only during the BA-IA transition. Autosomal Ancestries in Estonia from the Bronze Age Onward To assess whether the Eastern Eurasian influence indicated by chrY hg N3a is apparent elsewhere in the genome, we first applied principal-component analysis (PCA). We projected ancient genomes from previous studies (Table S3) and this study on two axes inferred using Estonian Biocenter Illumina genotyping array data (EBC-chipDB) of modern Western Eurasian individuals (Table S3) (Figure 1C). A clear shift toward West Eurasian hunter-gatherers is visible between European LN and BA (including Baltic CWC) and EstBA individuals, the latter clustering together with Latvian and Lithuanian BA individuals [11]. EstIA, IngIA, and EstMA individuals project between BA individuals and modern Estonians, partially overlapping with both. We performed ADMIXTURE analysis by projecting aDNA data on worldwide EBC-chipDB modern data (Figures S1C and S1D; Table S3) and present results at K = 9 (Figures 1B, S1A, and S1B; STAR Methods). EstBA individuals are clearly distinguishable from Estonian CWC individuals as the former have more of the blue component most frequent in WHGs and less of the brown and yellow components maximized in Caucasus hunter-gatherers and modern Khanty, respectively. The individuals of EstBA, EstIA, IngIA, EstMA, and modern Estonia are quite similar to each other on average, indicating that the relatively high proportion of WHG ancestry in modern Eastern Baltic populations compared to other present-day Europeans [15] traces back to the BA. When comparing Estonian CWC and EstBA using autosomal outgroup f3 and Patterson’s D statistics (Table S3), the latter is more similar to other Baltic BA populations, to Baltic IA and Middle Age (MA) populations, and also to populations similar to WHGs and Scandinavian hunter-gatherers (SHGs), but not to Estonian CCC (Figures 2A and S2A; Data S1). The increase in WHG or SHG ancestry could be connected to western influences seen in material culture [20, 21] and facilitated by a decline in local population after the CCC-CWC period [20]. A slight trend of bigger similarity of Estonian CWC to forest or steppe zone populations and of EstBA to European early farmer populations can also be seen. These differences remain when over 900,000 positions of the ‘1240k’ capture [16] are used instead of ∼500,000 positions of the EBC-chipDB (Figure S2B; Data S1). When comparing to modern populations, Estonian CWC is slightly more similar to Caucasus individuals but EstBA to Baltic populations and Finnic speakers (Figure 2B; Data S1). Outgroup f3 and D statistics do not reveal apparent differences when comparing EstBA to EstIA, EstIA to IngIA, and EstIA to EstMA (Data S1). These results highlight how uniparental and autosomal data can lead to different demographic inferences—the genetic change between CWC and BA not seen in uniparental lineages is clear in autosomal data and the appearance of chrY hg N in the IA is not matched by a clear shift in autosomal profiles.  Figure 2 Outgroup f3 Statistics Results We also tested for sex biases by comparing outgroup f3 statistics calculated on autosomal (A) and X chromosomal (X) data. The high X-to-A ratio of European-early-farmer-related ancestry observed in Estonian CWC [13] decreases over time and disappears by the MA (Figures S2C–S2F; Data S1). We used ChromoPainter-non-negative least squares (NNLS) in the unlinked mode and qpAdm to infer mixing proportions of proxy source populations forming the genetic structure of the study populations. The best model for both analyses included WHG, Yamnaya, Central European Middle Neolithic (Central MN), and modern Nganasans as sources (STAR Methods; Data S1). The study populations have on average 36% or 20% WHG-, 42% or 51% Yamnaya-, and 21% or 26% Central-MN-related ancestry as estimated by ChromoPainter or qpAdm (Figure 3; Data S1). The differences in WHG- and Yamnaya-related ancestry of the two methods could be due to the large amount of shared ancestry between those populations. Importantly, both analyses differentiate EstBA from other study populations—EstBA individuals have no Nganasan-related ancestry and EstIA, IngIA, and EstMA individuals on average have 2% or 4% (Figure 3; Data S1). The differentiation remains when using BA or IA Fennoscandian populations [26] instead of Nganasans (Data S1). Notably, the proportion of Nganasan-related ancestry varies between 0% and 12% among sampled EstIA, IngIA, and EstMA individuals (Data S1), which may suggest its relatively recent admixture into the target population. Moreover, two individuals from Kunda (0LS10 and V10) have the highest proportions of Nganasan ancestry among EstIA (6% and 8%), one of them has chrY hg N3a, and isotopic analysis suggests neither individual being born in Kunda [34]. |
|
|
|
Post by Admin on May 14, 2019 18:34:49 GMT
 Figure 3 ChromoPainter-NNLS and qpAdm Results To consolidate the previously described evidence of genetic input from Siberia, we applied f4 statistics (Data S1). A direct comparison between EstBA and EstIA suggests a closer affinity of EstIA to Siberian proxy Nganasan, but the result is non-significant (|Z| = 2.6). However, modern Estonians are significantly closer to Nganasan than EstBA (|Z| = 5.6), and there is no significant difference between modern Estonians and EstIA in that regard (|Z| = 1.2). Tests where Nganasans are replaced with Koryaks yield similar results, consistent with the signal relating to Siberian ancestry in general (Data S1). Additionally, the difference between EstBA and EstIA in their affinity to Nganasan can be seen through comparisons with preceding Central European LN and BA (|Z| = 0.2 and 3.2, respectively). Furthermore, EstBA had a significantly higher affinity to WHGs than preceding CWC (|Z| = 8.7) or modern Estonians (|Z| = 5.1). We also tested the increase in affinity to Near Eastern populations between EstBA and modern Estonians seen on PCA and found that the latter share significantly more drift with modern Syrians than either EstBA or EstIA (|Z| = 4.9 or 3.9). We then replaced Syrians with Yamnaya Kalmykia (|Z| = 1.2 or 0.6) and Central MN (|Z| = 3 or 2.6). This indicates a slight increase in early farmer ancestry from EstBA and EstIA to modern Estonians. Finally, we performed formal tests of continuity between individual genomes of this study and modern Estonians. We found that population continuity can be rejected for most scenarios (Data S1; p < 0.05; colored gray; Figure S3E). Taking into account modern Estonian effective population size (STAR Methods), continuity cannot be fully rejected only if the ancient sampling populations had an effective size of a few hundreds (Data S1; p > 0.05; colored yellow to red; Figure S3E). A Case of Close Genetic Relatedness between Two Stone-Cist Grave Groups We screened the BA, IA, and MA individuals for the presence of closely related pairs using relationship estimation from ancient DNA (READ) and discovered that two BA individuals, X14 and V16, were 2nd degree relatives (Figures S3A–S3C). These individuals also shared mtDNA hg H1b2 and—like all EstBA males—chrY hg R1a (Table 1). Although chrY coverage is not sufficiently high to determine how closely related these individuals are patrilineally, their haplotypes matching across the entire mtDNA genome suggests that they were half-brothers sharing their mother or an uncle and his sister’s son. Notably, the two related individuals were not buried in the same site but 13 km apart. Given the small number of just sixteen stone-cist burials available for kinship analyses from a time span of ∼500 years, the finding of cross-site relatedness supports the notion that these structures were built for a limited circle of people [35], possibly the elite. The plateau in the calibration curve hinders precisely estimating the chronological separation between the radiocarbon dates of X14 (2,481 ± 30 before present [BP]) and V16 (2,399 ± 27 BP), with a 95% highest posterior density (HPD) −76 to 344 years (V16 dying 76 years earlier to 344 years later than X14). Given the estimated ages at death (35–45 for X14; 30–40 for V16; Table S1), female reproductive age 13–40, and assuming X14 to be the uncle of V16, the biologically plausible difference in time of the two individuals dying is −29 to 72 years (STAR Methods). This interval is associated with a probability of 0.15 and is within the 95% HPD; hence, the radiocarbon dates do not reject the relatedness inferred from aDNA. The plausible range of difference in time of deaths in case of V16 being the uncle is −82 to 19 years, and in case V16 and X14 were half-brothers, this becomes −42 to 32 years. Both temporal intervals are less likely than the scenario described above (probability 0.08.)  Frequency Changes of Phenotype Informative Alleles in the Eastern Baltic We imputed the genotypes of 37 phenotype informative SNVs from the HIrisPlex-S system, two from TLR1, and one from MCM6 gene and a 32-bp deletion (rs333) in the CCR5 gene for Mesolithic and Neolithic individuals from Latvia and Estonia [10, 13] and the individuals of this study. We inferred a sharp increase to >50% in the frequency of the lactase persistence variant (MCM6/rs4988235) in the Baltic area after the LN (Data S2), in line with previous indications of this variant becoming common in Europe in the last 4,000–3,500 years [31, 36] and of its fast increase in populations with steppe ancestry due to local adaptation [37]. In contrast, the rs333, responsible for HIV resistance, which we first detect in a CWC individual, remains at 10%–25% frequency since then (Data S2), comparable to its present-day 14.8% frequency in Estonia [38]. Both TLR1 variants involved in the protection against leprosy were already present in Europe at medium-high frequencies since the Mesolithic [16, 39] (Data S2). Notably, we infer a high proportion (40%–60%) of dark skin pigmentation in the hunter-gatherers and CWC farmers (Data S2). We infer dark skin and blue eyes for two individuals, similarly to another European Mesolithic individual [39]. However, from BA onward, we infer pale or intermediate skin pigmentation for all individuals and an increase in the proportion of blue eyes and lighter shades of hair (Data S2). This is in line with previous suggestions that light skin pigmentation alleles reached high frequencies in Europe only recently [40]. Conclusions We show that a component of possibly Siberian ancestry was added to the gene pool of the Eastern Baltic during the Bronze to Iron Age transition at the latest. This component is present in the autosomes and chrY of many northeastern European Uralic-speaking populations today [5, 26] but arrived in the Eastern Baltic probably later than 3,500 years ago (ya), when it reached Fennoscandia [26]. Considering the archaeological context of the individuals, this seems to have followed the so-called southwestern route from the Volga-Ural region [20, 21]. Notably, the Bronze to Iron Age transition period also coincides with the hypothesized arrival of westernmost Uralic (Finnic) languages [6] in the Eastern Baltic, supporting the idea that the spread of these languages was mediated by IA migrants from the east. The EstBA individuals of this study, as other Baltic BA individuals [11], display more WHG ancestry compared to both earlier CWC and modern Estonians. Interestingly, we do not detect this change in their uniparental lineages. However, half of the admittedly small EstIA sample and over one-third of modern Estonian men [1] share a hg N3a chrY—common in other Uralic-speaking populations living much further east [1, 2, 3, 4, 5] and not found in the Eastern Baltic earlier—although the autosomes of EstIA individuals only show 3%–5% Siberian ancestry on average. Furthermore, phenotypic characteristics often associated with modern Northern Europeans (light eyes, hair, and skin pigmentation and lactose tolerance) can be traced back to the Bronze Age in the Eastern Baltic. Current Biology, Saag et al.: "The Arrival of Siberian Ancestry Connecting the Eastern Baltic to Uralic Speakers further East." Published:May 09, 2019 |
|
|
|
Post by Admin on Aug 1, 2019 21:03:47 GMT
Exome sequencing of Finnish isolates enhances rare-variant association power Adam E. Locke, Karyn Meltz Steinberg, […]Nelson B. Freimer Nature (2019) Abstract Exome-sequencing studies have generally been underpowered to identify deleterious alleles with a large effect on complex traits as such alleles are mostly rare. Because the population of northern and eastern Finland has expanded considerably and in isolation following a series of bottlenecks, individuals of these populations have numerous deleterious alleles at a relatively high frequency. Here, using exome sequencing of nearly 20,000 individuals from these regions, we investigate the role of rare coding variants in clinically relevant quantitative cardiometabolic traits. Exome-wide association studies for 64 quantitative traits identified 26 newly associated deleterious alleles. Of these 26 alleles, 19 are either unique to or more than 20 times more frequent in Finnish individuals than in other Europeans and show geographical clustering comparable to Mendelian disease mutations that are characteristic of the Finnish population. We estimate that sequencing studies of populations without this unique history would require hundreds of thousands to millions of participants to achieve comparable association power. A new study harnessed the unique genetic history of the people of Finland to identify variations in DNA that might predispose certain individuals to disease, whether or not they are Finnish themselves. The study was conducted by researchers at Washington University School of Medicine in St. Louis, in collaboration with the University of California, Los Angeles; the University of Michigan and other institutions, including several partners in Finland. 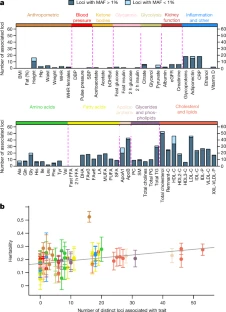 Fig. 1: Characterization of associations. The research, published July 31 in the journal Nature, identified 26 potentially harmful DNA variations relevant to cardiovascular and metabolic health. For example, such variations might alter a person's lifetime risk of developing obesity, diabetes or high cholesterol levels. Though this analysis is just a starting point to delve more deeply into the health consequences of these types of DNA variants, the study is an important milestone in demonstrating the effectiveness of this population approach to genetic research. Of the 26 DNA variations identified, 19 are either unique to Finnish individuals or over 20 times more frequent in Finland compared with elsewhere in Europe. 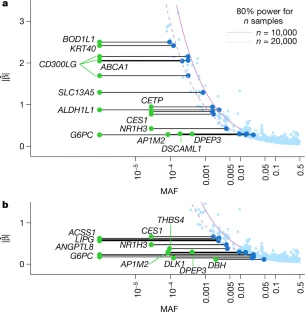 Fig. 2: Allelic enrichment in the Finnish population and its effect on genetic discovery. Without this unique population—isolated and relatively genetically similar—the researchers estimate they would need to sequence the DNA of hundreds of thousands to millions of people to find these same associations, rather than the relatively manageable 20,000 individuals analyzed in this study. 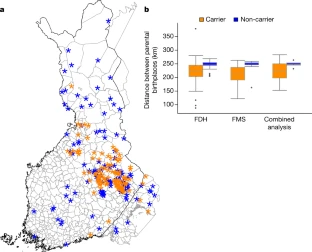 Fig. 3: Geographical clustering of associated variants. According to the investigators, this study is among the most comprehensive examinations of the impact of coding variation—DNA changes that impact protein structure and function—on measures of cardiovascular and metabolic health, an endeavor greatly facilitated by Finnish population history. 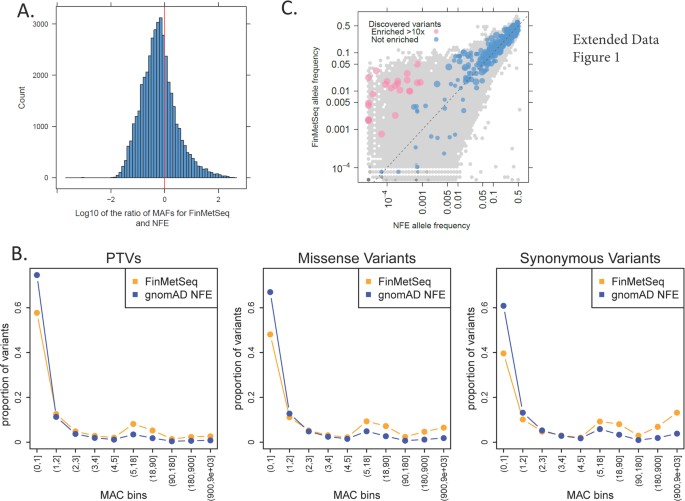 Extended Data Fig. 1 Allele frequency comparisons between FinMetSeq and NFE from gnomAD. "The small population of people who first settled this part of the world—combined with relatively little immigration that would add variation to the gene pool—has pushed important genetic variants that first existed in the founding population to expand and become much more common than they would be elsewhere," said first author Adam E. Locke, Ph.D., an assistant professor of medicine at Washington University School of Medicine in St. Louis. "Now we can delve into the patient data—which is extremely well-characterized through Finland's national health-care system—to understand how these genetic variants influence overall health and disease risk in the people who have them." |
|
|
|
Post by Admin on Dec 20, 2019 21:51:11 GMT
Abstract Human ancient DNA studies have revealed high mobility in Europe’s past, and have helped to decode the human history on the Eurasian continent. Northeastern Europe, especially north of the Baltic Sea, however, remains less well understood largely due to the lack of preserved human remains. Finland, with a divergent population history from most of Europe, offers a unique perspective to hunter-gatherer way of life, but thus far genetic information on prehistoric human groups in Finland is nearly absent. Here we report 103 complete ancient mitochondrial genomes from human remains dated to AD 300–1800, and explore mtDNA diversity associated with hunter-gatherers and Neolithic farmers. The results indicate largely unadmixed mtDNA pools of differing ancestries from Iron-Age on, suggesting a rather late genetic shift from hunter-gatherers towards farmers in North-East Europe. Furthermore, the data suggest eastern introduction of farmer-related haplogroups into Finland, contradicting contemporary genetic patterns in Finns. 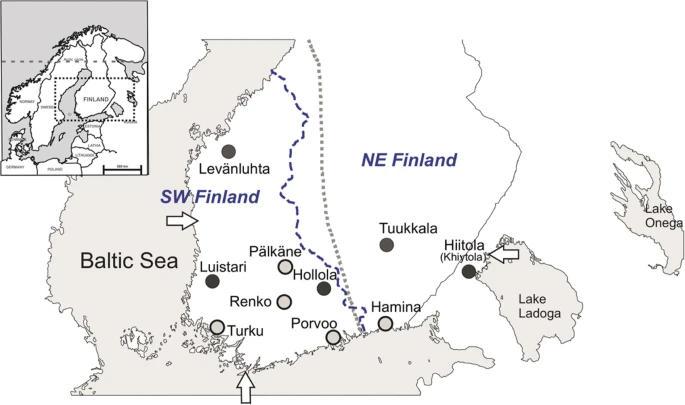 Figure 1 Map of Finland and the burial sites presented in this study. Iron-Age and medieval sites (Levänluhta, Luistari, Hollola, Hiitola and Tuukkala) are marked with dark grey circles. Early-modern and modern sites (Pälkäne, Porvoo, Renko, Turku and Hamina) are marked with light grey circles. Arrows indicate three reference points (Hanko, Uusikaupunki and Lahdenpohja) used in the multinomial logistic regression analysis (see Section 2.7). Small map of northern Europe is modified from Neuvonen et al.28. Blue dashed line represents the border of southwestern (SW) and northeastern (NE) subpopulations of contemporary Finns (Neuvonen et al.28 was used as a reference for this border). Grey dotted line represents the boundary of Finnish folk culture between western and northeastern Finland described in Talve 200074. Introduction Genetic studies on anthropological remains have exceedingly helped to shed light on various human populations as well as past events and processes. These include for instance the initial colonization of Europe by modern humans c. 40 kya1,2, the Holocene hunter-gatherer communities1,3, the major population turnover associated with the Neolithic spread of agriculture from Anatolia3,4,5, and the massive Bronze-Age influx of genes, culture and customs of the Yamnaya-related people into Europe from the Pontic-Caspian steppe6,7. In terms of mitochondrial DNA (mtDNA), these cultural turnovers and population migrations in Europe involved also changes in the haplogroup composition. In hunter-gatherer populations the dominating mitochondrial lineage has been U, especially its subgroups U4, U5a and U5b3. In the advent of the Neolithic revolution, these U subgroups were largely supplanted by farmer-associated haplogroups H, HV, J, K, N1a, T2 and W4,5. The subsequent spread of Yamnaya-related people and Corded Ware Culture in the late Neolithic and Bronze Age were accompanied with the increase of haplogroups I, U2 and T1 in Europe (See8 and references therein). Whereas the ancient DNA (aDNA) composition and its changes in mainland Europe are increasingly well understood, northeastern Europe has been far less studied. The oldest human DNA analyzed in this region derive from the Mesolithic burial sites in Huseby Klev, western Sweden (9800 calBP9), Hummervikholmen in Norway (9300 calBP10) and Yuznuy Olennij Ostrov on Lake Onega, Russia (~8400 calBP7,11). In addition, Mesolithic to Bronze-Age DNA data from several sites in the Baltic countries have been published6,12,13,14. Despite the relatively close geographical proximity, little is known about the ancient DNA diversity in regions immediately north of the Baltics. This is largely due to the scarcity of preserved anthropological remains. In the hemiboreal forest zone the soil pH, together with annual freeze-thaw cycles has highly detrimental effects on bone material to the extent to which no unburnt remains older than ~2000 years exist15. However, archaeological evidence strongly suggests that the most notable colonization events in the region have taken place much earlier16,17. Consequently, the lack of archaeological bone material gravely limits the capability of aDNA studies in resolving the human population history of the Taiga belt and the processes that have shaped present-day diversity. Despite these shortcomings, aDNA has recently been recovered from c. 1500 year-old bones from Levänluhta in western central Finland18,19. Genomic data from these samples show a Siberian ancestry component still prominently present today, particularly in the indigenous Saami people, and to a lesser extent in modern Finns. Although these data suggest a widespread presence of genetically Saami-like people around eastern Fennoscandia during the Iron Age, more wide-spread sampling in space and time is necessary for understanding the past population dynamics, and emerging of the contemporary genetic diversity in Finland. In terms of both genetics and culture, modern Finns show a unique combination of eastern and western European elements, which most likely reflects the settlement history. The first archaeological evidence of human presence in Finland dates relatively late to c. 11000–9000 years ago, soon after the continental ice sheet retreated. According to the archaeological record, the region has since supported a continuous human occupation until today17. Several influential waves of material culture have been shown to extend into Finland: the first one brought the Sperrings or Säräisniemi pottery to the area c. 7500 years ago20, the second presented the typical Comb-Ceramic at 6000 years ago16,17, one of the most influential prehistoric cultures in the wider region. Finally, around 4700 years ago, the Corded-Ware culture reached Finland16,17,21. The most significant cultural changes, possibly driven by expansions, proceeded from east/south-east and extended into most of today’s territory of Finland, while the Corded-Ware culture influence spread from south occupying only the southwestern part of Finland. Later, Bronze Age brought an increase of human activity17 and coinciding advance of cereal cultivation22. Finland also saw a pronounced Scandinavian impact along the western coast, while the inland was dominated by eastern influences, seen e.g. in the arrival of ferrous metallurgy c. 500 BC and stylistic features of Bronze-Age and Iron-Age items21. Iron Age in Finland starts around 500 BC and continues until the end of Crusade period (c. 1200 AD in west and 1300 AD in east). Unlike most of the Europe, the Middle Ages starts as late as 1200 AD in western parts of country and 1300 AD in east and shifts into Early modern period in the beginning of 16th century (for a review of archaeological and historical periods in Finland see21). Linguistically, contemporary Finns and Saami differ from most other Europeans in speaking a Uralic language, unrelated to the majority of European languages, which belong to the Indo-European language family. Finns are also genetically distinct from their neighboring populations and form outliers in the genetic variation within Europe23. This genetic uniqueness derives from both reduced genetic diversity24,25 and an Asian influence to the gene pool24. Within Finland, an unusually strong genetic border bisects the population along a northwest to southeast axis24,26,27, and is interpreted to reflect an ancient boundary between hunter-gatherer and farmer populations28. The expanse of agriculture north-east of this border was probably limited by environmental factors, especially the length of the growing season. Later, this border has most likely acted in demarcating the spread of western and eastern political and cultural impacts influencing the placement of first political border between Sweden and Novgorod through the middle of Finland (Treaty of Noteborg 1323 AD). In order to gain better insight into the genetic history of Finns, we here describe 103 complete mitochondrial genomes reconstructed from bone samples from ten burial sites in southern Finland and the Republic of Karelia, Russia (former Finnish territory; Fig. 1). The main focus is on the 70 complete mitochondrial genomes from five archaeological burial sites in Finland spanning spatially from western coast to Lake Ladoga, and Late Roman Iron Age (300 AD) to the Middle Ages (1500 AD) (Tables 1, S1 and Supplementary Material S1). In addition, we include 33 mitochondrial genomes from later, mainly historical burials (1400–1800 AD) from five sites across southern Finland. While mtDNA genomes of Iron-Age and Early-Medieval Finland cannot be used to directly target questions about the colonization of Finland, they provide a spatio-temporal transect to the maternal ancestry of the early inhabitants in this region, and help to understand patterns observed in Finland’s modern mtDNA diversity. |
|
|
|
Post by Admin on Dec 21, 2019 18:23:56 GMT
Results Authenticity of ancient-DNA results Based on the shotgun sequencing, out of the total of 141 individuals sampled, 134 were included in mitochondrial capture. Mitochondrial genomes for 103 individuals passed the quality control thresholds, while 31 samples were excluded from further analyses due to insufficient data (less than fivefold mitochondrial coverage) or high contamination levels (Supplementary Table S1). Ancient-DNA yield for all 103 samples was studied with several criteria of authentication. All samples showed fragment sizes ranging between 40–250 bp, as expected for ancient DNA29. Fragments under 30 bp were filtered out as a mapping quality control. All samples had an average fragment length of 47 to 95 bp. The authentic ancient DNA is often fragmented compared to the modern DNA, and fragments as short as 50–65 bp are common. The samples included in the downstream analyses yielded between 1426 and 395345 unique human mitochondrial fragments with an average coverage ranging from 5-fold to 1683-fold. The first-base damage on the fragments varied between 5–36% on the 3′-end and 4–34% on the 5′-end. Previous studies have proven that cytosine deamination is influenced by the age of the sample30,31 and the mean temperature of the site31. Considering the climatic conditions in Finland, e.g., low mean temperature, and the relatively young age especially for the post-medieval samples, 3′ and 5′ damage values below 5% are plausible. No samples were therefore omitted from the study based on these criteria. The contamination rates of the 103 samples were further evaluated by Schmutzi32. 36 samples had Schmutzi contamination estimates exceeding 5% and were excluded (Supplementary Table S1). The remaining samples were then analyzed with ContamMix33: the resulting crude contamination estimates as well as the a posteriori estimates of contamination along with their 95% confidence intervals (CI) from the MCMC are reported in Supplementary Table S1. The CIs ranged from 0% to 17.2%; in ten cases they exceeded 10%, even though estimates by Schmutzi had remained below 5%. These cases were visually inspected with Geneious 11.0.3 (www.geneious.com). For each of them, the majority call supported the previously assigned haplogroup. Radiocarbon datings For this study, we report new 14C dates for 42 individuals (Supplementary Table S1). Radiocarbon dates for nine individuals were determined previously (see Supplementary Table S1). Based on radiocarbon dates and/or dating of the context, the studied burial sites cover the timespan from the Roman Iron Age (300 AD) to historical times (19th century). For sites Levänluhta, Luistari, Hollola, Hiitola, Tuukkala, Pälkäne and Porvoo the highest posterior densities (HPD) for site’s start and end boundaries were determined. The mean values for obtained phase boundaries are presented in Table 1, and 68% and 95% HPD regions are presented in Supplementary Table S2 and in Supplementary Fig. S1. Intervals for mean values of boundaries obtained based on radiocarbon dates were in accordance with dates determined based on the archaeological context (Table 1). MtDNA data and haplotypic variation A total of 95 unique complete-mitogenome haplotypes were observed among the 103 complete sequences retrieved: three haplotypes were shared between sampling sites and five within a site. In the latter cases, the placement of the skeletal samples suggests that the shared haplotypes have been carried by different individuals, who may have been maternally related: identical haplotypes (haplogroup U5a2a1e) were obtained from remains of a c. 5-year-old child (grave 18, TU666) and an older woman (grave 7, TU655) from Hollola. Identical haplotypes (haplogroup H85) were also observed in a middle-aged adult (grave 6, TU661) and a c. 18-month-old child (grave 15, TU668) from Hollola. At the Hiitola site, identical haplotypes (haplogroup W6) were shared between two individuals from distinct graves (individual TU566 from grave 80 and individual TU675 from grave 30). At the Tuukkala site, two individuals showed identical haplotypes (haplogroup H10e, individuals TU631 and TU645). At Turku, two adults shared the same haplotype belonging to the basal haplogroup H (samples TU582 and TU588). Haplotypes for 103 individuals are presented in Supplementary Table S3. As the subsequent statistical methods assume that samples derive from unrelated individuals, five samples - one of each identical haplotype pairs within sites (TU666, TU668, TU675, TU645 and TU588) - were removed from the subsequent analyses due to their possible maternal relatedness. The mean number of pairwise differences, calculated from complete mitochondrial genomes, was highest within Porvoo (MNPD = 33.7 ± 16.8) and lowest within Renko (MNPD = 21.8 ± 10.8) (Supplementary Table S4). Due to the small number of individuals per site and utilization of unique complete mtDNA sequences, haplotype diversities (H) were relatively high (with mean 1.0 and standard deviation ranking from 0.0202 to 0.1768). MtDNA haplogroup composition at the ancient sites Burial site-specific haplogroup frequencies of the 98 complete mitochondrial sequences showed considerable between-site variation (Fig. 2 and Supplementary Table S5). The observed frequencies of the main haplogroups in the whole dataset resembled the prevalence among contemporary Finns. As today, haplogroups U and H were the most common, yet with slightly higher overall frequencies than today (U 33.7% vs. 24.1%, and H 41.8% vs. 33.2%). However, when grouped temporally into Iron-Age and medieval sites (IAM) and early-modern and modern sites (EMM), differences were observed: the IAM sites (i.e., Levänluhta, Luistari, Hollola, Hiitola and Tuukkala) demonstrated significantly higher overall prevalence of haplogroup U (40.9%) than the EMM sites (i.e., Pälkäne, Porvoo, Renko, Turku and Hamina, 18.8%) but also high inter-site variability. Among the EMM samples haplogroup H dominated (U 18.8%, H 46.9%). 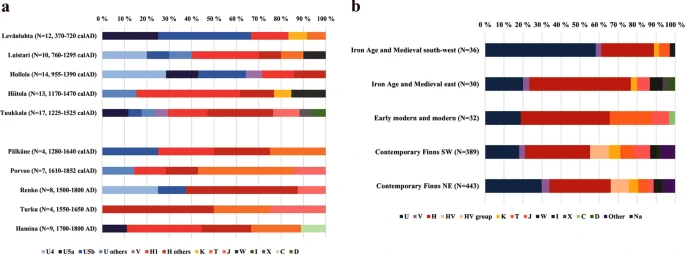 Figure 2 This inter-site variability of the haplogroup U/H ratio had a clear spatial pattern also among the IAM samples. The western cluster (IAM south-west: Levänluhta, Luistari and Hollola) had average U and H frequencies of 58.3% and 27.8%, respectively, whereas the corresponding values in the eastern cluster (IAM east: Hiitola, Tuukkala) were 20.0% and 53.3%. In IAM east the highest frequency for an individual subhaplogroup was 30.0% obtained for H1. Strikingly, this U/H ratio is the opposite compared to contemporary eastern and western Finns. Differences in haplogroup composition between the sites Among the 12 Levänluhta samples, five individuals carried haplogroup (hg) U5b, four of which belonged to the sub-hg U5b1b1a. Additionally, the Levänluhta site included three individuals with hg U5a, resulting in a total frequency of 66.7% for hg U5. In contrast, with only two haplotypes of sub-hg H1, the frequency of hg H was well below values observed in modern European populations. The high U5b1b1a frequency resembles that observed today in Saami populations of northern Europe. This actually corresponds well to a related recent study that is showing the close genetic affinity between Levänluhta individuals and modern Saami18. However, the Levänluhta individuals also carried mtDNA haplogroups that are absent or rare among the Saami population today, U5a, H1 (0.0–4.0%34) and haplogroups K and T. The Levänluhta site clearly showed a unique composition, which resulted in significant genetic distances to all other ancient sites at sequence level, with ΦST values of >10% (see below). Individuals from the Hollola site, 14C dated to 955–1390 calAD (Table 1), also showed a high overall frequency of hg U (64.3%), similar to Levänluhta. However, differences in subhaplogroup distribution between Hollola and Levänluhta suggest a possible non-modern-Saami-like hunter-gatherer ancestry in this region. Interestingly, subhaplogroup U5b1b1a, typical among contemporary Saami, was not observed in Hollola. In contrast, most of the Hollola U haplotypes belong to haplogroups U4 and U5a (frequencies in Hollola 28.6% and 14.3%, respectively), which are rare or absent in Saami today34. Moreover, U4 is also rare in modern Finns while the frequency for U5a is around 6%28,35. Haplotypes belonging to different subhaplogroups of hg H were more common in Hollola than in Levänluhta, occurring in altogether five samples. Haplogroups K and T were absent in the Hollola sample. A rather different picture emerged from the Luistari samples, showing a substantial genetic distance to Levänluhta (ΦST = 0.134, p < 0.01). Haplogroup U5b1 was entirely absent, and the U haplotypes observed belong to subhaplogroup U4, U5b2 and U2. Lineage U2 is prevalent in some Uralic speaking groups today36. The overall haplogroup distribution in Luistari was more similar to the modern European populations dominated by agriculture-associated Neolithic haplogroups H and occurrences of T2 and W1 (see Introduction), than in Levänluhta and Hollola sites. The two easternmost sites, Hiitola and Tuukkala, proved genetically distant from the western Levänluhta and Hollola sites, despite being approximately contemporaneous with the Hollola individuals. The Neolithic signal in the mtDNA gene pool of ancient Finns in general was much stronger in the east. Both Hiitola and Tuukkala samples showed high frequencies of hg H (61.5% and 47.1%, respectively), together with other Neolithic haplogroups J, K, W and X. Notably, these eastern sites shared three haplogroups: H1a7, H1a8a and H10g. According to GenBank searches these three haplogroups are rare in modern populations: for H1a7 four modern sequences were found, two in Finnish (KY620272 and MF686118), one in Swedish (KJ487971) and one in British (GU797829) populations. For haplogroup H1a8a only two matches were found, one among Finnish (JX153203) and one of an unknown origin (JQ701944), whereas three modern sequences were found for haplogroup H10g: two Finnish (KR732275 and MF497508) and one from Russia (GU122976). Notably, H1* are known to be common in modern Karelia37. The eastern sites also comprise rare subhaplogroups U1 (hg U1b2 in Hiitola) and U8 (hg U8b1a2b in Tuukkala), which are atypical for contemporary Finns. Early modern and modern sites represents similar frequencies of U and H as the combined Iron Age and Medieval East (18.8% and 46.9%, respectively). Contrasting IAM sites and contemporary Finns, EMM sites harbors high prevalence of haplogroup T; frequency in EMM is as high as 21.9%, while in other Finnish populations the frequency is less than 8% (Supplementary Tables S5 and S8). Individual JK1954 from Hamina belonged to haplogroup C, which is lacking from contemporary Finns28 (Supplementary Table S5) and suggests possible eastern origin. Nevertheless, additional autosomal data is needed to confirm the genetic background of the individual JK1954. When contrasted with haplogroup frequencies observed in contemporary Finns, our simulations (Supplementary Fig. S2) showed that the ancient sites are significantly different, and that these differences cannot be explained by sampling effects. This applied especially to haplogroup U5 in total and to subhaplogroup U5b in Levänluhta, hg U4 in both Luistari and Hollola as well as hg H1 in the Hiitola dataset. |
|

