|
|
Post by Admin on Oct 30, 2020 5:34:54 GMT
We identified and dated admixture events with Globetrotter using the clusters defined in figure 2 (figure 3). We focused on Tuscany, Iberia and the Canary Islands, three populations that surround North Africa for which there is documented contact with North Africa [28,29,39–42], in order to dissect possible admixture events between these geographical areas. We also tested admixture in the Basque population, but no admixture was detected. Assuming a single date of admixture per group, different times of admixture were inferred for the three populations: in Tuscany, the mean estimated admixture time after 100 bootstrap iterations was 485 ± 19 Current Era (CE); in the Iberian Peninsula the estimated gene-flow was dated to 1000 ± 9 CE; and, finally, in the Canary Islands the estimated date of admixture with North Africa was 1555 ± 7 CE (electronic supplementary material, figure S4 and table S2). However, while the data strongly supports a single event of North African admixture in Tuscany; in the Canary Islands and the Iberian Peninsula a history of multiple episodes of gene-flow cannot be ruled out, according to the goodness-of-fit test for two admixture events (electronic supplementary material, figure S5). The Globetrotter manual notes that the program concludes ‘multiple dates’ of admixture when its goodness-of-fit score for two dates relative to the fit of one date is above 0.35 which are based on simulation results [24]. In our dataset, 7% and 3.5% of the bootstraps exceed 0.30 for the Canary Islands and Iberian Peninsula, respectively (electronic supplementary material, figure S5).  Figure 3. Globetrotter admixture results for the three geographical regions analysed (Tuscany, Iberia and the Canary Islands). The mean admixture date and confidence intervals for each admixture event are shown above the graphs. The geographical locations of surrogates that contribute more than 2.5% are coloured in the maps, with circle sizes showing the proportion of contribution. Coloured areas boundaries are defined by the genetic clusters' geographical distribution. Each different shade of grey corresponds to a different admixing source group, with the surrogates representing that source group linked via a continuous or dashed line. The pie in each graph shows the proportion inferred from each admixing source for the given target population (Tuscany, Iberia or the Canary Islands, respectively). The sources inferred in the admixture events are also different in each of these three populations. In Tuscany, Globetrotter concludes a simple admixture event between two sources (figure 3). The major source is inferred to be related to present-day European groups, with the largest component being Iberian-like but with an additional northwestern European-like component. The minor contributing source inferred for Tuscany relates genetically to individuals from the Mediterranean shore of North Africa, though this minor source also contains an Iberian component. By contrast, in the Iberian Peninsula we detected a more complex pattern of gene-flow of a three-way admixture between a North African-like source from the Mediterranean shore, a Basque-like source and a European-like source with northwest and south (Tuscany) components, possibly at different times as noted above. Finally, in the Canary Islands, admixture is detected between a European-like source, mainly related to people from the Iberian Peninsula but with some relatedness to northwest Europeans and Tuscans, and a second source of admixture representing a composite of present-day North Africans from the Atlantic and sub-Saharan Africans from the Senegambia region. Since the Iberian Peninsula analysis showed a complex pattern of gene-flow that could be attributed to the presence of genetic substructure, we analysed the genetic subclusters within Iberia. Four different minor genetic clusters could be identified, as described above. The analysis of these four minor clusters allowed us to dissect the sources and dates of admixture within the Iberian Peninsula (figure 4). Globetrotter infers a single pulse of admixture for each of the Iberian_Northwest and Iberian_Peninsula2 minor clusters, with overlapping dates of gene-flow related to North African sources occurring around the eighth century (717–759 CE and 734–778 CE, respectively, 95% confidence interval (CI)). In the Iberian_Peninsula1 minor cluster, the inferred date of North African related admixture is around the eleventh century (1027–1058, 95% CI), while for the Iberian_South minor cluster, Globetrotter dates admixture to the second half of the fourteenth century (1330–1356, 95% CI). However, in the last two cases, again multiple episodes of gene-flow cannot be ruled out (electronic supplementary material, figure S6), and thus figure 4 may reflect dates of more recent gene-flow and mask older gene-flow. In all Iberian clusters, Globetrotter infers a North African-like source that mainly relates to our Mediterranean cluster. However, Iberian_Northwest and Iberian_Peninsula2 (which are the clusters for which Globetrotter infers older, single pulses of admixture), also show a North African west-like component (electronic supplementary material, table S3). |
|
|
|
Post by Admin on Oct 30, 2020 19:43:32 GMT
 Figure 4. Figure 4. Density plot for the admixture dates estimates after 100 bootstrap iterations of Globetrotter. The x-axis shows the date of admixture in years. On the top left the fineStructure dendrogram and the geographical distribution of minor clusters for the Iberian samples are shown, with each pie showing the proportion of individuals from that sampling location that were assigned to each of the four minor clusters (colours). The size of each circle corresponds to the number of sampled individuals. One cluster was formed by only one individual and therefore is not considered. In summary, the North African gene-flow detected in the three geographical areas analysed (Tuscany, Iberia and the Canary Islands) differ not only in the estimated dates of admixture, but also in the sources of admixture and amount of DNA inherited for each source. In particular, Tuscany and Iberia show admixture from a Mediterranean-like source, while the Canary Islands show admixture from an Atlantic North African-like source (figure 2; electronic supplementary material, table S2). Discussion The aim of our study was to dissect gene-flow from North Africa to three surrounding coastal areas that have been documented to have had historical contact with North Africans: Tuscany, Iberia and the Canary Islands. We applied haplotype-based methods on a large sample set using genome-wide markers in order to refine our knowledge of the gene-flow between these geographical areas, focusing on the following: (i) the estimated dates of the admixture, (ii) the geographical origins of the sources of the admixture events, and (iii) the proportions of the gene-flow. The extensive dataset and the use of haplotype-based methods allowed us to estimate precise and narrow CIs for admixture dates which we correlated with historical processes. Different estimated times, sources and proportions of admixture were detected in each of the three populations analysed. While all three populations show evidence of admixture between European-like and North African-like source groups, the geographical characterization of the North African source varies across populations. In particular, the North African source in the Canary Islands is more genetically similar to populations along the Atlantic coast, while the North African source in Iberia and Tuscany is more genetically similar to populations along the Mediterranean Coast. In the Canary Islands, our date of admixture corresponds to the time of the Castilian conquest (fifteenth century). The European contribution is mainly Iberian, but it also shows a small amount of northwest European genetic influence, which might be related to the presence of Normans involved in the first steps of the conquest [43]. The African source shows both a North African component from the Atlantic and a sub-Saharan component from Senegambia. The mixture of the Atlantic and Senegambia components in the Canary Islands could be explained by admixture at different times prior to European contact. Our data suggest that the initial settlers of the Islands may have already been a composite of these two components. This scenario is supported by the presence of sub-Saharan mitochondrial lineages (i.e. L haplogroups) [10,44–46] in ancient Canary samples. Alternatively, admixture between the Atlantic and the Senegambia components could have occurred by gene-flow from Senegambia at different times after the initial settlement of the Islands and before their admixture with Europeans. However, the sub-Saharan gene-flow into North Africa is high and has been continuous through time, which makes it difficult to discern whether the Senegambia component was already present in North Africa before the first colonization of the Islands or whether it arrived later on. Moreover, the initial colonization of the Islands was very recent, making it difficult to ascertain how much of the North African component may be attributable to the initial settlers versus potential gene-flow from North Africa after the initial colonization. Future studies including ancient DNA from North Africa could help resolve these issues. Both the dates and the origin of the gene-flow from the North African Mediterranean coast suggest a genetic impact of the Arab expansion in the Iberian Peninsula. The northwest of the Iberian Peninsula shows our oldest estimated date of North African admixture and is consistent with a single pulse of admixture around the time of the early arrival and conquest of Iberia by the Arabs. By contrast, our results suggest that the south of the Iberian Peninsula experienced more recent admixture and perhaps continuous gene-flow. In this case, the admixture is dated to the last periods of the Arab rule in the Peninsula in the second half of the fourteenth century. In 1212, the Christian Kingdoms became allies in the Battle of Navas de Tolosa and conquered all southern territories except the Nasrid Kingdom of Granada, which was conquered at the end of the fifteenth century. The inferred continuous gene-flow suggests that contact between the Arab and southern Iberian populations was not limited to that time period, and the estimated dates represent an upper bound on centuries of admixture (figure 4; electronic supplementary material, figures S5 and S6). Collectively, we can identify at least two different gene-flow events in the Iberian Peninsula for which the inferred dates correlate with Arab rule in the territory: an early concentrated event in the northwest of the Peninsula, and a continuous and more recent event in the south. Moreover, the North African populations that settled in the Peninsula during the Arab conquest may have had different origins (both in time and in geography), which could be indicative of different migration waves (electronic supplementary material, table S3). In three of the four minor genetic clusters identified for the Iberian Peninsula (Iberian_Peninsula1, Iberian_Peninsula2 and Iberian_South), three-way admixture was detected between European-like (mainly Iberian), North African-like and Basque-like sources. Alternatively, in the case of the other minor cluster, Iberian_NorthWest, only two sources of admixture (North African-like and Iberian-like) were detected. This is in agreement with different admixture events occurring at different moments and in which different populations were involved. The fact that in the northwest of Iberia the admixture does not involved a Basque-like component, while it participated in the admixture events detected in the rest of the Iberian Peninsula, suggests different Iberian populations participated in geographically separated admixture events. This may reflect different waves of the Christian Kingdoms expansion. The genome-wide study of Fiorito et al. [28] performed admixture analyses in a large-scale Italian dataset, and highlighted more complex events of admixture than the one described herein in Tuscany. Specifically, they described continuous gene-flow from different sources since 3000 ya, which could be the result of their more geographically diverse sample set relative to our geographically localized sample of Tuscany. Perhaps because of this, we infer only a single pulse of admixture which coincides with the movement of people during the fall of the Roman Empire, which was just one of the multiple events detected by Fiorito et al. [28]. Nonetheless, our focus on North African populations has allowed us to propose a more precise origin for the North African gene-flow into Tuscany, with our best surrogate group being comprised present-day people living on the Mediterranean shores of North Africa. Our study highlights the importance of including an extensive and diverse North African dataset in genetic studies. North Africa is a very heterogeneous region, with ample sociological, historical and genetic diversity. Our use of an extensive dataset and the use of population clusters based on genetic homogeneity allowed us to detect and describe events of admixture with more precision than previous studies investigation the influence of North African gene-flow into surrounding regions. Recent methods based on haplotype information, such as those presented here, will illuminate the finer structure and genetic history of Iberian populations, particularly as sampling increases both in terms of numbers and geographical regions encompassed [47]. In the case of the Canary Islands, ancient DNA studies might also help to better understand the origin of the first settlers of the islands and identify its influence in modern populations [48]. |
|
|
|
Post by Admin on Dec 15, 2020 5:19:42 GMT
Revisiting the Out of Africa event with a novel Deep Learning approach Abstract Anatomically modern humans evolved around 300 thousand years ago in Africa1. Modern humans started to appear in the fossil record outside of Africa about 100 thousand years ago though other hominins existed throughout Eurasia much earlier2–4. Recently, several researchers argued in favour of a single out of Africa event for modern humans based on whole-genome sequences analyses5–7. However, the single out of Africa model is in contrast with some of the findings from fossil records, which supports two out of Africa8,9, and uniparental data, which proposes back to Africa movement10,11. Here, we used a novel deep learning approach coupled with Approximate Bayesian Computation and Sequential Monte Carlo to revisit these hypotheses from the whole genome sequence perspective. Our results support the back to Africa model over other alternatives. We estimated that there are two successive splits between Africa and out of African populations happening around 60-80 thousand years ago and separated by 12-13 thousand years. One of the populations resulting from the more recent split has to a large extent replaced the older West African population while the other one has founded the out of Africa populations. 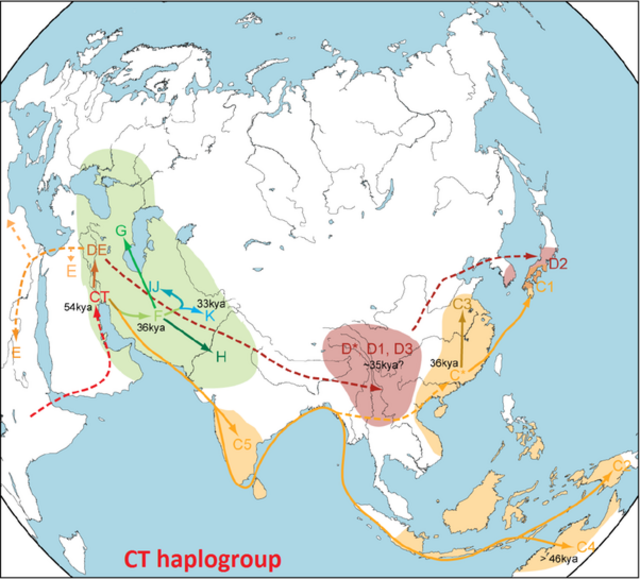 29 Introduction 30 In the last few decades, the development of efficient and powerful computing infrastructure 31 allowed us to gain substantial progress in the machine learning field, especially for 32 computationally demanding algorithms such as Neural Network (NN)12,13 and Bayesian 33 ,15. NN was demonstrated to be an useful tool for specific types of tasks, such as 34 classification or natural language processing12–14,16. However, NN requires a large amount of data 35 as a training set. In some cases, simulated datasets are one of the strategies to overcome this 36 limitation. The simulation of synthetic genetic data can be helpful to substantially mitigate this 37 ,18. NN is already adopted in population genomics studies to interpret the genomics data 38 in terms of underlying demography19–21 and positive selection22,23. However, unlike classical 39 approaches, it is still challenging to measure the significance of a prediction performed by NN, 40 given that it is a black-box approach. Approximate Bayesian Computation (ABC) can be used to 41 weigh the accuracy of a NN-based prediction from the data itself, without knowing the maximum likelihood function19,20,24 43 Recent fossil record analysis suggests that anatomically modern humans appeared around 300 44 thousand years ago (kya) in Africa1. This hypothesis is corroborated by genetic data25, which 45 projected the deepest splits between modern human populations at a similar time interval. 46 Although fossil records advocate that there might be multiple Out Of Africa (OOA) events for 47 modern humans26, recent genetic studies revealed that all modern non-African or OOA populations 48 fit a model characterised by a single OOA event5–7. This conclusion indicates that older OOA 49 migrations, documented by archaeological records, might have not left much contribution to 50 modern human populations, with the possible exception in Oceania (Papuan populations)27 and 51 some archaic hominin28. 52 While the single OOA model finds support in both autosomal and uniparental data11,29,30, there is 53 some evidence for a more complicated scenario. Most of the uniparental haplogroups are closer to 54 each other in OOA populations than African haplogroups (thus having less time to the most recent 55 common ancestor [TMRCA]), corroborating a single clean OOA model, apart from the sister Y 56 haplogroups D and E. The haplogroup D can be found in isolated populations in Asia (i.e., 57 Andamanese, Tibetan, Japanese, etc.), while the haplogroup E is ubiquitous in sub-Saharan 58 African populations. They are slightly closer to each other than any other haplogroups found in 59 OOA populations from them11,31. This observation might be explained by a back to Africa 60 or a more complicated scenario32. Some autosomal analyses also suggest that the 61 separation between Africa and OOA populations might not be a single split event33–36. |
|
|
|
Post by Admin on Dec 15, 2020 23:06:06 GMT
62 Testing these hypotheses (single out of Africa, back to Africa and two out of Africa) is challenging
63 due to the strong bottleneck of non-African populations37–39, differential archaic introgression
64 between populations5,19,40 and various migrations within Africa36,41. The lack of ancient genomic
65 data older than 15 kya42 from Africa or the Middle East makes it difficult to address this issue from
66 an ancient DNA perspective. However, NN have been shown to be extremely powerful to
67 disentangle such complex scenarios19. Here, we present ABC-DLS (Approximate Bayesian
68 Computation using Deep Learning and Sequential Monte Carlo method) which allows us to infer
69 the most likely scenario among different competing demographic models as well as to estimate
70 their parameter values with high precision. Our approach relies on a NN trained on simulated
71 genetic data under the models being tested. However, it has three key improvements compared to
72 other similar approaches. First, the use of the hdf543 data format and tensor flow44,45 allows for
73 extremely large training datasets. Second, the conventional NN approach is augmented using ABC
74 which helps to provide statistical support for the NN prediction and to obtain posterior distribution
75 for the model parameter values. Third, inspired by previous works46, we applied a modification of
76 the Sequential Monte Carlo (SMC, also known as the Particle Filter method)47 approach to iterate
77 the whole procedure. This improved the accuracy substantially compared to previously
78 implemented methods19,48. We apply this method to test the three OOA models mentioned above.
Table 1: Prior parameters range used for producing the Site Frequency Spectrum (SFS).
Parameters OOA_S OOA_B OOA_M
N_A 5,000 - 25,000 5,000 - 25,000 5,000 - 25,000
N_AF 10,000 - 150,000 10,000 - 150,000 10,000 - 150,000
N_EU 10,000 - 150,000 10,000 - 150,000 10,000 - 15,0000
N_AS 10,000 - 150,000 10,000 - 150,000 10,000 - 150,000
N_F 5,000 - 30,000 5,000 - 30,000 5,000 - 30,000
N_EU0 500 - 5,000 500 - 5,000 500 - 5,000
N_AS0 500 - 5,000 500 - 5,000 500 - 5,000
N_B 500 - 5,000 500 - 5,000 500 - 5,000
N_BC NA 500 - 30,000 NA
N_AF0 NA 500 - 30,000 NA
N_MX NA NA 500 - 30,000
N_B0 NA NA 500 - 30,000
T_FM (ky) 2 - 5 2 - 5 2 - 5
T_FS (ky) 0.1 - 10 0.1 - 10 0.1 - 10
T_DM (ky) 10 - 50 10 - 50 10 - 50
T_EU_AS (ky) 10 - 30 10 - 30 10 - 30
T_NM (ky) 5 - 50 5 - 50 5 - 50
T_XM (ky) 5 - 50 5 - 50 5 - 50
T_Mix (ky) NA 5 - 50 5 - 50
T_Sep (ky) NA 5 - 50 5 - 50
T_B (ky) 5 - 270 5 - 220 5 - 220
T_AF (ky) 5 - 700 5 - 700 5 - 700
T_N_D (ky) 330 - 450 330 - 450 330 - 450
T_H_A (ky) 120 - 250 120 -250 120 - 250
T_H_X (ky) 450 - 700 450 - 700 450 - 700
NMix (%) 1 - 3 1 - 3 1 - 3
DMix (%) 0 - 2 0 - 2 0 - 2
XMix (%) 0 - 10 0 - 10 0 - 10
FMix (%) 0 - 10 0 - 10 0 - 10
477 NA means not applicable. Ky means kilo or thousand years.
Results
80 ABC-DLS
81 The general workflow for ABC-DLS (both for model selection and parameters estimation)
82 includes the following steps. First, we simulated18 multiple sets of genetic data for each tested
83 model using demographic parameters sampled from a uniform distribution within prior ranges
84 (Table 1). Next, we converted this data into joint site frequency spectrum (SFS) (although
85 potentially any other summary statistics (SS) can be used) and split the data into a training and a
86 testing subset. We then trained the NN (implemented using TensorFlow44 with Keras backended45)
87 on the training dataset to either select between demographic models or to estimate the demographic
88 parameters. The resulting NN is applied to the testing dataset as well as to the observed SS data
89 (see below as well as Methods for more details). Next, we apply ABC to estimate support for the
90 NN prediction on the observed data comparing the NN prediction outcome between the observed
91 data and the testing dataset (see Methods, Supplementary Figure 2 and also our previous paper 19).
92 Finally, in cases when SMC is used, we essentially iterate the parameter estimation step by SMC.
93 When estimating the posterior range for the parameters using ABC, we kept the top five percent
94 (equal to the tolerance level) of simulations from the testing dataset that best matched with the
95 observed data. We then used the parameters of those simulations to update our prior range and sent
96 it for next iteration till convergence reached (Supplementary Figures 2 and 3).
97 Before testing our primary hypothesis on real sequence data, we tested if our new approach (ABC DLS)
98 is robust enough for the known results. The predicted parameters for real sequence data (see
99 later for more details) are consistent with previous works from the literature37,39,49(Supplementary
100 Table 1). We also simulated models (model S, B, M, see later for more information) and created
101 mock observed SS (simulation parameters coming from Table 2, Supplementary Table 2 and 3).
102 We found that our novel approach with SMC predicted the right model for every case, suggesting
103 it can find the correct model.
|
|
|
|
Post by Admin on Dec 16, 2020 6:14:10 GMT
 104 Model Selection 105 To test our hypothesis, we simulated three OOA models: Simple model (model S), Back to Africa 106 model (model B), and Mix model (model M) with all the models having introgression from 107 Neanderthal to all OOA populations50, Denisova or Unknown to Asia19,51,52 , African Archaic to 108 ,53,54 and European Farmers to Africa55 (NDXF) (see methods for more details, 109 Supplementary Figure 1 and Table 1). We used HGDP dataset56 of five Yoruba (African), five 110 French (European) and five Han Chinese (East Asian) as our real dataset. Next, we used three 111 different methods to choose between the competing models: i) ABC-RF that combines random 112 forests with ABC (here onwards referred to as RF)48; ii) NN and ABC together (here onwards 113 referred to as DL) which is analogous to our previously published method ABC-DL19; and iii) the 114 novel method introduced here ABC-DLS which augments the DL method with SMC (here 115 onwards referred as DLS). Although all three methods identified the model B as the most probable 116 one, the prediction certainty varied between methods (Table 3). While DLS returned 100% 117 probability for model B, DL and RF gave lower support. Also, when 10 independent runs were 118 tested, model B won 10 times out of 10 using DLS and 9 out of 10 using DL. Moreover, Bayes 119 factor value was predicted to be 6.69 between model B and model S by DL. These suggest that we 120 cannot reject model S completely with DL. This difference in prediction certainty was likely due 121 to the better power of DLS to differentiate between the three models compared to the other (Table 122 3). 123 The DLS results were reproduced under different data filtering strategies and different datasets 124 (Supplementary Table 6). As our base models assumed four pulse migration events based on 125 previous studies (three introgression scenarios and recent migration of Neolithic farmers), we 126 tested if these assumptions could affect our inference. We tested different models with 1) No 127 introgression and no farming migration (NI), 2) Neanderthal and Denisova introgression (ND), 3) 128 Neanderthal, Denisova and Africa Archaic introgression (NDX) 4) Neanderthals, Denisova 129 introgression with farming migration (NDF) using only DLS. Except for the no introgression 130 model (Supplementary Table 7), we always found model B to be supported over models S and M. 131 When we compared all these 15 models together ([B, M, S] x [NI, ND, NDX, NDF, NDXF]) using 132 DLS, model B with Neanderthal, Denisova, African archaic introgression, and Neolithic migration 133 (BNDXF) is supported over all other possibilities (P(BNDXF|data) =0.76) (Supplementary Table 134 8). This result not only demonstrated the robustness of our inference for model B but also 135 independently supported other assumptions which were reported before but not all of them were 136 confirmed together19,36,50–52,54,55. We would also like to point out a simpler model without Neolithic 137 migration (P(BNDX|data=0.24) cannot be rejected by our approach. |
|

