|
|
Post by Admin on Jun 1, 2021 21:47:57 GMT
Genetics and material culture support repeated expansions into Paleolithic Eurasia from a population hub out of Africa Leonardo Vallini, Giulia Marciani, Serena Aneli, Eugenio Bortolini, Stefano Benazzi, Telmo Pievani, Luca Pagani doi: doi.org/10.1101/2021.05.18.444621ABSTRACT The population dynamics that followed the out of Africa expansion (OoA) and ultimately led to the formation of Oceanian, West and East Eurasian macro populations have long been debated 1–4. Furthermore, with the OoA being dated between 70 kya 1,4,5 and 65 kya 6 and the earliest splits between West and East Eurasian populations being inferred not earlier than 43 kya from modern DNA data 1,4,7, an additional question concerns the whereabouts of the early migrants out of Africa before those differentiations. Shedding light on these population dynamics may, in turn, provide clues to better understand cultural evolution in Eurasia between 50 kya and 35 kya, where the development of new technologies may be correlated to parallel independent evolution paths, to the arrival of new populations, or to long-term processes of cultural and biological exchanges. Here we jointly re-analyze Eurasian Paleolithic DNA available to date in light of material culture, and provide a comprehensive population model with minimal admixture events. Our integrated approach i) maintains Zlatý Kůň genetically as the most basal out of Africa human lineage sequenced to date, also in comparison to Oceanians and putatively links it with non-Mousterian material cultures documented in Europe 48-43 kya; ii) infers the presence of an OoA population Hub from which a major wave broadly associated with Initial Upper Paleolithic lithic industries emanated to populate West and East Eurasia before or around 45 kya, and of which Ust’Ishim, Bacho Kiro and Tianyuan were unadmixed descendants; iii) proposes a parsimonious placement of Oase1 as an individual related to Bacho Kiro who experienced additional Neanderthal introgression; and iv) explains the East/West Eurasian population split as a longer permanence of the latter in the OoA Hub, followed by a second population expansion (before 37 kya), broadly associated with Upper Paleolithic industries, that largely replaced pre-existing humans in Europe, and admixed with the previous wave to form Yana and Mal’ta in Siberia and, to a greater extent, GoyetQ116-1 in Belgium. Main Text Disentangling the processes underlying population and technological shifts between ∼50 kya and ∼35 kya in Eurasia is critical to explain the formation of current H. sapiens macro populations and to understand if cultural change documented in the archaeological record can be attributed to population movements, human interactions, convergence or any intermediate mechanism of biocultural exchange. This time interval is characterised by the appearance and turnover of several techno-complexes which, based on technological characteristics we divide into: i) production of blades using volumetric and levallois methods here extensively defined as Initial Upper Paleolithic (IUP) 8–10 ; ii) lithic industries characterized by the production of blades and bladelets often together with ornaments and bone tools and here inclusively defined as Upper Paleolithic (UP) ; iii) non-Mousterian and non-IUP technologies appeared during the Middle to Upper Palaeolithic transition, comprising Uluzzian, Châtelperronian, Szeletian and Lincombian-Ranisian-Jermanowician (LRJ) (Supplementary Section 1). Only a few contexts present with both material culture and stratigraphically related human remains for which aDNA is available, which leads to many possible scenarios of association between cultural change and human migration, as well as with inter- and intra-specific human interaction. From a genetic perspective, two recent studies found that around 45 kya, nearby European territories were occupied by either a human population basal to all Eurasians 11 or by a human population that is closer to ancient and contemporary East Asians than to later and contemporary Europeans 12, which triggers the question of where and how the European component, later represented by Kostenki14 (37 kya), differentiated after separating from East Asia. We then started (Supplementary Section 2) with the simple population tree proposed by Prufer and colleagues 11 and tried to add Bacho Kiro in different positions without invoking additional admixture events, with the exception of the extra Neanderthal introgression already documented for the Bacho Kiro samples 12 (Figure S1, Supplementary Section 3). To allow the likely European Neanderthal population that admixed with the ancestors of Bacho Kiro to be different from the Neanderthal population that admixed with the ancestors of all non Africans shortly after the Out of Africa, we modeled it as a different node closer to the Neanderthal from Vindija (Croatia); if it was indeed the same Neanderthal population the inferred drift between the two nodes would be 0. Additionally, to avoid our results to be driven by later population interaction between Eurasia and Western Africa 13 or by the putative admixture of Mbuti pygmies with an archaic ghost hominin 14–16 we used four ancient South African hunter-gatherers 17,18 (Table S1) instead of Mbuti, and found the best placement of Bacho Kiro as a sister of Tianyuan (Figure S1.C, Supplementary Section 3.2). This placement is different from the one proposed by 12 and we speculate this may be due to the ready presence of Neanderthal at the initial stages of our qpGraph modelling or to the availability of Zlatý Kůň, who may provide a good guidance to the basal OoA genetic landscape. After adding Kostenki14 as a key ancient European sample, we found that Ust’Ishim would fit better as a basal split along the branch leading to Tianyuan and Bacho Kiro (Supplementary Section 3.3) (Figure S2). |
|
|
|
Post by Admin on Jun 2, 2021 0:31:43 GMT
The scenario emerging from our proposed tree (Figure 1A, Figure S2.B) depicts Zlatý Kůň as a population basal to all subsequent splits within Eurasia. Downstream of Zlatý Kůň, the separation of Ust’Ishim and other ancient samples (Bacho Kiro and Tianyuan, genetically East Asians, in red in Figure 1A) from the branch eventually leading to Kostenki and Sunghir (genetically West Eurasians with a deep shared genetic drift - 49 units -, in blue in Figure 1A) defines the first major subdivision of Eurasian genetic components. Significantly, this structure is broadly matched by the spatiotemporal distribution of material cultural evidence at a cross-continental scale, according to the present state of archaeological knowledge. From a chronological point of view the right branch (red) of Figure 1A presents samples dated ∼45/40 kya, while the left (blue) one is instead characterised by a younger date of the Kostenki and Sunghir samples (37 and 34 kya respectively). The structure emerging from genetic distances is also supported and confirmed by technological evidence. The earlier, red branch is consistently populated by contexts either directly showing or surrounded by geographic and temporal proxies exhibiting IUP technology (Table S1, Table S2). The later, blue branch is instead predominantly characterised by contexts with UP technology (Table S1, Table S2). Finally, the basal Zlatý Kůň is coeval to Eastern European sites exhibiting Mousterian, non-Mousterian and IUP technologies (Table S1, Table S3).  Figure 1. qpGraph models for Paleolithic Eurasia. Panel A: Best fit population model that recapitulates the major population streams from an Out of Africa hub, colored according to the most parsimonious lithic culture affiliation (Transitional complexes: yellow; Initial Upper Paleolithic, IUP: red; Upper Paleolithic, UP: blue). See Supplementary Sections 1 and 3 for more details on the qpGraph generation and on the material culture labels. Panel B: Modern Papuans can be modelled as a terminal branch of the Paleolithic expansion that was associated with IUP in Eurasia. Such a model is just one of the five equiprobable possibilities we identified (Figure S5) and is reported here just on the basis of its parsimonious nature. Nodes labelled with “H” represent population differentiation inferred to have happened inside the population hub out of Africa. Asterisk indicate genetic drift putatively occurred inside the hub, which differentiates the West and East Eurasian genetic components. Notably, Oase1, which has so far been regarded as a lineage unrelated to extant Eurasians 19, can be modeled as an additional admixture between Bacho Kiro and Neanderthals (Figure 1A, Supplementary Section 3.4). This result is coherent from a geographical and chronological perspective, being Oase1 dated to around 5 ky later with respect to Bacho Kiro and being located just a few hundred kilometers away. Incidentally, the proposed placement of Oase1 on the graph provides support for the claim made in the original Oase1 publication 19 about an additional pulse of Neanderthal admixture experienced by the Oase1 ancestors between the one shared by all non Africans and the one that occurred 4-6 generations before it lived. We here propose that such an event may be shared with the Bacho Kiro population or with a closely related one, which could be seen as ancestral to Oase1. This is also consistent with the reported East Asian genetic affinities for another sample from the same site (Oase2, Supplementary Section 3.4). Our model would then explain Ust’Ishim as the result of early IUP movements towards Siberia 20, and the presence of Bacho Kiro-like populations in Europe at least from 45kya as part of a broader peopling event that reached as far East as Tianyuan (40kya) with little or no interaction with pre-existing Zlatý Kůň-like groups (Figure S4, Supplementary Section 3.5) but with occasional contacts with Neanderthals 12,19. The UP branch in the model would have then emerged from a putative OoA Hub well after 45kya, a scenario that finds support in the previously hypothesised appearance of the UP techno-complexes in Europe (with specific reference to the Aurignacian) as at least partly triggered by migration rather than as local developments of pre-existing technologies 21–31. As far as Northern Asia is concerned, the UP legacy may be responsible for the West Eurasian components already reported in ancient Siberian samples dated between 34kya (Salkhit, 32), 31kya (Yana1, 33) and 24kya (Mal’ta, 34). Admixture events in varying proportions between sister groups of Sunghir and Tianyuan can indeed explain this observation (Figure 1A, purple leaves; Figure S5, Supplementary Section 3.6). This is further supported by the younger chronology for these two sites which is compatible with a stepwise arrival of West Eurasian components in Siberia following the UP exit from the Hub sometime before 37 kya. The lack of West Eurasian components in Tianyuan and in subsequent East Asian individuals may provide clues on the resistance of those groups to the incoming UP population movements, or on subsequent re-expansion from a genetically IUP-like population reservoir. |
|
|
|
Post by Admin on Jun 2, 2021 4:20:33 GMT
West Eurasian IUP populations, on the other hand, likely declined and ultimately disappeared, as suggested by the fact that our population tree is compatible with the arrival in Europe of UP groups who experienced no further admixture with pre-existing IUP or Neanderthals, with the exception of human groups like GoyetQ116-1. The East Asian component carried by this sample 35 can be described as an interaction between pre-existing Bacho Kiro-like and incoming UP groups in West Europe with an additional Tianyuan-like component. Such a variegated East Asian substrate found in the otherwise West Eurasian GoyetQ116-1 sample accounts for yet undescribed complexities within the IUP population branch (Figure S6, Supplementary Section 3.7). Given the relatively simple population tree needed to explain the post OoA Eurasian population movements using aDNA samples available to date, and benefiting from the basal position of Zlatý Kůň, we tried to model Oceanian populations (modern Papuans) within the emerging picture to resolve a long lasting debate on their topological position with respect to East and West Eurasians. Starting from the topologies proposed in 1,2 we first tried to place Papuans as the most basal branch along the non-African sub-tree, allowing for the documented Denisova admixture 36,37. We avoided including the sampled Denisova aDNA within the population tree to eliminate attractions from yet uncharacterized, deep splits along the hominin branch, and opted for a surrogate ghost split along the archaic human lineage. Simply placing Papuans in a basal position (either before or after the split of Zlatý Kůň) was rejected and highlighted a notable attraction between them and Tianyuan. We then modelled Papuans as sister of Tianyuan (Figure 1.B, Figure S7.A) 3, a solution that yielded only two marginal outliers that could be resolved when taking all the SNPs into account (Supplementary Section 3.8). This topology could be marginally improved when allowing for a contribution of a basal lineage, whose magnitude decreased the deeper was its position along and beyond the OoA tree: 94% as the ancestor of Bacho Kiro and Tianyuan (Figure S7.B) or 53% as the most basal IUP lineage (Figure S7.C), 40% before the West/East Eurasia split (Figure S7.D), 2% before the Zlatý Kůň lineage, along the OoA path (Figure S7.E) and 2% as an extinct OoA (xOoA, Figure S7.F) as proposed by Pagani and colleagues 7. Notably, all the acceptable solutions for the placement of Papua within the broader OoA tree confirm Zlatý Kůň as the most basal human genome among the ones ever found Out of Africa. Taken together with a lower bound of the final settlement of Sahul at 37 kya (the date of the deepest population splits estimated by 1) it is reasonable to describe Oceanians as either an almost even mixture between East Asians and a lineage basal to West and East Asians occurred sometimes between 45 and 37kya, or as a sister lineage of East Asians with or without a minor basal OoA or xOoA contribution. We here chose to parsimoniously describe Papuans as a simple sister group of Tianyuan, cautioning that this may be just one out of five equifinal possibilities. In conclusion, via introducing the concept of post OoA population Hub, our model provides a robust, elegant and parsimonious framework to explain the relationships between the most representative ancient human DNA available to date between 60 and 24kya across Eurasia, which can be accommodated within just three expansions out of a putative OoA Hub (Figure 2, Supplementary Section 4). Zlatý Kůň may represent an early expansion, which left little to no traces in subsequent Eurasians and occurred before 45kya (Figure 2A). We speculate this population movement might be linked to non-Mousterian and non-IUP lithic techno-complexes that appeared in Central and Eastern Europe between 48-44kya (e.g., Szeletian, LRJ) 38,39. A subsequent expansion (linked to IUP in Eurasia) can be dated to around 45kya as proposed by Zwyn and colleagues 20, and here we propose it to be a wider phenomenon that populated the broad geographic area between Mediterranean Levant 40–44, East Europe 45–47, Siberia-Mongolia 10,20,48–51 and East Asia 9,52,53 in less than 5ky, reaching as far South as Oceania before 37kya, and which eventually died out in Europe after repeated admixtures with Neanderthals (Bacho Kiro and Oase1 being two notable examples) (Figure 2.B). In Western Europe, in the same timeframe, this interaction has been suggested as a trigger for the development of Chatelperronian material culture 54, while the Uluzzian techno-complex in Mediterranean Europe might be better explained by an additional, yet uncharacterized expansion from the Hub 55,56.  Figure 2 Subsequent expansions into Eurasia from a population hub out of Africa. Panel A: Zlatý Kůň can be described as a putative early expansion from the population formed after the major expansion Out of Africa and hybridization with Neanderthals, and could be linked with transitional cultures found in Europe 48-45 kya. Panel B: Representative samples dated between 45 kya and 40 kya across Eurasia can be ascribed to a population movement with uniform genetic features and material culture consistent with an Initial Upper Palaeolithic affiliation and which can also explain Oase1 after allowing for additional Neanderthal contributions; modern Papuans may be genetically seen as an extreme extension of this movement. Panel C: following local genetic differentiation, a subsequent population expansion could explain the genetic components found in ancient samples <37kya which contain it in unadmixed form (Kostenki14, Sunghir) or admixed with pre-existing IUP components (Goyet Q116-1, Yana1, Mal’ta). The dates at the top right of each map provide a lower bound, based on the C14 of the earliest available sample for the inferred population wave. * indicate sites for which material culture was not available in direct association. For these sites the nearest spatio-temporal proxies were used, as indicated in Table S1. Numbers on the map refer to the position of relevant proxies: 1: Szeleta (S); 2: Pod_Hradem (S); 3: Moravský_Krumlov_IV (S); 4: Stranska_Skala_III-IIIc (IUP); 5: Brno-Bohunice (IUP); 6: Bacho_Kiro_IUP_layer_11 (IUP); 7: Ořechov_IV_–_Kabáty (IUP); 8: Brno-Bohunice (IUP); 9: Românesti-Dumbravita (UP); 10: Cosava (UP); 11: Tincova (UP); 12: Kara_Bom_OH_5_OH6 (IUP); 13: Tolbor-4_layer_4-5-6 (IUP); 14: Tolbor-16_layer_6 (IUP); 15: Kamenka_A (IUP); 16: Suindonggou_1 (IUP); 17: Suindonggou_2 (IUP); 18: Maisières-Canal (UP); 19: Spy_Ossiferous_Horizon_2 (UP); 20: Kostenki_12_Vokov (UP); 21: Kostenki_1 (UP); The last major expansion needed to explain the observed data (UP) took place later than 45 kya and before 37kya and repopulated (Kostenki, Sunghir), or interacted with, pre-existing human groups (GoyetQ116-1, Figure S6) in Europe, and admixed with members of the previous wave in Siberia (Yana, Mal’ta and perhaps Salkhit) as it moved East in the subsequent 5-10kya (Figure 2.C). The split time between East and West Eurasians estimated at ∼40 kya 1 from modern genomes and the differentiation of these two macro-populations can therefore be explained by the inferred timing of the IUP exit from the Hub, followed by subsequent diversification within the Hub of the ancestors of West Eurasians, later mitigated by ongoing cross-Eurasian gene flow. In this paper, we used extensive cultural categories that are in agreement with the demic movements at the present, coarse scale of analysis. The general trends observed here emerge from a broad perspective, and further work is needed to test specific hypotheses concerning actual processes of branching, local adaptation, cultural transmission and convergence 10,57. Similarly, we remain oblivious about the precise location of the inferred population Hub. More ancient genomes are needed, as well as a better understanding of the role of South and SouthEast Asia, for which currently known material culture suggests complex trajectories 58–68. |
|
|
|
Post by Admin on Feb 9, 2022 20:01:04 GMT
Biomolecular insights into North African-related ancestry, mobility and diet in eleventh-century Al-Andalus
Abstract
Historical records document medieval immigration from North Africa to Iberia to create Islamic al-Andalus. Here, we present a low-coverage genome of an eleventh century CE man buried in an Islamic necropolis in Segorbe, near Valencia, Spain. Uniparental lineages indicate North African ancestry, but at the autosomal level he displays a mosaic of North African and European-like ancestries, distinct from any present-day population. Altogether, the genome-wide evidence, stable isotope results and the age of the burial indicate that his ancestry was ultimately a result of admixture between recently arrived Amazigh people (Berbers) and the population inhabiting the Peninsula prior to the Islamic conquest. We detect differences between our sample and a previously published group of contemporary individuals from Valencia, exemplifying how detailed, small-scale aDNA studies can illuminate fine-grained regional and temporal differences. His genome demonstrates how ancient DNA studies can capture portraits of past genetic variation that have been erased by later demographic shifts—in this case, most likely the seventeenth century CE expulsion of formerly Islamic communities as tolerance dissipated following the Reconquista by the Catholic kingdoms of the north.
Introduction
The location of Iberia, bridging the Mediterranean and the Atlantic, and its proximity to Africa, has allowed contacts with populations of distinct ancestries over time, making the Peninsula a genetic and cultural crossroads. There is both archaeological and direct genetic evidence of contacts between Iberia and North African populations since at least the Late Neolithic1,2,3,4,5,6, and possibly as early as the postglacial period7,8. Prehistoric populations have been the focus of most of the ancient DNA (aDNA) work published on Iberia so far, including the study of Mesolithic individuals9,10, the impact of Neolithic dispersals11,12, and the incursions of individuals with Steppe-related ancestry at the time of the transition from the Chalcolithic to the Bronze Age5,6,13,14,15.
aDNA researchers have recently begun to explore in detail historical intervals of known population movements6. Although Iberia intensified contacts with North Africa through Phoenician traders, Carthaginians and Roman conquerors16, North-African genetic contribution seems to have been restricted to southern populations until the eight century CE6. It is only with the Islamic conquest of Iberia in 711 CE that records start pointing towards a substantial influx of people from North Africa, involving the culturally and genetically differentiated Arab and Amazigh (Berber) peoples17,18. Attempts have been made to estimate their contribution to the genetic landscape of medieval Iberia using modern genomes, revealing a faint southwest-northeast pattern of decreasing North African-related ancestry19,20, which have recently been confirmed by means of aDNA analysis6.
Although Arabs were the urban and political elite during the Umayyad Caliphate, ruling from 711 CE until the end of the Caliphate of Cordoba in 1031 CE, they are thought to have been a minority amongst the new settlers. Berbers formed the bulk of the army who first seized Visigothic Spain in the eighth century CE21. Berbers had converted to Islam as a result of the Arab conquest of North Africa in the preceding century and embarked in a slow and complex process of Arabisation that lasted centuries. However, they were far from culturally homogeneous; a deep division existed between nomadic and sedentary Berber groups, and it was the latter who first settled in the rural areas of Spain18. Although Berber numbers in Iberia were likely larger than those of the Arabs, they initially wielded no significant political power, but this changed during the eleventh–thirteenth centuries CE with the establishment of the Almoravid and Almohad Berber empires18.
After the southwards military expansion of the Catholic kingdoms ended in 1492, a large population of Moriscos (Muslims forcibly converted to Christianity) persisted in East Iberia (previously Sharq al-Andalus) until 1609 CE, when at least one third of the populace was forcibly expelled by the Spanish Crown and relocated to North Africa22. Historical documentation suggests that the population of the eastern Mediterranean provinces of Castellón, Valencia, Alicante, and—to a lesser degree—Murcia and parts of Andalusia (Almeria and Granada), was greatly reduced, with subsequent resettlement from Aragon, Catalonia and Navarre to avoid economic and demographic collapse23. Many surnames currently widespread in the Valencian region are geographically structured and reflect their provenance from the colonizing regions (data from Spanish National Institute of Statistics, 2017; Supplementary Fig. S1). The hinterland was mostly repopulated by non-Catalan-speaking Aragonese, whereas the main coastal cities concentrated more Catalan-speakers from Catalonia23. This divide is thought to be still reflected in the genomic data today20. Thus, most of the existing genetic variation from the preceding eastern Iberian populations and the North African genetic variation potentially brought during Islamic rule had most likely disappeared by the late seventeenth century CE20, especially in the Valencian region24. Therefore, DNA from archaeological remains can provide an important tool to understand the demographic dynamics of the Islamic period in East Iberia25.
Here, we sequenced the genome of an individual (UE2298/MS060) who was buried in the Islamic maqbara (necropolis) of Plaza del Almudín in the city of Segorbe (province of Castellón, Comunidad Valenciana, Spain) (Supplementary Fig. S2). He was dubbed as “the Giant” by the archaeologists responsible for the excavation (here referred to as the “Segorbe Giant”), due to his unusual height (184–190 cm) compared with the other individuals found in the site (Barrachina 2004) (Supplementary Methods). Osteological assessment suggests that he had African ancestry, and he was postulated to be of possible Berber origin26,27. Although his uniparental lineages point to North African ancestry, at the autosomal level he displays both North African and European-related ancestries. The genetic analyses show differences in relation to contemporary individuals from Valencia6 and highlight the contribution of admixture between people of North African origin and the populations inhabiting East Iberia prior to the Islamic period. We conducted a complementary analysis of stable isotopes on a total of thirteen individuals from the necropolis (Supplementary Table S1) to investigate mobility and diet patterns. We also generated more than 1000 new modern Iberian whole mitochondrial genomes to assess the potential impact of North African mitochondrial DNA (mtDNA) lineages in the modern Iberian maternal gene pool. As UE2298/MS060 belongs to mtDNA haplogroup U6, we also performed a detailed phylogeographic reanalysis of this haplogroup.
|
|
|
|
Post by Admin on Feb 9, 2022 21:42:52 GMT
Results Uniparental genetic background of the Segorbe Giant We confirmed that the individual was genetically male (RY > 0.077; Supplementary Fig. S3), and both his uniparental markers point towards North African origins (Supplementary Table S2). He belongs to mtDNA haplogroup U6a1a1a (nomenclature according to Hernández et al.28). Although U6 in general, and U6a in particular, is present in higher frequencies in North and West Africa29,30, the complete mitochondrial genome dataset currently available is heavily biased towards Europe, and U6a1a1a, which dates to 3.5 thousand years ago (ka) (maximum-likelihood node estimation based on modern variation), appears to have a more southern European distribution (Fig. 1a; Supplementary Fig. S4). However, in our Iberian mitogenome dataset, U6a1a1a occurs only at 0.3%, whereas the HVS-I (hypervariable segment I) subclade U6a1a1, defined by a transition variant at position 16239, which nests U6a1a1a, is found at ~ 14% in Algerian Mozabite Berbers31. Figure 1 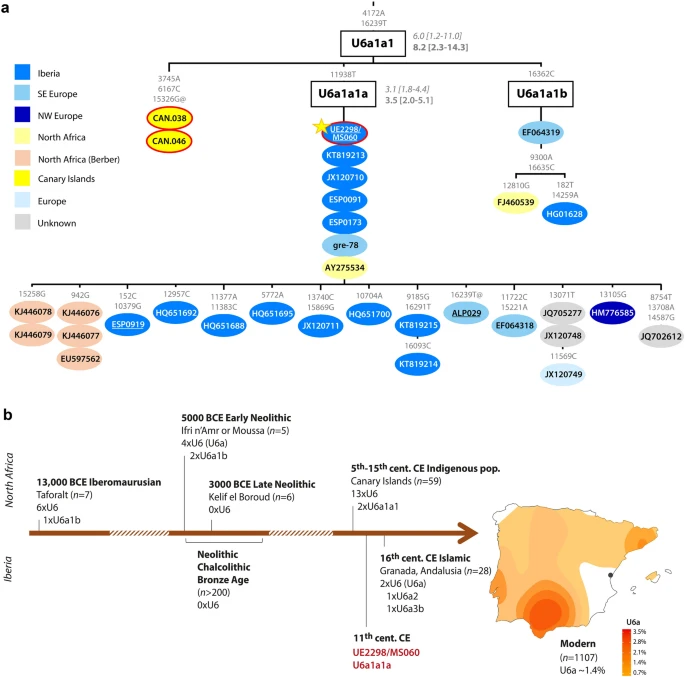 Haplogroup U6a1 has been found in Moroccan Iberomaurusian remains dating to 14–15 ka32, as well as in Early Neolithic Morocco (i.e. the pre-agricultural Holocene)2 (Fig. 1b). Although U6 lineages have been retrieved from sixteenth century CE Islamic burials in Granada (Andalusia)6, to our knowledge, UE2298/MS060 (dating to the eleventh century CE) is the earliest documented finding of a U6 lineage in Iberia. Based on the results of our newly generated Iberian mitochondrial dataset (n = 1104: 1008 sequences from mainland Spain and the Balearic Islands, plus 96 from mainland Portugal), U6a can be found at a frequency of 1.6% in modern mainland Iberian populations, with a peak of 3.6% in the south of Spain (Fig. 1b). This pattern contrasts with most mitochondrial lineages today in Iberia, although a peak of frequency in the south of the Peninsula is also observed for typically sub-Saharan African L lineages (but not for the predominantly northeast African haplogroup M136) (Supplementary Fig. S5; Supplementary Table S5). UE2298/MS060 falls outside the modern geographic distribution of U6 lineages in Spain, suggesting that the present distribution might not reflect the medieval distribution of this haplogroup. A detailed phylogeographic analysis of U6 can be found in Supplementary Note 1. We assigned UE2298/MS060 to the Y-chromosome haplogroup E1b1b1b1 (E–M310) (Supplementary Table S2), dating to ~ 13.9 [12.1–15.7] ka (Yfull, v.6.06.15) and immediately basal to the clade nesting E–M81 (E1b1b1b1a) (Fig. 2; Supplementary Figs. S6 and S7). E1b1b is very frequent in contemporary North Africa and has been found in North African and Levantine remains2,32,33,37 (Supplementary Fig. S8). E–M81 (E1b1b1b1a), dating to ~ 2.8 ka (YFull, v.6.06.15), has been retrieved from early Islamic remains (seventh–eighth century CE) in southern France38, whereas the more derived E1b1b1b1a1 has been found in two individuals from an Islamic necropolis in the city of Valencia, dating to twelfth–thirteenth century CE6. E–M81 is today predominantly found in the Maghreb (where its average frequency is > 40%) and peaks in modern Berber populations, with frequencies reaching > 80%39,40,41, being almost fixed in some groups, such as the southern Moroccan Tachlhit-speakers42 and the Chenini–Douiret and Jradou from Tunisia40. In Europe, it is found mostly in Iberia and Sicily at frequencies < 5%43. Figure 2 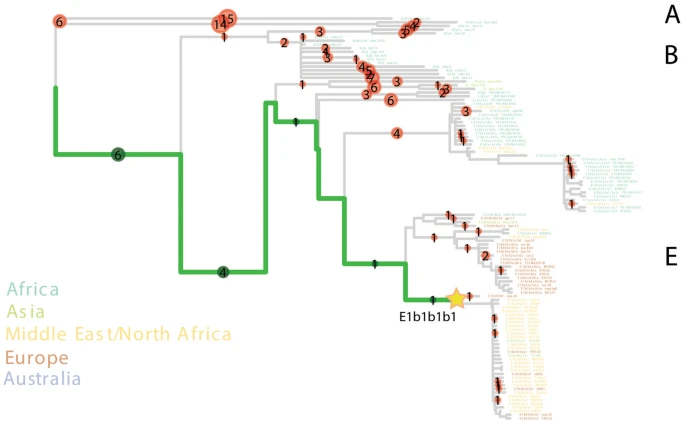 Given that there are no reads covering any of its diagnostic positions, we cannot exclude the possibility that UE2298/MS060 could belong to the E–M81 lineage (Supplementary Fig. S6). Using pathPhynder44 to investigate his Y-chromosomal affinity with present-day populations, UE2298/MS060 was positioned in a branch that harbours Iberian and North African E–M310-derived lineages, but with no support for membership to a more downstream lineage within this clade (Fig. 2; Supplementary Fig. S7). Genome-wide ancestry of the Segorbe Giant We investigated the autosomal ancestry of our ancient individual by calling ~ 74,200 autosomal SNPs (~ 72,300 when using a different approach to deal with post-mortem damage (Supplementary Table S2)). The PCA (Fig. 3a; Supplementary Fig. S9) shows that UE2298/MS060 occupies an intermediate position between present-day and ancient North African and Iberian populations in PC1, close to other Iberian Islamic individuals. Some differentiation between the Islamic individuals from Valencia and those from Andalusia is visible in the PCA, with the Andalusians mostly falling closer to North Africans and UE2298/MS060 falling outside both the Valencian and Andalusian clusters (Fig. 3b). However, this difference between UE2298/MS060 and the other Islamic individuals is not detected with ADMIXTURE in supervised mode (K = 3), using Iberia_IA, Levant_BA and Morocco_LN/Guanches as reference populations (following the findings in Olalde et al.6) (Fig. 3c; Supplementary Fig. S10). Figure 3 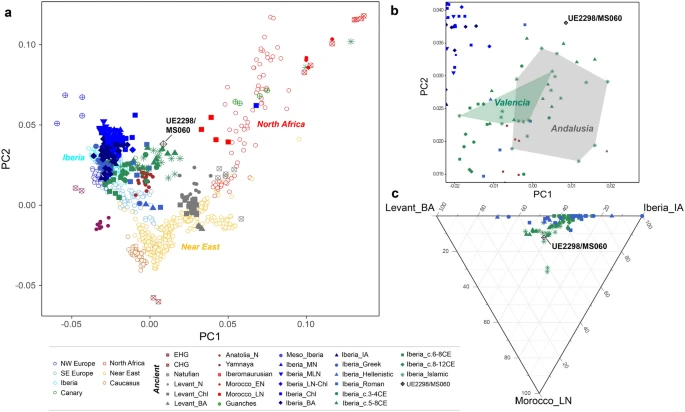 Outgroup-f3 runs using different outgroups (Mbuti, Ju_hoan_North and Ust_Ishim) consistently show a higher proportion of shared drift with Middle/Late Neolithic, Chalcolithic and Bronze Age Iberian populations, and with the Anatolian Neolithic (Supplementary Table S6), than with North African populations (although the proximity of North African groups, particularly Late Neolithic Morocco and the Guanches, to UE2298/MS060 changes when using Ust’-Ishim, a non-sub-Saharan African outgroup, suggesting that his genome may have some African-related ancestry). D-statistics consistently show UE2298/MS060 to be significantly closer to Iberian populations than to Iberomaurusians, Early Neolithic Morocco or the Guanches (Fig. 4; Supplementary Table S7). However, tests using Late Neolithic Morocco, in the form D(outgroup, UE2298/MS060; Morocco_LN, Iberian population), consistently generated results close to zero and non-significant (|Z|-score < 3), which might be an indicator that a population genetically close to Morocco_LN contributed to the ancestry of UE2298/MS060 in similar proportions to an Iberian source. We note that we did not observe any major differences in the patterns observed for outgroup-f3 and D-statistics using different approaches to minimise the effects of post-mortem damage (“mapDamage —rescale” and “soft-clipping”) (Supplementary Tables S6 and S7), but additional qpAdm models are accepted using “mapDamage --rescale” (Supplementary Tables S8 and S9). |
|

