|
|
Post by Admin on Apr 17, 2022 21:52:22 GMT
Molecular analysis We resequenced about 0.15 Mb of the MSY for each of the four R1b subjects. PCR primers were designed on the basis of the MSY sequence reported in Genome Browser web site (February 2009 assembly of the human genome; genome.ucsc.edu/) using Primer3 software (http://frodo.wi.mit.edu/cgi-bin/primer3/primer3_www.cgi). Sequencing templates were obtained through PCR in a 50 μl reaction containing 50 ng of genomic DNA, 200 μ M of each dNTP, 2.5 mM MgCl2, 1 unit of Taq polymerase, and 10 pmoles of each primer. A touchdown PCR program was used with an annealing temperature decreasing from 63 to 56 °C over 14 cycles, followed by 30 cycles with an annealing temperature of 56 °C. After DNA amplification, PCR products were purified using the QIAquick PCR purification kit (Qiagen, Hilden, Germany). Cycle sequencing was performed using the BigDye Terminator Cycle Sequencing Kit with Amplitaq DNA polymerase (Applied Biosystems, Foster City, CA, USA) and an internal or PCR primer. Cycle sequencing products were purified by ethanol precipitation and run on an ABI Prism 3730XL DNA sequencer (Applied Biosystems). Chromatograms were aligned and analyzed for mutations using Sequencher 4.8 (Gene Codes Corporation, Ann Arbor, MI, USA). Six new mutations were identified (see Supplementary Table 1 for details). All the 5326 samples were analyzed for M343,28 with the exception of the Asian samples from CEPH/HGDP.29 A total of 997 chromosomes belonging to the R1b (R-M343) haplogroup were identified and further genotyped for 11 markers defining internal nodes (Figure 1). Typing methods for six of these markers (P25, P297, M335, M18, M73, and M269) were described earlier.18, 28, 30, 31, 32, 33 The marker P25, which has been shown to be liable to back mutation by gene conversion,34 was analyzed in the Asian samples from CEPH and in the R1b (R-M343) chromosomes lacking any other internal mutation. Figure 1 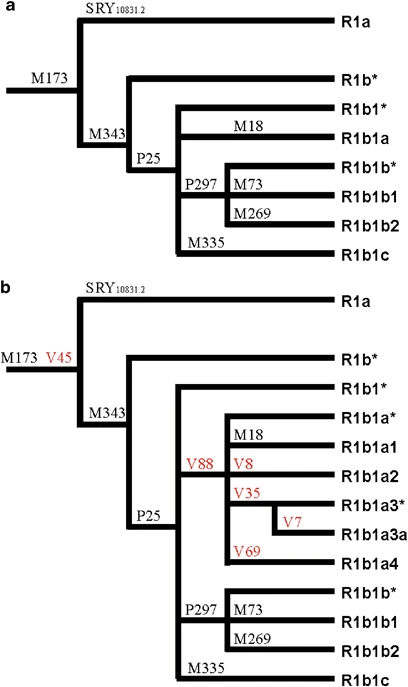 An updated phylogeny of the haplogroup R1b (R-M343). (a) Haplogroup R1b phylogeny as reported in Karafet et al.31 Twelve mutations internal to haplogroup R-M269 are not shown, as they are not relevant in this context. (b) Updated R1b phylogeny with the new mutations V7, V8, V35, V45, V69, and V88. As in Karafet et al,31 the phylogenetic position of the marker M335 within R1b is not definitively assigned, because of the absence of positive control DNAs. To evaluate the phylogenetic relationships between the non-consensus allele 13.2 at the locus B of the microsatellite DYS38535 and other R1b markers, DYS385B was analyzed by sequencing35 in 106 R1b Y chromosomes (4 R-P25*, 57 R-V88*, 41 R-V69, and one for each of R-M18, R-M269, R-V7, and R-V8). The internal diversity of the haplogroup R1b and its subhaplogroups was evaluated through the analysis of 210 Y chromosomes for four polymorphic dinucleotide repeats (YCAII and DYS413 duplicated loci) and seven tetranucleotide repeats (DYS19, DYS391, DYS393, DYS439, DYS460 (formerly A7.1), DYS461 (formerly A7.2), and GATA A10), as reported earlier.12 Data analysis We obtained coalescence time estimates by using the variation associated with seven tetranucleotide microsatellites and the ASD method,36 in which the ancestral haplotype was assumed to be the haplotype carrying the most frequent allele at each microsatellite locus. Owing to the uncertainties associated with the estimate of the evolutionary effective microsatellite mutation rates, depending on the haplogroup demographic history,37 we considered two different population models: (1) a constant size population and (2) a single rate of m=0.01 for exponential population growth. After calibration for the specific microsatellites used in this study,13 we found evolutionary effective mutation rates of 7.9 × 10⁻⁴ and 1.3 × 10⁻³, respectively. Estimates for R-M343/P25, R-V88, and R-V69 were obtained from 210, 98, and 26 Y chromosomes, respectively. Phylogenetic relationships among 11-microsatellite haplotypes (Supplementary Table 2) were obtained by sequentially performing reduced-median and median-joining procedures38, 39 through the use of the network 4.1 program (Fluxus-engineering.com, www.fluxus-engineering.com/sharenet.htm). To reduce reticulations in the network, microsatellites were weighted proportionally to the inverse of the repeat variance observed in each haplogroup. Frequency map was depicted on a grid of 47 × 52 lines using the Kriging procedure40 through the use of the program Surfer 6.0 (Golden Software, Inc., Golden, CO, USA). The Mann–Whitney U-test was performed using the Simple Interactive Statistical Analysis web tool (http://www.quantitativeskills.com/sisa/). |
|
|
|
Post by Admin on Apr 18, 2022 17:49:09 GMT
Results and discussion We resequenced about 0.15 Mb of the MSY for each of the four R1b subjects and found six new mutations (V7, V8, V35, V45, V69, and V88). The V45 mutation is phylogenetically equivalent to M173. Among the other five mutations, V88 defines a new monophyletic clade (R-V88 or R1b1a), which includes haplogroups R-M18 (R1b1a1, formerly R1b1a), R-V8 (R1b1a2), R-V35 (R1b1a3, further subdivided by the V7 mutation to R1b1a3* and R1b1a3a), and R-V69 (R1b1a4) (Figure 1). The microsatellite intermediate variant allele 13.2 at the DYS385 locus B, which has been reported to delineate a new phylogenetic substructure within the human Y chromosome paragroup R1b*,25, 35 was not observed in any of the 106 R1b Y chromosomes analyzed here. Therefore, the phylogenetic relationships between this marker and the new mutations reported here remain to be defined. In total, 997 chromosomes belonging to the haplogroup R1b were found. The paragroup R-M343*, earlier reported in a single subject from Turkey,28 was not observed. The overall scenario was characterized by a strong inter-continental differentiation (Table 1). All the African R1b chromosomes, with the exception of one eastern- and a few northern-African R-M269 chromosomes, turned out to belong to the haplogroup R-V88. About one third of the African R-V88 chromosomes carried mutation V69, which was not observed outside Africa. The large majority of R1b chromosomes from western Eurasia carried, as expected, the M269 mutation; only five R-V88 chromosomes were observed, three of which carried distinctive mutations (M18, V35, and V7). The rare R1b chromosomes observed in Asia were either R-M73 or R-M269. The R-P25* paragroup was only found in five subjects from Europe (3), western Asia (1), and eastern Asia (1) (Table 1). According to the phylogeography of macro-haplogroup K-M9 (which contains haplogroup R1b), an ancient Asia-to-Africa back migration has been hypothesized to explain the puzzling presence of R-P25* in sub-Saharan Africa.18 This hypothesis is strongly supported by the present data. In the revised Y chromosome phylogeny, there are 119 lineages in the macro-haplogroup K-M9 (which includes haplogroups K1-K4 and L to T).31 Of these lineages, only two have been observed in sub-Saharan Africa at appreciable frequencies: T-M7018, 41, 42 and R-V88 (this study). Both haplogroups have also been observed in Europe and western Asia (Refs 42,43 and this study). If the presence of R1b chromosomes in Africa was not because of a back migration, we would have to assume that all the mutations that connect M9 with V88 in the MSY phylogeny (>50 mutations) originated in Africa. Under this scenario, we should assume that all the K-M9 lineages that are now found outside sub-Saharan Africa have survived extinction, whereas those which should have accumulated in Africa are now extinct (with the exception of T-M70 and R-V88) and this is an unlikely scenario. We obtained the time estimate of the Asia-to-Africa back migration by using the variation associated with seven tetranucleotide microsatellites (Supplementary Table 2) and the ASD method.36 As an upper limit, we used the coalescence time of the R-M343/P25 haplogroup (12.9 ky, 95% CI=11.6–14.3 ky, under a conservative scenario of constant population size), which, on the basis of the accumulated nucleotide and microsatellite diversity (Table 1; Figure 2), most likely originated outside Africa. The coalescence time of the seemingly African-specific haplogroup R-V69 (6.0 ky, 95% CI=4.2–8.2 ky, under the hypothesis of an expanding population) was used as a lower limit. Figure 2 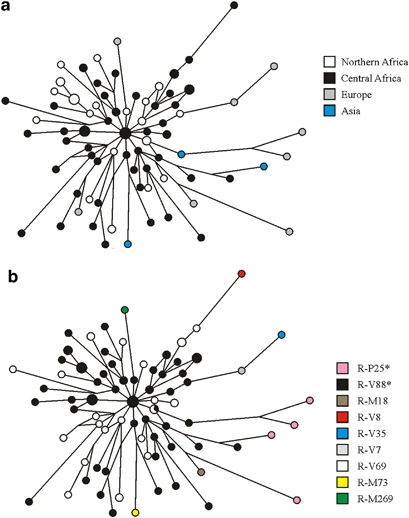 Eleven-microsatellite network of R1b chromosomes from Eurasia and Africa. Microsatellite haplotypes are represented by circles filled with colors corresponding to geographic regions (a) and binary haplogroups/paragroups (b). Only the modal microsatellite haplotypes for haplogroups R-M73 (based on 9 chromosomes) and R-M269 (based on 95 chromosomes) are shown. Within Africa, the highest frequencies of the R-V88 haplogroup (and its commonest sub-clade, R-V69) were observed in the central Sahel (northern Cameroon, northern Nigeria, Chad, and Niger) (Table 1; Figure 3). Immediately south of this region (southern Cameroon and southern Nigeria), frequencies drastically dropped to 0.0–4.8%. The central Sahel is characterized by a strong linguistic fragmentation with populations speaking languages belonging to three of the four linguistic families of Africa (Afroasiatic, Niger-Congo, and Nilo-Saharan). When the linguistic affiliation of the populations from the central Sahel was also taken into account, a clear-cut divide was observed between those speaking Afroasiatic languages (including the Berber-speaking Tuareg, the Semitic Arab Shuwa, and Chadic-speaking populations from northern Cameroon) and the other populations (Mann–Whitney test P=1.4 × 10⁻³), with Chadic-speaking populations mostly contributing to this difference. It is worth noting that, if the finding of 20% R-V88 chromosomes among the Hausa (Table 1) is representative, this population, encompassing by far more people than all other Chadic speakers,44 also encompasses the highest absolute number of V88 carriers. |
|
|
|
Post by Admin on Apr 18, 2022 19:07:46 GMT
Figure 3 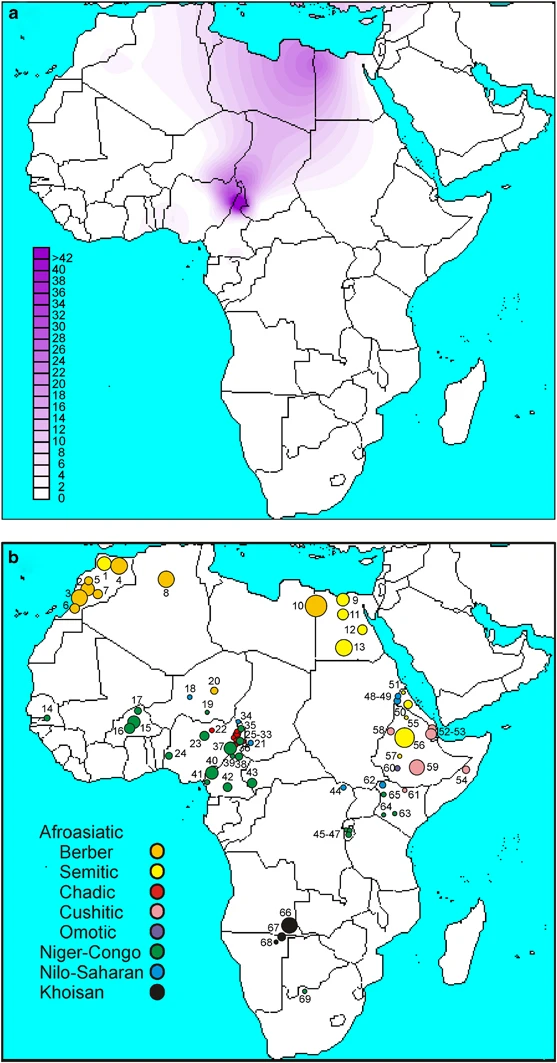 A schematic representation of the African continent. (a) Contour map of haplogroup R-V88. (b) Location and linguistic affiliation of the sampled populations. Numbers refer to populations in Table 1. Linguistic affiliations of the populations are indicated by different colors (to the left). In contrast to prior studies on nuclear (mostly autosomal) ins/del and microsatellite markers,45 the Chadic are distinguished from the Nilo-Saharan-speaking populations at the Y chromosome variation level (Table 1; Supplementary Table 3). Repeated assimilations of Nilo-Saharan females over generations may account for these conflicting signals. Among the Niger-Congo-speaking populations, the frequency of the haplogroup R-V88 ranged between 0.0 and 66.7%. Outside central Africa, haplogroup R-V88 was only observed in Afroasiatic-speaking populations from northern Africa, with frequencies ranging from 0.3% in Morocco, to 3.0% in Algeria, and to 11.5% in Egypt, where a particularly high frequency (26.9%) was observed among the Berbers from the Siwa Oasis. Although the presence of the haplogroup R-V88 at non-negligible frequencies in some Niger-Congo-speaking populations from the central Sahel can be accounted for by Chadic admixture favored by geographic contiguity, the presence of this haplogroup both in northern Africa and the central Sahel is especially intriguing given that >1500 km across the Sahara separate the two regions. The expansion time for the haplogroup R-V88 in Africa, under two different population models (see Materials and methods), was found to be 9.2–5.6 ky (95% CI=7.6–10.8 ky and 4.7–6.6 ky, respectively). Diverse hypotheses have been proposed to explain the process by which proto-Chadic speakers arrived to the Lake Chad region. Ehret46 has put forward a model for Afroasiatic languages with a primary division between the Omotic languages of Ethiopia and an Erythraean subgroup. This, in turn, has been subdivided into Cushitic and North Erythraean, the latter including Berber, Semitic, Ancient Egyptian, and Chadic. In his opinion, around 7000 kya proto-Chadic Afroasiatic speakers may have moved west through the Central Sahara and then farther south into the Lake Chad Basin.47 Blench,48 in turn, suggested that speakers of proto-Cushitic–Chadic language migrated east-to-west from the Middle Nile to the Lake Chad, and recent mtDNA data support this view.49 However, in contrast to the mtDNA, a strong connection between Chadic and other Afroasiatic populations from Northern Africa is revealed by the Y chromosome data. This finding would indicate the trans-Saharan47 a more likely scenario than the inter-Saharan hypothesis,48 at least as far as the male component of gene pool is concerned. In this view, it is tempting to speculate that the Y chromosome haplogroup R-V88 represents a preserved genetic record of gene flow along the same axis as the proposed spread of proto-Chadic languages.47 Indeed, geomorphological evidence4 from the paleolakes that existed in the Sahara during the mid-Holocene indicates that these lakes could have covered an area as large as about 10% of the Sahara, providing an important corridor for human migrations across the region.5 In summary, our data indicate a significant male contribution from northern Africa (and ultimately Asia) to the gene pool of the central Sahel. The trans-Saharan population movements resulting in this genetic pattern would seem to mirror the spread of the proto-Chadic languages, and most likely took place during the early mid Holocene, a period when giant paleolakes may have provided a corridor for human migrations across what is now the Sahara desert. |
|
|
|
Post by Admin on Jul 22, 2022 17:21:24 GMT
The Entwined African and Asian Genetic Roots of the Medieval Peoples of the Swahili Coast Esther S. Brielle, Jeffrey Fleisher, Stephanie Wynne-Jones, Nasreen Broomandkhoshbacht, Kim Callan, Elizabeth Curtis, Lora Iliev, Ann Marie Lawson, Jonas Oppenheimer, Lijun Qiu, Kristin Stewardson, J. Noah Workman, Fatma Zalzala, George Ayodo, Agness O. Gidna, Angela Kabiru, Amandus Kwekason, Audax Z.P. Mabulla, Fredrick K. Manthi, Emmanuel Ndiema, Christine Ogola, Elizabeth Sawchuk, Lihadh Al-Gazali, Bassam R. Ali, Salma Ben-Salem, Thierry Letellier, Denis Pierron, Chantal Radimilahy, Jean-Aimé Rakotoarisoa, Brendan Culleton, Kendra Sirak, Swapan Mallick, Nadin Rohland, Nick Patterson, Mohammed Ali Mwenje, Khalfan Bini Ahmed, Mohamed Mchulla Mohamed, Sloan Williams, Janet Monge, Sibel Kusimba, Mary E. Prendergast, David Reich, Chapurukha M. Kusimba doi: doi.org/10.1101/2022.07.10.499442Abstract The peoples of the Swahili coast of eastern Africa established a literate urban culture by the second millennium CE. They traded across eastern Africa and the Indian Ocean and were among the first sub-Saharan practitioners of Islam. An open question has been the extent to which these early interactions between Africans and non-Africans were accompanied by genetic admixture. We report genome-wide ancient DNA from 80 individuals in five medieval and early modern (1300-1800 CE) coastal towns, as well as people from an inland town postdating 1650 CE. Over half of the ancestry of most coastal individuals came from African ancestors; these African ancestors were primarily female. A slightly smaller proportion of ancestry was from Asia. This Asian component was approximately eighty to ninety percent from Near Eastern males and ten to twenty percent from Indian females. Peoples of African and Asian origins began to mix by around 1000 CE, a time when archaeological evidence documents changes on the coast that are often interpreted as marking the large-scale adoption of Islam. Before roughly 1500 CE, the Near Eastern ancestry detected in the individuals was mainly Persian-related, consistent with the narrative of the Kilwa Chronicle, the oldest history told by the Swahili themselves. After this time, the sources of Near Eastern ancestry became increasingly Arabian, consistent with the archaeological and historical evidence of growing interactions between the Swahili coast and parts of southern Arabia. Subsequent interactions of Swahili coast peoples with other Asian and African groups further changed the ancestry of present-day peoples relative to the ancient individuals we sequenced, highlighting how Swahili genetic legacies can be more clearly understood with ancient DNA. Introduction The Swahili culture of eastern Africa has been defined by a set of shared features: a common language of African origin (Kiswahili), a shared predominant religion (Islam), and a geographic distribution in coastal towns, many of which have long served as trading centers, linking peoples across the Indian Ocean to peoples of inland Africa. In the late medieval and early modern period, Swahili people lived over a vast coastal region spanning present-day northern Mozambique to present-day southern Somalia and including islands (Madagascar) and archipelagoes (Comoros, Kilwa, Mafia, Zanzibar, Lamu) (yellow outlines in Figure 1A) [1, 2].  Figure 1: Dataset overview. A) The coastal areas associated with the Swahili culture are outlined in yellow. Sites included in this study are marked with black shapes and labeled on the zoom-in inset with the number of individuals, number of non-first-degree relatives with sufficient data to analyze extensively, and approximate date range. B) A three-dimensional principal component analysis shows present-day and ancient people studied in order to contextualize the ancestry of the Swahili individuals, labeled with asterisks. Eigenvector 1 correlates to variation maximized in sub-Saharan Africa. Together, eigenvectors 2 and 3 describe variation maximized in Eurasia. For 2D PCAs to aid visualization of the same data, see Extended Data Figure 3. C) Ancestry component assignment using ADMIXTURE with K=8 ancestral reference populations. Mtwapa, Manda, Kilwa, and some Songo Mnara individuals have evidence of shared ancestry with Near Eastern, South Asian, and African sources. Songo Mnara individuals appear to be heterogenous in their ancestry components and proportions, reflecting cosmopolitanism along the Swahili coast. The Lindi individual falls near people with western African ancestry including present-day Bantu speakers. |
|
|
|
Post by Admin on Jul 22, 2022 19:24:41 GMT
 Extended Data Figure 1 ADMIXTURE analysis, with K=10 ancestral reference populations. We used 262 populations (2248 individuals) including African populations genotyped with the Human Origins array along with some 1240K capture ancient samples from present-day Kenya, present-day Tanzania, and surrounding areas, Swahili coast present-day samples [28], ancient Israel_Natufian_published, and Pulliyar samples from present-day India. We were able to view a variety of African pastoral, farming, and forager ancestries within coastal and inland Swahili-speaking populations of the Human Origins dataset. Makwasinyi components of ancestry resemble those of the present-day coastal populations sampled by Brucato and colleagues [28], albeit with different proportions.  Extended Data Figure 2 DATES curves. Curves that show the exponential decay of linkage disequilibrium generated by mixture between two populations related differentially to the two sources as a function of the number of elapsed generations since the mixture event. Multiplying by a 28±2 year-to-generation conversion estimate and subtracting from the average calibrated radiocarbon dates of the ancient individuals (or the archaeologically estimated date) gives calendar years [78]  Extended Data Figure 3 Two dimensional PCAs. (Top) A PCA of the first and second eigenvectors for the same data as in Figure 1B. (Bottom) A PCA of the second and third eigenvectors for the same data as in Figure 1B. |
|

