|
|
Post by Admin on Dec 15, 2018 18:00:17 GMT
We applied this method to each Khoisan population in turn (with the exception of the Damara, who are genetically similar to non-Khoisan populations) using 45 other African and non-African populations as references (SI Appendix, Figs. S10–S23). In several populations there is evidence for two waves of population mixture (!Xuun, Taa_West, Taa_East, Nama, Khwe, G‖ana, and Ju|’hoan_South), whereas in others a single wave of population mixture fits the data (Fig. 4). For populations with two waves of mixture, west Eurasian ancestry entered through the earlier admixture event (Fig. 4 and SI Appendix, Table S3). In the Nama, both the early and more recent admixture events are predicted to involve populations with west Eurasian ancestry, consistent with known postcolonial European admixture in this population. The Taa_West also show two episodes of west Eurasian admixture, but the more recent one has low confidence.  Fig. 4. Mean times of admixture in southern and eastern Africa. It is important to mention a few caveats in interpreting results from this method. First, in cases in which the method detects two admixture events from the same source (as in the Nama and Taa_West above), simulations suggest an alternative interpretation is sustained population mixture over many generations (SI Appendix). Second, the numbers of admixture events inferred by this method are lower bounds; for example, this method fails to detect that the Naro are admixed between two distinct Khoisan groups (3), and we find evidence of west African ancestry in just four Khoisan populations (!Xuun, G‖ana, Khwe, and Taa_East) when treated individually (but see analyses of combined populations below). Finally, the method has low confidence when assigning an admixture event to a population with west African ancestry (Fig. 4); this reflects a relative lack of genetic drift specific to the west African reference populations (Yoruba and Mandenka), which makes it difficult to detect with high confidence (in contrast, there is considerable genetic drift in west Eurasian populations because of the out-of-Africa bottleneck, which allows admixture events to be more confidently assigned to this ancestry). In most populations in which our method detects only a single admixture event, the fitted model visually seems inadequate to fully explain the data (e.g., SI Appendix, Figs. S11, S13, S20, and S21). Indeed, there is marginal statistical evidence for two admixture events in many of these populations (SI Appendix, Table S4). To increase our power to detect additional admixture events, we performed analyses of combined populations. In a combined set of populations (the Tshwa, Shua, Hai‖om, ǂHoan, Naro, and Taa_North) that have marginal evidence for a second, more recent admixture event, we infer two dates of admixture: one 40 ± 2 generations ago and one 4 ± 1 generations ago (Z-score for the hypothesis that the admixture time is zero is 3.2. In a combined set of two populations (the Ju|’hoan_North and G|ui) that have marginal evidence for a second, more ancient admixture event, we also infer two dates of admixture (SI Appendix, Fig. S24), but with different dates from all other samples: one 30 ± 4 generations ago (Z-score of 6.9, Graphic) and one 109 ± 41 generations ago (Z-score of 2.6). We interpret this as suggestive evidence that the population that introduced west Eurasian ancestry to southern Africa was itself admixed, and that this more ancient admixture happened around 110 generations ago (although the confidence intervals here are clearly large). 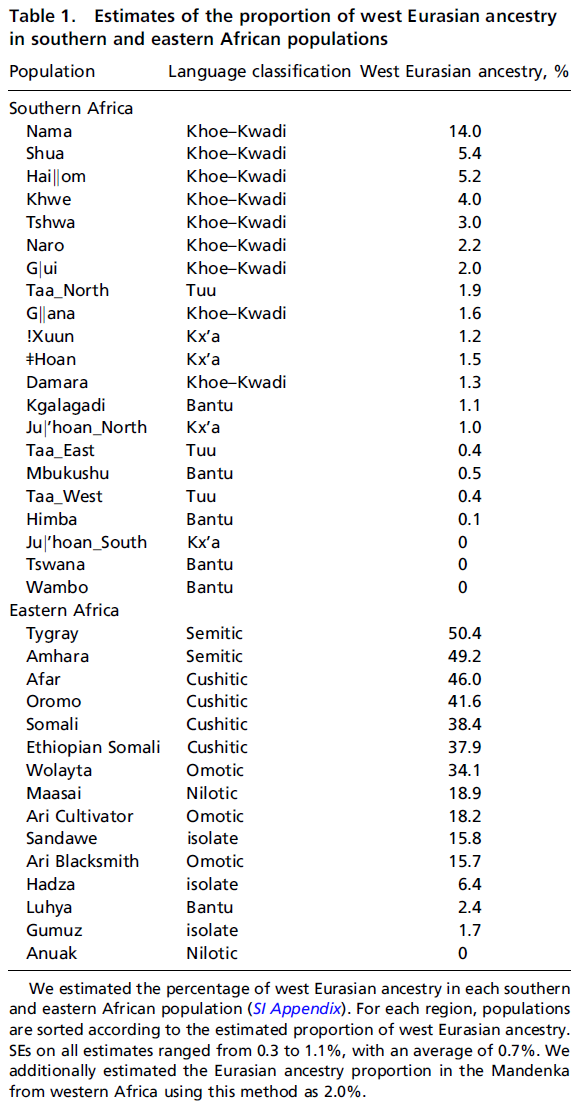 Origin of West Eurasian Ancestry in Southern Africa. We next considered the origin of the west Eurasian ancestry in southern Africa. Direct interactions between Europe and southern Africa seem unlikely given the inferred admixture dates, especially because this ancestry is widespread throughout southern Africa. It has been reported that many populations in eastern Africa admixed with populations from the Levant (10) or the Arabian peninsula (11). Because there is suggestive genetic evidence of a migration from eastern Africa to southern Africa (2, 3, 12) as well as linguistic and archaeological indications (13), we hypothesized that indirect gene flow through eastern Africa might be a plausible source for the west Eurasian ancestry in southern Africa. This hypothesis makes two major predictions: First, that the west Eurasian ancestry in eastern Africa should have the same source as that in southern Africa, and second, that the mixture times in eastern Africa should be older than those in southern Africa, perhaps with a date of around 110 generations (corresponding to the oldest date identified in southern Africa). To test these predictions, we assembled a dataset of individuals from southern Africa, eastern Africa, and west Eurasia typed on an Illumina platform by merging data from previous studies (10, 14⇓⇓–17). The eastern African populations in these combined data include populations from Ethiopia, Kenya, Tanzania, and Sudan [the majority of these populations were genotyped by Pagani et al. (10)]. We first confirmed using Graphic tests (8) that many eastern African populations have statistically significant evidence for admixture with west Eurasian populations (SI Appendix, Table S5). The smallest Graphic statistics in nearly all eastern African populations involve a southern European (or Levantine) population as one reference. We then evaluated the fraction of west Eurasian ancestry in each population, using the same Graphic ratio estimate as used in the Khoisan (Table 1, eastern Africa). The fraction of west Eurasian ancestry in eastern African populations is generally higher in eastern than in southern Africa; the highest levels of admixture (40–50%) are observed in some Ethiopian populations.  To test whether the west Eurasian ancestry in southern and eastern Africa is from the same source, we reconstructed the allele frequencies of the west Eurasian population involved in the admixture in eastern Africa (SI Appendix). We then tested whether this hypothetical population is a good proxy for the west Eurasian ancestry in southern Africa. Indeed, this reconstructed population is a better proxy than samples of modern Eurasians (Fig. 1C). In the Juhoansi (who correspond to the Ju|’hoan_North), we obtain an ALDER amplitude in the one-reference test of Graphic when using this imputed population as a reference versus Graphic when using Italians as a reference (one-sided P value for difference of 0.0015). We then applied our method for dating multiple admixture events to the eastern African populations in these data (SI Appendix, Figs. S25–S39). Pagani et al. (10) previously dated the earliest admixture events in Ethiopia to around 3,000 y ago, but with considerable variation between populations. We find evidence for multiple episodes of population mixture in eastern Africa; most populations have evidence for an early admixture event that we date to around 80–110 generations (2,400–3,300 y ago) (Fig. 4). As in southern Africa, the west Eurasian ancestry is present in the early admixture event (SI Appendix, Table S6). The earliest dates of population mixture that we estimate in eastern Africa are almost uniformly older than those we estimate in southern Africa (Fig. 4). One potential concern regarding this conclusion is that the southern and eastern African populations displayed in Fig. 4 were genotyped on different genotyping arrays; however, this pattern remains when using only populations typed on the same array (SI Appendix, Fig. S40). We conclude that the west Eurasian ancestry in southern Africa was likely brought by a migration of an already-admixed population from eastern Africa.  Back-to-Africa Gene Flow in Eastern Africa. A major open question concerns the initial source of the west Eurasian ancestry in eastern Africa. The estimated mean time of gene flow in eastern Africa is around 3,000 y ago, and the amount of gene flow must have been quite extensive, because the west Eurasian ancestry proportions reach 40–50% in some Ethiopian populations (Table 1 and ref. 10). Archaeological records from this region are sparse, so Pagani et al. (10) speculate that this admixture is related to the Biblical account of the Kingdom of Sheba. However, archaeological evidence is not completely absent. During this time period, architecture in the Ethiopian culture of D’mt has an “unmistakable South Arabian appearance in many details” (19), although there is some debate as to whether these patterns can be attributed to large movements of people versus elite-driven cultural practices (19, 20). Additionally, linguistic evidence suggests that this time period was when Ethiosemitic languages were introduced to Africa, presumably from southern Arabia (21). It is perhaps not a coincidence that the highest levels of west Eurasian ancestry in eastern Africa are found in the Amhara and Tygray, who speak Ethiosemitic languages and live in what was previously the territory of D’mt and the later kingdom of Aksum. West Eurasian Ancestry in Southern Africa. A second question is, Which population or populations introduced west Eurasian ancestry into southern Africa? The best genetic proxy for this ancestry that we have found is the west Eurasian ancestry in eastern Africa (Fig. 1C), and although we do not identify modern east African populations as the best source population, this is likely due to the lack of genetic drift specific to eastern Africa (SI Appendix, section 1.2.3). The most parsimonious explanation for this observation is that west Eurasian ancestry entered southern Africa indirectly via eastern Africa (the alternative scenario of direct contact with an unsampled west Eurasian population cannot formally be excluded; however, there is no archaeological, historical, or linguistic evidence of such contact). The relevant eastern African population may no longer exist. However, such a migration has been suggested based on shared Y chromosome haplotypes (12, 22) and shared alleles/haplotypes associated with lactase persistence (2, 23) between the two regions. Furthermore, based on a synthesis of archaeological, genetic, climatological, and linguistic data Güldemann (13) hypothesized that the ancestor of the Khoe–Kwadi languages in southern Africa was brought to the region by immigrating pastoralists from eastern Africa. Our observation of elevated west Eurasian ancestry in Khoe–Kwadi groups in general (Table 1) is consistent with this hypothesis. PNAS February 18, 2014 111 (7) 2632-2637 |
|
|
|
Post by Admin on Dec 16, 2018 17:59:48 GMT
Genetic origins of southern African individuals In order to examine the genetic ancestries of the six individuals, we applied ADMIXTURE11 and EIGENSOFT12 to the genotyping data set of 419,969 nuclear single-nucleotide polymorphism (SNP) genotypes from 1,448 worldwide individuals along with genotypes extracted from the 14 genome sequences for the same SNP loci (Supplementary Table 1). Figure 1 shows the results for selected populations, emphasizing our six individuals. Entire results are shown in Supplementary Figs 1–3. On the basis of the ADMIXTURE result, Khoisan populations include two different ancestries, northern Khoisan and southern Khoisan, with evidence of past gene flow within the Khoisan and/or between the Khoisan and non-Khoisan, except for the Ju/’hoansi population (Fig. 1a). Individuals NB1 and NB8 belong to the Ju/’hoansi (Fig. 1c) and appear to have only northern Khoisan ancestry (Fig. 1b). We also applied a different method13, which uses linkage disequilibrium decay, to detect admixture between the Ju/’hoansi and other populations and show the result in Supplementary Fig. 7.  Figure 1: Genetic relationships of six southern African individuals and worldwide populations. Inference of local ancestries along the genome using three-independent methods confirmed the exclusive Khoisan ancestry in the NB1 and NB8 genomes (Fig. 2, Supplementary Figs 4–7 and Supplementary Table 2). For the other Khoisan genomes—KB1, KB2 and MD8—the three methods and ADMIXTURE consistently assign 0.6–2.4% of each genome to western African ancestry (Supplementary Fig. 6 and Supplementary Table 2). ABT includes both western African and southern Khoisan ancestries, similar to the southeastern Bantu-speaking population (Fig. 1a). These results suggest a recent history of gene flow between the Khoisan and non-Khoisan populations, consistent with several other studies3,5,14,15,16, as well as, our previous report10 (Supplementary Fig. 8). However, we show here that two of the Ju/’hoansi genomes, NB1 and NB8, have no signature of admixture from non-Khoisan ancestries. Therefore their genome information allows us to access early population history of modern humans.  Figure 2: The local ancestry estimation for individual genomes. Population-history inference The Pairwise Sequentially Markovian Coalescent (PSMC) model17 was applied to the 14 whole-genome sequences in order to reconstruct the history of changes in effective population size (Ne) over time. We used a typically reported mutation rate, 2.5e−08 per site per generation (generation time=25 years) (ref. 18), to scale Ne and time (see details in Methods). The patterns of change in Ne are consistent among the four populations (Khoisan, Yoruba, European and Asian) prior to ~0.2 myr ago, declining in all cases from 2 to 0.5 myr ago and recovering by 0.2 myr ago (Fig. 3a). All four populations appear to have experienced bottlenecks in the period ~30–120 kyr ago (Fig. 3a), but the declines in Ne varied widely among them (Fig. 3b–e). The Khoisan Ne, the average of the two Ju/’hoansi genomes (NB1 and NB8), has been the largest since ~120 kyr ago and declined to 74% of their original peak Ne observed at about ~100–150 kyr ago, while the average Ne of the three Yoruba genomes declined to 31% of their original peak, followed by a slight recovery to 43%. The average Ne of each of two European and two Asian genomes declined even more, to only 9 and 8% of their original peak, respectively (Fig. 3a).  Figure 3: The changes in the effective population size on the basis of the 14 individual genomes. Several reports have found evidence of recent admixtures between the Khoisan and non-Khoisan populations15, a population structure within the Khoisan5,15 and the Bantu population expansion within Africa1. Since the PSMC only estimates changes of effective population size and does not account for population structure, we used these simulations to examine effects of recent demographic events on the PSMC estimates. The PSMC estimates from the sequences simulated under the models including recent demographic events are not significantly different from the estimate from the sequence simulated under the model without those events (Supplementary Fig. 9). These simulations demonstrate that the large Khoisan Ne and Yoruba population decline that we estimated from the Ju/’hoansi and Yoruba genomes are not a result of the recent demographic events. In addition, we could infer the divergence time of populations from the PSMC analysis, using male X chromosomes17. The earliest human population split has been known to be between the ancestral Khoisan and the ancestors of the other human populations and was estimated to take place ~110–150 kyr ago (refs 16, 19). Our PSMC analysis and a Bayesian inference19 support similar estimates, ~120–150 kyr ago (Supplementary Fig. 10) and ~95–130 kyr ago (Supplementary Fig. 11), respectively. On the basis of these results, we can reconstruct early history of modern-human populations. After the earliest split, between the ancestral Khoisan and non-Khoisan populations ~100–150 kyr ago, the ancestral Khoisan population maintained their high genetic diversity, while the effective population size of the non-Khoisan continued to decline for 30~120 kyr ago and lost more than half of its diversity. The ‘Out of Africa’ migration ~40–60 kyr ago (ref. 20) accounts for the observed population split between African and non-African populations, and the subsequent smaller effective population size of non-Africans compared with non-Khoisan Africans.  Figure 4: The climate changes in the African continent. On the basis of the parallel found between climate changes with the divergent-population history within Africa, we propose the following hypothesis regarding early human history. Modern humans may have originated anywhere in Africa and spread across the continent, with continuous gene flow among the populations. From ~100–150 kyr ago, the human species was geographically structured within Africa and eventually differentiated genetically owing to limited gene flow. At or after the time of the population differentiation, a drier climate began to affect the western and central, but not the southern regions of the African continent. This potentially contributed to a relatively severe decline in the western African populations (ancestors of the current Bantu-speaking populations) while the size of southern African populations, ancestors of the current Khoisan, was maintained or declined to a much lesser degree. Non-Africans, the majority of modern humans alive on the planet today, represent a subpopulation split from the ancestral non-Khoisan African population3,8,15, and their genetic diversity further dramatically decreased during their migration from Africa to Eurasia (Supplementary Fig. 12). As described in the Methods, a neutral mutation rate of 2.5e−08 was used to scale the time axis in our PSMC analysis. However, recent studies have reported a lower mutation rate30,31,32 than the one we used. If we use the lower mutation rate, the population-history differentiation starts about 100 kyr earlier, ~200–250 kyr ago (Supplementary Fig. 13). Our hypothesis regarding early human history still holds with this lower mutation rate, as this would put the population-history divergence at or after the time close to the initial stages of the next-to-last glacial ~200 kyr ago (Fig. 4) (refs 22, 24), when an important determinant of precipitation would be changing in a way similar to what happened ~100 kyr ago. Nature Communications volume 5, Article number: 5692 (2014) |
|
|
|
Post by Admin on Jan 1, 2019 18:26:21 GMT
 Fig. 1. Geographical location (Left) and calibrated radiocarbon date (Right) of the samples included in this study, as well as other ancient DNA samples from the literature. One of the greatest transitions in human history was the transition from the hunter-gatherer lifestyle to farming. How farming traditions expanded from their birthplace in the Fertile Crescent has been a matter of contention. Two models have been proposed: one involving the movement of people; the other based on the transmission of ideas. Over the last decade, paleogenomics has been instrumental in settling long-disputed archaeological questions (1), including those surrounding the Neolithic revolution (2). Compared with the extensive genetic work done on Europe and the Near East, the Neolithic transition in North Africa, including the Maghreb, remains largely uncharacterized. Archaeological evidence suggests that some of the major innovations associated with the Neolithic, such as farming and pottery production, could have been introduced into northern Morocco through sea voyaging by people from Iberia or the central Mediterranean as early as around 5,400 BCE (3, 4). In fact, some of the Neolithic pottery recorded in North Africa strongly resembles that of European cultures, like the Cardial Early Neolithic (the Mediterranean early farmer culture located in Iberia; ref. 5). However, other innovations, such as some pottery traditions and bone and lithic technical customs, could be the result of in situ development from Epipaleolithic communities, indicating a strong continuity in the local population since the Late Pleistocene (6⇓⇓⇓–10). Genetic data from present-day populations (11⇓–13) suggests that North African ancestry has contributions from four main sources: (i) an autochthonous Maghrebi component related to a back migration to Africa ∼12,000 y ago from Eurasia; (ii) a Middle Eastern component probably associated with the Arab conquest; (iii) a sub-Saharan component derived from trans-Saharan migrations; and (iv) a European component that has been linked to recent historic movements. Paleogenomic studies have begun to provide insights into North African prehistory (14⇓–16), including the analysis of Later Stone Age samples from Morocco (17); however, no research to date has tested whether the Neolithic transition in the Maghreb was driven by local populations who adopted cultural and technological innovations or by the migration of people. Here, we perform genome-wide analysis of remains from the Early Neolithic site of Ifri n’Amr or Moussa (IAM) (∼5,000 BCE; n = 7) and the Late Neolithic site of Kelif el Boroud (KEB) (∼3,000 BCE; n = 8) (SI Appendix, Supplementary Note 1). To test possible migrations through the Strait of Gibraltar, we also analyzed human remains from the southern Iberian Early Neolithic site of El Toro (TOR) (∼5,000 BCE; n = 12) (Fig. 1). This Iberian Early Neolithic culture resembles certain early Maghrebi traditions (e.g., similar pottery decoration and similar bone and lithic tool productions), suggesting a North African influence (18) (SI Appendix, Supplementary Note 1). Including these southern Iberian samples in our analysis enabled a direct test of this hypothesis.  Fig. 2. Ancestry inference in ancient samples from North Africa and the Iberian Peninsula (ancient population codes are as in Fig. 1). (A) PCA analysis using the Human Origins panel (European, Middle Eastern, and North African populations) and LASER projection of aDNA samples. (B) ADMIXTURE analysis using the Human Origins dataset (European, Middle Eastern, and North African populations) for modern and ancient samples (K = 8). (C) Detailed ADMIXTURE plot for European Neolithic samples from previous analysis (K = 8). (D) Detail of ADMIXTURE analysis using the Human Origins dataset (European, Middle Eastern, North African, and sub-Saharan African populations) for modern and ancient samples, including Taforalt. Mitochondrial DNA (mtDNA) and Y chromosome haplogroups obtained for IAM (Moroccan Early Neolithic) and KEB (Moroccan Late Neolithic) suggest either a population replacement or an important genetic influx into Morocco between 5,000 and 3,000 BCE. IAM samples belong to the mtDNA haplogroups U6a and M1—both of which are associated with the back migration to Africa from Eurasia in Upper Paleolithic times (19, 20) and observed in Moroccan Later Stone Age individuals (17)—whereas KEB samples belong to haplogroups K1, T2, and X2, which are prominently found in Anatolian and European Neolithic samples (2, 21) (SI Appendix, Supplementary Note 4). Regarding the paternal lineages, IAM individuals carry Y chromosomes distantly related to the typically North African E-M81 haplogroup, while the Y chromosome from KEB belongs to the T-M184 haplogroup; although scarce and broadly distributed today, this haplogroup has also been observed in European Neolithic individuals (16) (SI Appendix, Supplementary Note 5). Both mtDNA and Y chromosome lineages (K1, J2, and T2 haplogroups and G-M201 haplogroup, respectively) for samples from TOR (Iberian Early Neolithic) are similar to those observed in Europe during Neolithic times (21).Ancient samples were projected on a principal components analysis (PCA) space, which was built using sub-Saharan African, North African, European, and Middle Eastern populations from the Human Genome Diversity Project (HGDP) dataset genotyped with MEGA. In the PCA, IAM samples are placed close to Mozabites (Berber group inhabiting the Mʾzab oases of southern Algeria), while Iberian Neolithic samples fall close to southern European populations (SI Appendix, Supplementary Note 6). As suspected from the mtDNA and Y chromosome data, KEB samples do not cluster with IAM and are placed in an intermediate position between IAM and TOR. We further explored the genetic structure of these samples using the program ADMIXTURE (22) (SI Appendix, Supplementary Note 7). At K = 5, TOR is composed of the component associated with the European Early Neolithic and IAM is composed of the North African component observed in Mozabites. KEB is placed in an intermediate position, with ∼50% each of European Early Neolithic and North African ancestries. It is worth mentioning that, compared with current North African samples, IAM and KEB do not show any sub-Saharan African ancestry in the MEGA-HGDP ADMIXTURE analysis, suggesting that trans-Saharan migrations occurred after Neolithic times. This could be in agreement with the analysis of present-day genome-wide data from Morocco, which estimated a migration of western African origin into Morocco only ∼1,200 y ago (11). West Eurasian populations can be modeled as the admixture of four different ancestral components (2): Eastern and Western European hunter-gatherer and Iranian and Levantine Neolithic. We explored the placement of Moroccan and Southern Iberian Neolithic samples in this context and compared their genetic affinities to ancient and present-day West Eurasian and Levant populations in the Human Origins panel, as well as to other available aDNA population data. Interestingly, PCA revealed that IAM individuals are similar to North African Later Stone Age samples from the Taforalt site in Morocco, dated ∼15,000 y ago (Fig. 2 and SI Appendix, Supplementary Note 6). When projected, IAM samples are halfway between Taforalt and modern North Africans, in the Levantine corner of the PCA space (Fig. 2). Southern Iberian Neolithic individuals from TOR cluster with Sardinians and with other Anatolian and European Neolithic samples. Moreover, KEB samples are placed halfway between the IAM and Anatolian/European farmer clusters, in close proximity to Levant aDNA samples and also to Guanche samples (16) (from the indigenous population of the Canary Islands known to have a Berber origin; ref. 23). When compared using ADMIXTURE (SI Appendix, Supplementary Note 7), IAM samples possess ∼100% of a component partially shared by aDNA samples from the Levant (Fig. 2). This IAM-like component is observed mainly in modern North African individuals, following a west-to-east cline, and in the Guanches. Interestingly, the Early Neolithic individuals from Iberia form a different cluster from the Anatolian, Aegean, and European Early Neolithic samples, sharing their main component with Middle Neolithic/Chalcolithic samples. Lastly, KEB can be explained as having both IAM-like and Iberian Early Neolithic components (Fig. 2). The same admixture profile is observed in the Guanche samples, but the amount of IAM ancestry is consistently higher in all of the samples. Given that the Guanches could have originated in a different area of the Maghreb, this result might suggest that the European Neolithic impact in North Africa was heterogeneous. |
|
|
|
Post by Admin on Jan 2, 2019 18:09:27 GMT
To further investigate the genetic affinities of IAM, KEB, and TOR samples, we conducted outgroup f3-statistic analysis (24). When using an outgroup population that has not experienced any postdivergence gene flow with either one of the compared populations, the f3-statistic calculated in the form f3(PopA, PopB; outgroup) allows us to determine the amount of shared drift between two populations, PopA and PopB. We selected the Ju\ʼhoan population as the outgroup, and compared our three ancient populations (IAM, KEB, and TOR) against all of the ancient populations in the Human Origins panel, as well as the Taforalt and Guanche samples. The highest f3 values for IAM are observed for Taforalt (0.3060) and KEB (0.2296). Consistent with previous results, when Taforalt, KEB, and Guanches (f3 = 0.2196) are excluded, IAM shares more drift with ancient Levantine populations, such as Epipaleolithic communities (Natufians; f3 = 0.2296) and Pre-Pottery Neolithic individuals (f3 = 0.2167) (Fig. 3 and SI Appendix, Supplementary Note 10), than with any other ancient population. This confirms previous results for Taforalt (17) indicating a Levantine intrusion in North Africa in Paleolithic times. To explore further the connection between IAM and Levantine populations, we performed an f4-statistic analysis to test whether IAM shares more alleles with any other population in the Human Origins panel (2, 25) than with ancient populations from the Levant (SI Appendix, Supplementary Note 10). When calculated in the form f4(IAM, chimpanzee; Levantine population, African population), a positive f4-statistic value would indicate that the test population shares more alleles with Levantine than with African populations. Consistently, all comparisons produced significant positive values and indicated a higher similarity of IAM with Natufians and Levantine farmers. This suggests that most of IAM ancestry originates from an out-of-Africa source, as IAM shares more alleles with Levantines than with any sub-Saharan Africans, including the 4,500-y-old genome from Ethiopia (14). To further test the hypothesis that IAM is more closely related to out-of-Africa populations, we determined whether we could detect Neanderthal ancestry in IAM, which is typical of non-African populations. A signal of Neanderthal ancestry has been detected in modern North African populations (26). A lack of Neanderthal ancestry in IAM would imply that the signal observed today is a product of more recent migration into North Africa from the Middle East and Europe in historical times. Compared with the Neanderthal high coverage genome sequence from Altai (27) and the low-coverage sequence from Vindija Cave (28), and using the S statistic (24), we detected a Neanderthal introgression signal into IAM, suggesting derivation from the same event shared by non-African populations (SI Appendix, Supplementary Note 10)  Fig. 3. Outgroup f3-statistic for IAM (A), KEB (B), and TOR (C); admixture f4-statistic for IAM (D) and admixture f3-statistic for KEB (E). FST and outgroup-f3 distances indicate a high similarity between IAM and Taforalt. As observed for IAM, most Taforalt sample ancestry derives from Epipaleolithic populations from the Levant. However, van de Loosdrecht et al. (17) also reported that one third of Taforalt ancestry was of sub-Saharan African origin. To confirm whether IAM individuals show a sub-Saharan African component, we calculated f4(chimpanzee, African population; Natufian, IAM) in such a way that a positive result for f4 would indicate that IAM is composed both of Levantine and African ancestries. Consistent with the results observed for Taforalt, f4 values are significantly positive for West African populations, with the highest value observed for Gambian and Mandenka (Fig. 3 and SI Appendix, Supplementary Note 10). Together, these results indicate the presence of the same ancestral components in ∼15,000-y-old and ∼7,000-y-old populations from Morocco, strongly suggesting a temporal continuity between Later Stone Age and Early Neolithic populations in the Maghreb. However, it is important to take into account that the number of ancient genomes available for comparison is still low and future sampling can provide further refinement in the evolutionary history of North Africa. Both FST and outgroup-f3 statistical analyses indicate that KEB shares ancestry with IAM, as well as more genetic drift with Neolithic and Chalcolithic populations from Anatolia and Europe, with the highest shared genetic drift appearing in Iberian Early Neolithic samples (Fig. 3 and SI Appendix, Supplementary Note 10). This pattern and the result from ADMIXTURE could be explained if the KEB population was a mixture between IAM-related and European Neolithic groups. To formally test this hypothesis, we used an admixture-f3 test (24). When calculated in the form f3(PopA, PopB; target), a negative value of the f3-statistic is indicative of the target population being a mixture of both PopA and PopB populations. For our analysis, we used KEB as the test population, IAM as a reference population, and one of the Anatolian and European Neolithic and Chalcolithic populations as the second reference population. All comparisons produced negative values of the f3-statistic, which suggests that the KEB population can be modeled as a mixture of IAM and Anatolian/European Neolithic.  Lastly, although limited by low coverage, phenotypic predictions based on genetic variants of known effects agree with our estimates of global ancestry. IAM people did not possess any of the European SNPs associated with light pigmentation, and most likely had dark skin and eyes. IAM samples contain ancestral alleles for pigmentation-associated variants present in SLC24A5 (rs1426654), SLC45A2 (rs16891982), and OCA2 (rs1800401 and 12913832) genes. On the other hand, KEB individuals exhibit some European-derived alleles that predispose individuals to lighter skin and eye color, including those on genes SLC24A5 (rs1426654) and OCA2 (rs1800401) (SI Appendix, Supplementary Note 11). Genetic analyses have revealed that the population history of modern North Africans is quite complex (11). Based on our aDNA analysis, we identify an Early Neolithic Moroccan component that is (i) restricted to North Africa in present-day populations (11); (ii) the sole ancestry in IAM samples; and (iii) similar to the one observed in Later Stone Age samples from Morocco (17). We conclude that this component, distantly related to that of Epipaleolithic communities from the Levant, represents the autochthonous Maghrebi ancestry associated with Berber populations. Our data suggests that human populations were isolated in the Maghreb since Upper Paleolithic times. Our hypothesis is in agreement with archaeological research pointing to the first stage of the Neolithic expansion in Morocco as the result of a local population that adopted some technological innovations, such as pottery production or farming, from neighboring areas. PNAS June 26, 2018 115 (26) 6774-6779; published ahead of print June 12, 2018 |
|
|
|
Post by Admin on Jan 3, 2019 18:30:57 GMT
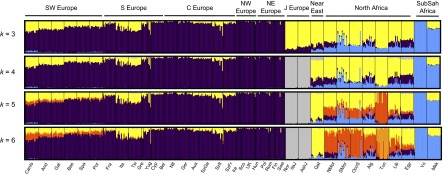 Fig. 1. Allele-based estimates of ancestry in Europe and for European Jews, the Near East, North Africa, and Sub-Saharan Africa. At k = 4, the ancestry assignment differentiated between non-Jewish European populations (from now on referred to as “European”), European Jews, Sub-Saharan Africans, and a group formed by Near Eastern and North African populations. At k = 5,6 components mainly assigned to North African populations and Tunisian Berbers, respectively, clearly appear. European populations sharing this North African ancestral component are almost exclusively in southern Europe (Fig. 1 and SI Appendix, Fig. S3). Southern European populations have a high proportion (5–35%) of joint Near Eastern | North African ancestry assigned at k = 4. However, identification of distinct Near Eastern and North African ancestries in k ≥ 5 differentiates southeastern from southwestern Europe. Southwestern European populations average between 4% and 20% of their genomes assigned to a North African ancestral cluster (SI Appendix, Fig. S3), whereas this value does not exceed 2% in southeastern European populations. Contrary to past observations, Sub-Saharan ancestry is detected at <1% in Europe, with the exception of the Canary Islands. In summary, when North African populations are included as a source, allele frequency-based clustering indicates better assignment to North African than to Sub-Saharan ancestry, and estimates of African ancestry in European populations increase relative to previous studies. European ancestry is also detected in North African populations. At k = 6 it ranges between 4% and 16% in the rest of North Africa, with notable intrapopulation variation (35) and is absent in most Maghrebi (western North African) individuals from Tunisia and Western Sahara. To test whether our results were robust to the inference procedure in ADMIXTURE, we compared the ADMIXTURE results to those from a supervised machine learning algorithm, RFMix (36). Our analysis assumed three putative source populations for ancestry in Europeans: German, Saharawi, and Qatari. Estimates of North African ancestry range between 5% and 14% in the European populations and trends of the overall ancestry clines are concordant with ADMIXTURE (SI Appendix, Table S2 and Fig. S4). We tested whether ADMIXTURE could accurately infer North African ancestry proportions in Europeans via simulation of historical admixture scenarios; we find that k = 4,5 gave more accurate admixture estimates of North African ancestry. The correlation between the simulated North African ancestry and the one inferred with ADMIXTURE dramatically increases from k = 3,4 in all simulated populations (SI Appendix, Fig. S4) and the average difference in ancestry proportions at the individual level decreases from 0.04 to 0.02 when 4 or 5 ancestral components are considered. 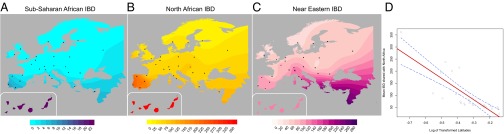 Fig. 2. Haplotype-based estimates of genetic sharing between Europe and Africa show a significant latitudinal gradient where the highest sharing is in the Iberian Peninsula. A gradient of shared IBD segments is observed from southern to northern Europe (based on WEA; Fig. 2 and SI Appendix, Table S3). This sharing is highest in the Iberian Peninsula for both North Africa and Sub-Saharan African IBD segments. Interestingly, the Basques are an exception to this pattern because they show similar levels of sharing to other European populations, but inhabit the Iberian Peninsula. Additionally, IBD sharing between North Africa and Europe is nearly an order of magnitude higher than that between Sub-Saharan Africa and Europe, of which a total of 30% of its IBD segments are also shared between North Africa and Europe. Interestingly, these segments represent only 2% of the bulk of IBD segments shared between North Africa and Europe, a proportion similar to that found in previous studies based only on Sub-Saharan populations (9). Considering that only 2% of the segments shared between North Africa and Europe have a Sub-Saharan origin, it is not likely that the gradients observed in Fig. 2B is driven primarily by theSub-Saharan segments. Finally, high correlation (0.83) exists among the values of WEA between Sub-Saharan Africa and Europe, and North Africa and Europe. Overall, these results support the hypothesis that Sub-Saharan gene flow detected in Europe entered with North African gene flow. We regressed the North African–European IBD metric (WEA) on the sine of latitude to evaluate the strength of this gradient and find a significant relationship across southern-to-northern Europe, P = 7.4 × 10⁻⁸ (Fig. 2D). To pinpoint which specific North African regions exchanged migrants with Europe, we calculated WEA between a given European population and each of the seven North African and Near Eastern populations (Fig. 3 and SI Appendix, Table S3). Southwestern European populations, and in particular the Canary Islands, show the highest levels of IBD sharing with northwestern African populations (i.e., the Maghreb: Morocco, Western Sahara, Algeria, and Tunisia), whereas southeastern European populations share more IBD segments with Egypt and the Near East (SI Appendix, Fig. S7). Whereas inferred IBD sharing does not indicate directionality, the North African samples that have highest IBD sharing with Iberian populations also tend to have the lowest proportion of the European cluster in ADMIXTURE (Fig. 1), e.g., Saharawi, Tunisian Berbers, and South Moroccans. For example, the Andalucians share many IBD segments with the Tunisians (Fig. 3), who present extremely minimal levels of European ancestry. This suggests that gene flow occurred from Africa to Europe rather than the other way around. 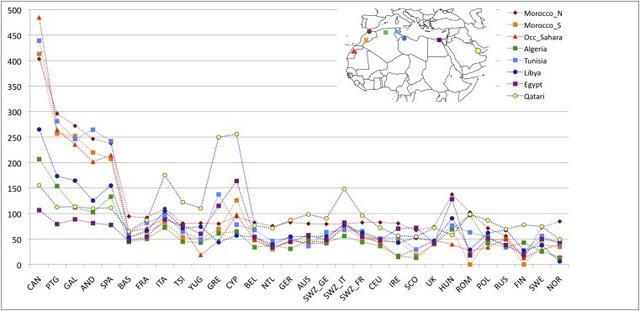 Fig. 3. Population-specific estimates of haplotype sharing (in centimorgans) between North Africa and Europe. Estimates of WEA (scaled by 100 for ease of presentation) between each European population (x axis) and each North African population and the Qatari are represented by colors and symbols. These results also rule out a model where observed sharing between Europe and North Africa is the result of recent gene flow from the Near East into both regions. We compared IBD between Qatari (the best Near Eastern representatives genotyped with the Affymetrix platform currently available, SI Appendix, Fig. S8), Europe, and North Africa. As shown in Fig. 3 and SI Appendix, Fig. S7), southwestern Europe has more IBD segments shared with the Maghreb than Qatar, whereas eastern Mediterranean populations share more segments IBD with the Near East than with western North Africa. On the other hand, northern European populations show only limited IBD sharing with both North Africa and the Near East (Figs. 2C and and33 and SI Appendix, Fig. S7). The southwest-to-northeast gradient of North African IBD sharing (Fig. 2B) and the distinct peak in sharing between Iberia and the Maghreb (Fig. 3) indicate that sharing in southwestern Europe is independent of gene flow from the Near East. It is possible that this sharp peak of North African IBD sharing in Iberia contributes to the apparent isolation of Iberian populations from other Europeans (43). 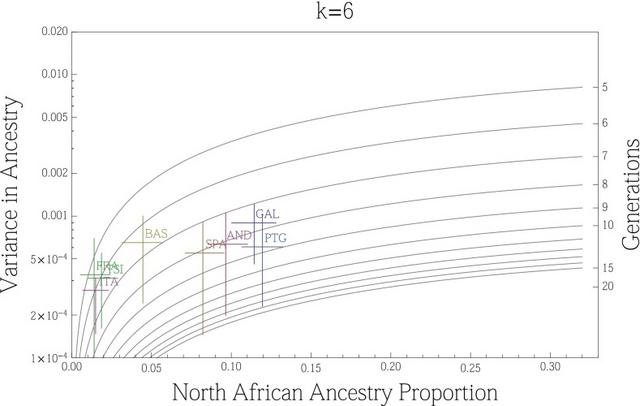 Fig. 4. Variance in ancestry proportions within populations depends on the overall ancestry proportions in the population and the time of gene flow. Implications of Gene Flow from North Africa to Europe. Time since admixture estimates. The variance in ancestry assignments for individuals within a population depends on the total ancestry proportions, the timing and duration of gene flow, population structure and/or assortative mating within the population, and errors in assignment (30, 44). We used variance in ancestry proportions across individuals estimated with ADMIXTURE to infer effective admixture times, i.e., the times required to achieve the observed variance in the population given a single gene flow event in a randomly mating population (see model from ref. 30). Focusing on the North African component at k = 6, we found that a migration event from North Africa to Europe would have occurred at least 6–10 generations ago (∼240–300 ya) in Spain, and at least 5–7 generations ago in France and Italy (Fig. 4). The pattern of North African ancestry at k = 7 remains very similar to the pattern at k = 6 with the estimate of admixture time decreasing 1 generation on average for Iberian populations (SI Appendix, Fig. S9). Because population structure, continuous gene flow, assortative mating, and errors in assignments may considerably increase the variance (and thus reduce the effective migration time), we consider these time estimates to be lower bounds: under all of the proposed variance-increasing scenarios, there must be a substantial proportion of migration that has occurred before the effective migration time, possibly much earlier. We additionally compare the estimate variance in ancestry from simulated populations to that predicted by a pulse model of migration. We found that the estimates were consistent with the actual number of generations since migration began, within confidence intervals obtained from bootstrapping over simulations (SI Appendix, Figs. S10 and S11). Additionally, these estimates were robust to imperfect inference of the North African ancestry or source population when the pulse of gene flow occurred less than 15 generations ago. Proc Natl Acad Sci U S A. 2013 Jul 16; 110(29): 11791–11796. |
|

