|
|
Post by Admin on Jan 13, 2019 20:09:52 GMT
 The routes followed by fully modern humans as they expanded out of Africa 50,000–100,000 years ago into Eurasia have long been a central question of anthropology1 and have important implications for understanding the evolutionary history of all non-African populations. So far, neither fossil and archaeological2–4 nor genetic5,6 evidence has been able to distinguish between an exit through Egypt and Sinai (northern route)7 or one through Ethiopia, the Bab el Mandeb strait, and the Arabian Peninsula (southern route).8–10 Genetic evidence has more often been interpreted as favoring a southern route,5,6,9 although the Neandertal admixture present in all non-Africans11 is more readily explained by a northern route given that Neandertal fossils are currently known from the Levant, but not from the southern part of the Arabian Peninsula.12 Thus, the available evidence remains inconclusive. Information to discriminate between the northern and southern routes might still be present in Africa within the full genomes of the populations inhabiting modern Egypt and the Horn of Africa, and thus further investigation is warranted. However, although it might not be easy to extract this information because of the past and recent genetic introgression experienced by these populations,13,14 full sequences of Northeast African genomes would provide the best starting point for these and other analyses. Using ADMIXTURE17 and principal-component analysis (PCA)18 (Figure 1A), we estimated the average proportion of non-African ancestry in the Egyptians to be 80% and dated the midpoint of the admixture event by using ALDER20 to around 750 years ago (Table S2), consistent with the Islamic expansion and dates reported previously.13,14 The Ethiopian populations showed, as expected, a more variable spectrum of genetic introgression (Figure 1B). Consistent with previous reports,13 the Amhara and Oromo were shown to have around 50% of their genome derived from non-Africans, the introgressed proportion in the Somali and Wolayta amounted to 40%–30%, and the Gumuz showed negligible amounts of non-African admixture. The date of the midpoint of these admixture events was 2,500–3,000 years ago (Table S2), although one notable exception was the Oromo, who have shown evidence of multiple admixture events.21 These conclusions are consistent with previous reports13,21 and fit with linguistic records.22 Furthermore, the distribution of maternal (mtDNA) and paternal (Ychr) lineages revealed sex-biased admixture patterns in Ethiopians (Figure S2), such that there was less male-mediated than female-mediated Middle Eastern backflow. The affinity of the Egyptian African component with the modern East and West African populations (green component in Figure 1B, K = 5) could be due to either a continuity of human presence in the area or recent gene flow from neighboring African regions resulting from demographic processes and slave trade over the last two millennia.23 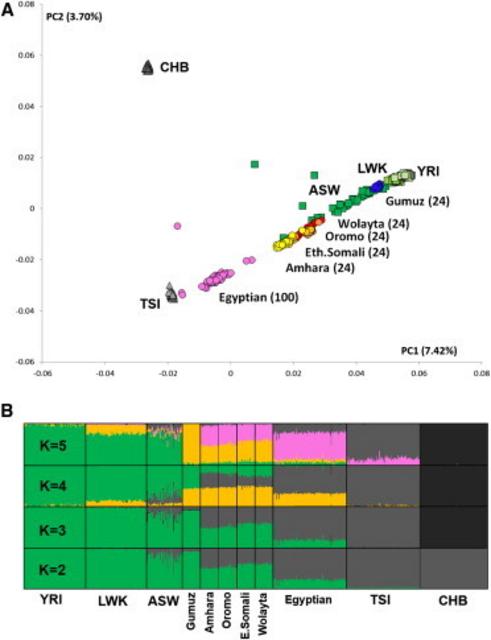 Figure 1 PCA and ADMIXTURE Analysis In order to filter out, through masking, the Eurasian portion identified in this way, we phased the samples by using ShapeIT24 and processed them with PCAdmix.25 In the masking process, Europeans (CEU [Utah residents with ancestry from northern and western Europe from the CEPH collection])15 were used as a proxy for the non-African component, and the Gumuz (the Ethiopian population showing minimal introgression) were used as a proxy for the African component. Pairwise FST26 was calculated before and after the masking process (Table S3), highlighting the expected trend of increased distance of the admixed populations from non-Africans when we retained only their African component. After we excluded the Gumuz themselves from the subsequent analyses, we compared the African components of the masked Ethiopian and Egyptian genomes (hereafter referred to as the Ethiopian′ and Egyptian′ genomes, respectively) with a set of West African (YRI [Yoruba in Ibadan, Nigeria]) and OOA populations spanning Eurasia (East Asian CHB [Han Chinese in Beijing, China], European TSI [Toscani in Italia] and CEU [Figure 2], and South Asian GIH [Gujarati Indians in Houston, Texas] [Figure S6]) in order to look for a signature of the OOA migration. Such a signature was defined as a higher similarity between the Ethiopian′ or Egyptian′ genomes and the non-Africans than between the latter and the YRI. If we assume a stepwise differentiation out of Africa, and if the preferential route followed was the northern one, Egyptian′ samples should share the highest number of haplotypes with the Eurasian samples even after recent events of introgression are controlled for. Conversely, Ethiopian′ samples would show the highest haplotype sharing with the Eurasian samples if the southern route was preferentially followed during the OOA migration. We restricted this comparison to 18,114 genomic regions (spanning a total length of 7.1 Mb; Figure S5) containing haplotypes shared by Europeans and Asians because these were likely to predate the split between these populations. Given the broad occurrence of these regions outside Africa, we could rule out positive selection as a plausible driver of the observed linkage-disequilibrium (LD) pattern. We identified these regions by calculating LD blocks in a set of 457 non-African samples. We retrieved 41,141 haplotypes at these loci in the Egyptian′, Ethiopian′, or YRI samples (Figure 2A) and used them to estimate the genetic similarity between OOA populations CHB and TSI and each of the three African populations. 85% of the haplotypes were present in all three African populations and were discarded as non-informative. The remaining 15% of haplotypes were instead observed in only one or two African populations. For these haplotypes that could discriminate between the African populations, the combined CHB and TSI samples showed more Egyptian′-specific (1.25-fold, p = 2 × 10⁻⁶) and Ethiopian′- and Egyptian′-specific (hereafter Ethiopian′|Egyptian′-specific) (1.15-fold, p = 9 × 10⁻⁶) haplotypes than did any of the other African haplotype sets (Figure 2B). We further explored the observed enrichment of Egyptian′ haplotypes in the CHB and TSI samples by investigating the frequency of each class of haplotype in the combined CHB and TSI samples, and again, the frequencies of Egyptian′-specific and Egyptian′|Ethiopian′-specific haplotypes were highest (Figures 2C and 2D). The enrichment of Egyptian′ haplotypes in the genetic pool of the CHB and TSI samples points to a northern migration as the greater contributor to populations outside Africa. 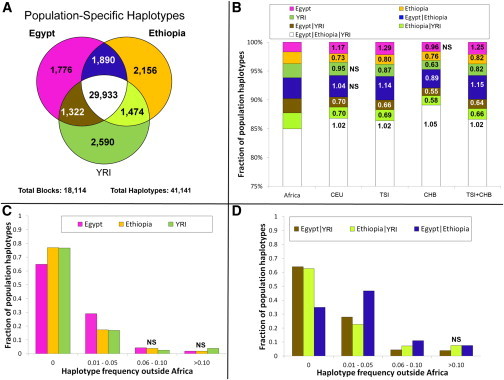 Figure 2 Haplotype Sharing between African and Non-African Populations This finding was robust to a wide range of potential artifacts stemming from uncertainties in the masking process (Figures S3, S4, and S6A; Table S4; note particularly the false-positive rate displayed in column 8) and was replicated in a South Asian population (GIH; Figure S6B). Furthermore, we showed with simulations that the error rate present in the masking process (Table S4) was unlikely to affect our findings (Figures S4 and S6). Even when we added a 10% misclassification error to the Ethiopians, Egyptians held as the African population showing the highest affinity to non-Africans. Alternative scenarios involving early back-to-Africa migrations27 as the source of haplotype sharing between Egyptian′ and non-African samples were considered as sources of the observed pattern. However, such confounding backflow would need to have taken place prior to the split between East Asians and Europeans (ca. ∼40,000 years ago) and, if this genetic component originated from the main OOA founding event, is likely to have been removed by the non-African masking procedure, which was designed for this purpose. To provide an independent test of our finding, we analyzed three Egyptian and five Ethiopian high-coverage genomes with the multiple sequentially Markovian coalescent (MSMC) approach before and after masking and compared them with a set of publicly available high-coverage genomes.15,28 MSMC,29 an extension of the PSMC30 method to two or four genomes, estimates the split time between pairs of genomes. Consistent with their admixed nature, the split times of the non-masked Egyptians and the mixed Ethiopians from Europeans (CEU) and West Africans (YRI) were much closer to each other than to the same split times measured in the non-admixed Ethiopian population (Gumuz) (Figure 3; Figure S7). If we consider the genetic split between two populations as a process gradually occurring over thousands of years, two independent splits might show partial overlaps when their midpoints are less than a few thousand years apart. Keeping in mind this potential confounder, the Ethiopian′ and Egyptian′ genomes showed different patterns. In particular, the Egyptian′ genomes displayed a more recent split from both the West African (21,000 years ago) and the non-African (55,000 years ago) genomes than did the Ethiopian′ genomes (37,000 and 65,000 years ago, respectively). This suggests a higher similarity between non-African and Egyptian′ components than between non-African and Ethiopian′ components, which is consistent with the fact that Egypt is the last stop on the way out of Africa. Such split dates21 also hint at a recent interaction between Egyptians and West Africans (Figure 3). 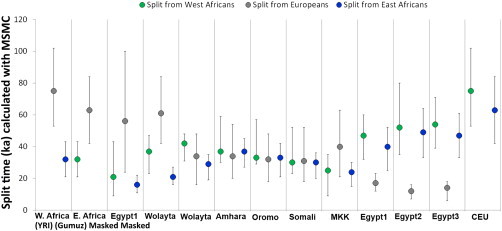 Figure 3 Inferred Split Times between Pairs of High-Coverage Genomes In conclusion, the analysis of Ethiopian′ and Egyptian′ whole-genome sequence data identifies modern Egyptians as the African population whose genome and haplotype frequency most closely resemble those of non-African populations. The fact that we could identify in Egyptians an African genomic component that is distinct from West and East African components further supports a minor degree of population continuity in Egypt since the OOA dispersal. These findings point to the northern route as the preferential direction taken out of Africa. In doing this, they resolve the puzzles of archaeological similarities and Neandertal admixture, which are readily accommodated by a northern-exit model, but not by a southern exit, and fit well with the recent discovery of human remains dating to around 55,000 years ago in Israel (close to the northern route).31 Furthermore, the data generated here provide a better source of information for spatially explicit demographic models.32,33 Our analysis does not address controversies about the timing and possible complexities of the expansion out of Africa and highlights the need for further analyses, ideally including ancient DNA, as well as Near Eastern and Papuan or Australian genomes representative of an early coastal expansion, to further resolve these issues. Am J Hum Genet. 2015 Jun 4; 96(6): 986–991 |
|
|
|
Post by Admin on Jan 15, 2019 18:59:49 GMT
 Modern Ethiopians in the African Genetic Landscape The first PC of the African samples separates sub-Saharan Africans from North Africans, with Ethiopians positioned between them (Figure 1A), whereas the second and third components separate the hunter-gatherers (click speakers and Pygmies) and the East Africans, respectively (Figures 1A and 1B). Both plots separate the Ethiopian samples according to their linguistic origin. This linguistic clustering appears to be more important than geographical structure, especially for the Semitic and Cushitic populations (Figure 1D), and is also supported by the neighbor-joining tree of Figure S2. Remarkably, the Ethiopian clusters, taken together, span half of the space delimited by all the African populations and surround the Maasai from Kenya. To investigate this high diversity further, we performed an African-only PCA (Figure S1A) using five randomly chosen samples from each Ethiopian population, in order to eliminate bias that might arise from including a large number of Ethiopian samples, and a worldwide PCA using the full data set (Figure S1B). Both plots confirmed the high diversity in Ethiopia; Ethiopians spanned most of the African branch in the worldwide PCA (Figure S1A) and showed similar internal structure in both PCA plots (Figures 1B and S1B). 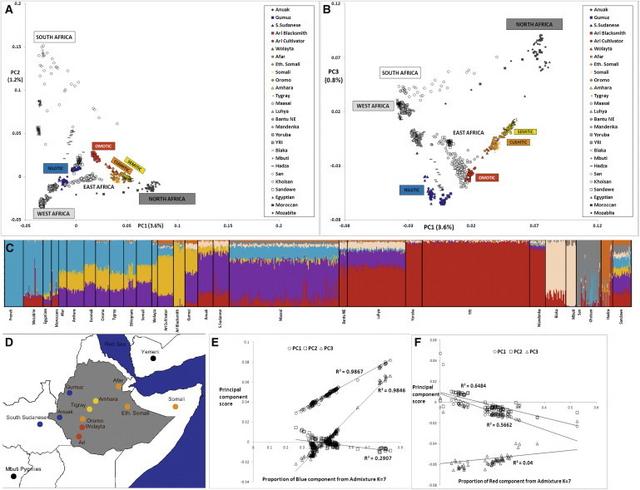 Figure 1 Principal Components and STRUCTURE-like Analyses of the Full African Data Set ADMIXTURE34 was applied to the same African data set, with the addition of the HGDP French27 as a reference group for the non-African component (Figure S1C). The best-supported34 clustering (K = 7, Figure 1C) divided the Ethiopians into two main groups: the Semitic-Cushitic Ethiopians stand out as a relatively uniform set of individuals characterized by a strong (40%–50%) non-African component (light blue in Figure 1C) and an African component split between a broad East African (purple in Figure 1C) and an apparently Ethiopia-specific component (yellow); the Nilotic and Omotic Ethiopians show little or no non-African component and are instead characterized by eastern (purple and yellow) or western (dark red) African components, with some traces of additional components. The yellow and purple components represent the major proportion of the African component in the Egyptian Afro-Asiatic population, but are less predominant than the red West African component among northwestern African populations who also speak Afro-Asiatic languages. However, it is striking that North Africans share substantially more variation with non-African populations (80%) than do Ethiopians (40%–50%).  Figure 2 Pairwise FST and SNP Heterozygosity in a Set of Worldwide Populations To investigate the role played by the non-African component in the PCA clustering of the Semitic and Cushitic samples, we looked for correlations between the former (obtained from ADMIXTURE, K = 7) and the first three PCs. As shown in Figure 1E, both PC1 and PC3 strongly correlate (both r2 values are above 0.98) with the blue component of Figure 1C, whereas PC2 shows a weaker correlation (r2 = 0.29). The strong PC1 and PC3 correlations therefore seem to indicate that the proportion of non-African admixture is the main driver of the Ari-Egyptian cline formed by the Semitic-Cushitic samples in the PCA plot, regardless of their population of origin. However, when looking for correlations between the Nigerian-Congolese component (blue in Figure 1C) and the first three PCs in the Nilotic populations, we found a much weaker correlation (Figure 1F) than observed for the Semitic-Cushitic component. The Ari-Yoruba cline observed for the Nilotic samples cannot therefore be explained as a simple admixture event between Ethiopians and Nigerian-Congolese populations. To compare the level of genetic variation in the populations investigated, we estimated average SNP heterozygosity in the pruned genomes of ten individuals from each population and the pairwise FST between African and worldwide populations (Figure 2 and Table S2). The Semitic-Cushitic and North African populations showed the highest values of heterozygosity worldwide, which may reflect a combination of SNP ascertainment bias and the mixture of African and non-African components in these populations. The observed pattern of uniform decline of FST values away from North, West, or East Africa is consistent with previous interpretations of a single exit, followed by “isolation by distance.”6,40,41 |
|
|
|
Post by Admin on Jan 15, 2019 21:10:42 GMT
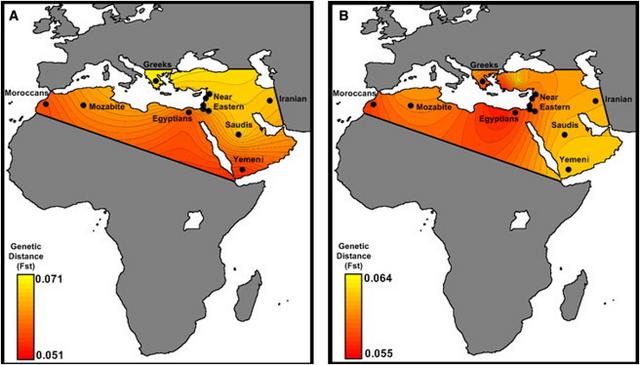 Figure 3 Pairwise FST between Semitic-Cushitic Ethiopians and Surrounding Populations We considered two sources (western and eastern) for the African component of the Ethiopian genomes. The distinction between the East and West African components is supported by the PCA, wherein our samples formed a triangle (Figure S4) with the three corners represented by West Africans (YRI), non-Africans (CEU), and East Africans (Ari Cultivators and Blacksmiths). The other populations were distributed along the three sides of the triangle in a way that could imply different patterns of admixture. We applied ROLLOFF to estimate admixture dates for the Ethiopian populations, considered as a combination of West Africans with non-Africans or East Africans with non-Africans, depending on their position in the PC plot (Figure S4). The dates of admixture (assuming 30 years per generation)42 are reported in Table 1. Notably, in most of the Semitic, Cushitic, and Omotic populations, the admixture of African and non-African ancestry components dates to 2.5–3 kya, whereas in North Africa, the admixture dates are ∼2 ky more recent, clustering around 1 kya, consistent with previous reports.43 The consistency between the Ethiopian estimates and the appearance in the area of a linguistic family (Ethio-Semitic) with a West Asian origin23 support the hypothesis of a recent gene flow from the Levant. Although ROLLOFF estimated a date for an admixture event involving the Nilotic populations, examination of the relationship between the correlation coefficient and genetic distance (Figure 4) revealed no exponential decay for these populations, implying less support for an admixed origin of the Nilotic populations than of the Semitic, Cushitic, and Omotic populations. Source of the Major Out-of-Africa Migration Consistent with previous studies' reports of a steady decline in genetic similarity among non-African populations as a function of geographical traveling distance from East Africa, we found that the FST values estimated between either Ethiopian or North African populations and non-African populations followed the same pattern (Figure 2, Table S2). This steady decline has been argued27 to be compatible with a single exit followed by isolation-by-distance, rather than with two distinct African sources contributing to the non-African diversity. Neither including nor excluding the Ethiopian data altered the pattern. To follow the thread left by this dispersal in more detail, we used the genome partitioning performed earlier to calculate the minimum pairwise difference between the African component of the Egyptian and Ethiopian populations and the equivalent genomic segment in non-Africans. The partitioning would remove noise, caused by recent backflows into Africa, which might otherwise mask the original out-of-Africa signal. If the mouth of the Red Sea had been a major migration route out of Africa, we might observe a closer affinity of Ethiopians, rather than Egyptians, with non-Africans. 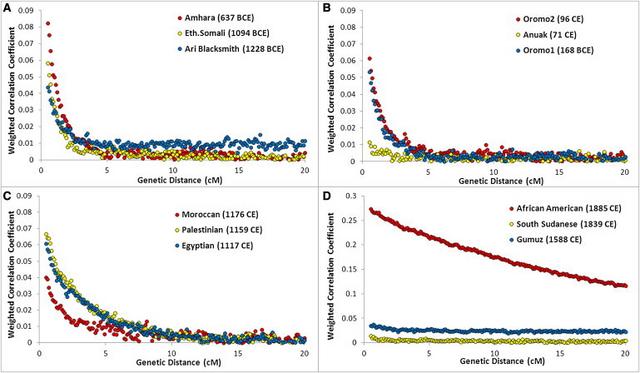 Figure 4 ROLLOFF Plots Three populations from each of the four historical periods of admixture (A: <500 BCE, B: ∼0 CE, C: ∼1000 CE, and D: >1500 CE) are plotted to show their LD decay (represented by a weighted correlation coefficient as previously described39) with genetic distance. The legend reports the name of each population, with the estimated date of admixture in brackets. Notably, all three Nilotic populations (Gumuz, South Sudanese, and Anuak) have very flat decay curves compared to those of the other populations in the same plot. As a proof of principle, we first applied the approach to a genetic system with a well-understood phylogeographic structure: mtDNA. Virtually all indigenous sub-Saharan African mtDNA lineages belong to L haplogroups, whereas the presence of haplogroups M and N in North and East Africa has been interpreted as a signal of gene flow back to Africa.48,49 With the full set of 18 mtDNA SNPs used in our genome-wide data set, Egyptians and Moroccans proved to be the closest African population to any non-African population examined (Table 2A). However, when we first partitioned the mtDNA lineages into African and non-African (i.e., L and non-L) and considered only the L component, a different pattern emerged: Ethiopians were the closest population to the non-Africans (Table 2B), consistent with inferences drawn from more detailed mtDNA analyses. 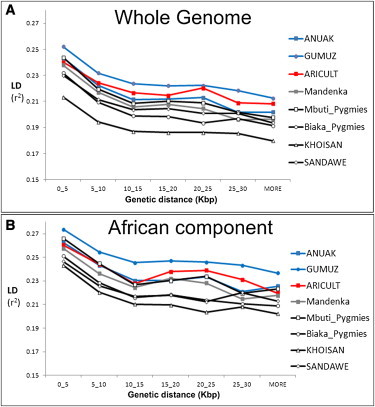 Figure 5 LD Decay over Distance Relative Ages of the Ethiopian and Other African Populations The decay of LD with time provides a robust proxy for the “age” of a population of a constant size: that is, the length of time that the ancestors of the sampled individuals have been evolving as part of the same breeding unit. To assess how relatively “old” the patterns of LD are in Ethiopian populations, we compared the LD at different distances between the Ethiopian populations and a range of other African populations (Figure 5).28 We also performed the same analyses on the African components of each population to reduce the bias introduced by the recent genetic back-flow (Figure 5B). In both cases, the Ethiopians displayed less LD decay than did the click speakers, Pygmies, or Nigerian-Congolese groups, suggesting a younger age, a smaller long-term effective population size, or a combination of these. ADMIXTURE analyses revealed a major (40%–50%) contribution to the Ethiopian Semitic-Cushitic genomes that is similar to that of non-African populations. Our estimates of genetic similarity between this component and extant non-African populations suggest that the source was more likely the Levant than the Arabian Peninsula. We estimate that this admixture event took place approximately 3 kya. The more recent admixture dates for the Oromo and Afar can be explained by the effect of a subsequent Islamic expansion that particularly impacted these groups, as well as the North Africans.52 Levant people may have arrived in Ethiopia via land or sea subsequently, leaving a similar signature also in modern Egyptians, or the similarity between Ethiopians and Egyptians may be a consequence of independent genetic relationships. This putative migration from the Levant to Ethiopia, which is also supported by linguistic evidence, may have carried the derived western Eurasian allele of SLC24A5, which is associated with light skin pigmentation. Although potentially disadvantageous due to the high intensity of UV radiation in the area, the SLC24A5 allele has maintained a substantial frequency in the Semitic-Cushitic populations, perhaps driven by social factors including sexual selection. The “African” component of the Ethiopian genomes may also result in part from recent migrations into Ethiopia from other parts of Africa, a possibility that we have not examined here. The estimated time (3 kya) and the geographic origin (the Levant) of the gene flow into Ethiopia are consistent with both the model of Early Bronze Age origins of Semitic languages and the reported age estimate (2.8 kya) of the Ethio-Semitic language group.23 They are also consistent with the legend of Makeda, the Queen of Sheba. According to the version recorded in the Ethiopian Kebra Nagast (a traditional Ethiopian book on the origins of the kings), this influential Ethiopian queen (who, according to Hansberry,53 reigned between 1005 and 955 BCE) visited King Solomon—ruler, in biblical tradition, of the United Kingdom of Israel and Judah—bringing back, in addition to important trading links, a son. The ancient kingdom of Axum adopted Christianity as early as the fourth century. Historical contacts established between Ethiopia and the Middle East were maintained across the centuries, with the Ethiopian church in regular contact with Alexandria, Egypt. These long-lasting links between the two regions are reflected in influences still apparent in the modern Ethiopian cultural and, as we show here, genetic landscapes. An abundance of evidence suggests that all modern non-Africans descend predominantly from a single African source via a dispersal event some 50 to 70 kya.6,7,27,49 However, debate continues about whether the principal migratory route out of Africa was north of the Red Sea to the Levant, or across its mouth to the Arabian Peninsula. The actual source of the migrations within Africa is a different question, but we assume that the migrators would have left genetic signatures in Egypt if they took the northern route or in Ethiopia if they took the southern route. We chose reference non-African populations along the two putative routes. However, both the northern and eastern Africans have genetic distances (FST) that gradually increase with geographic distance along both routes. This also holds true when Ethiopian populations that show little evidence of recent non-African gene flow (Omotic and Nilotic) are used as a source. A minimum-pairwise-distance measure based on the African component of the genome found that the Ethiopian mtDNA component was closer to non-African populations than was the Egyptian mtDNA component, as previously reported,50 but that the autosomal genome of non-Africans was closer to the African component of the Egyptian rather than Ethiopian populations. This could be interpreted as supporting a northern exit route. However, the 80% non-African proportion of the Egyptian genome (Figure 1C) reduces the power of our comparisons and, taken together with the requirement for the African state in at least ten chromosomes, means that this conclusion is based on just ∼1,800 SNPs (compared to 18,960 for the Ethiopians, 30,798 for the Mozabite, and 5,920 for the Moroccans). Therefore, the question requires further investigation beyond the scope of the present study. Am J Hum Genet. 2012 Jul 13; 91(1): 83–96. |
|
|
|
Post by Admin on Jan 18, 2019 23:14:37 GMT
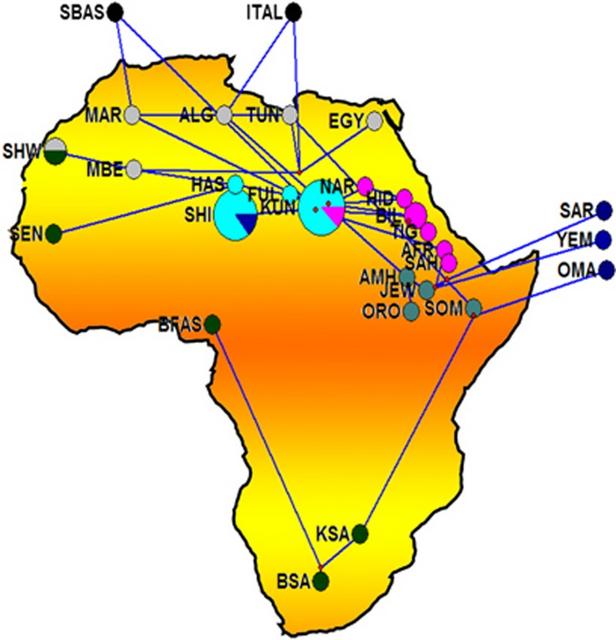 Figure 1 Median-joining (MJ) network. Network manipulated to fit the geography of the extant populations. MJ network was constructed using E haplogroup frequencies. Group represented by ITAL contains all the Italian samples pooled. Populations' descriptions are given in Supplementary Table S1. Median-joining network (Figure 1) was constructed using Network 4.6.1.1. (http://www.fluxus-engineering.com) program.36 Effective mutation rate of 3.8–4.4 × 10⁻⁴ mutations/nucleotide/generation37 was used in estimating the divergence time of the populations using Network program. A neighbor-joining (NJ) tree (Figure 2) was constructed38 and evolutionary analysis was conducted using MEGA5 (Tamura et al39). 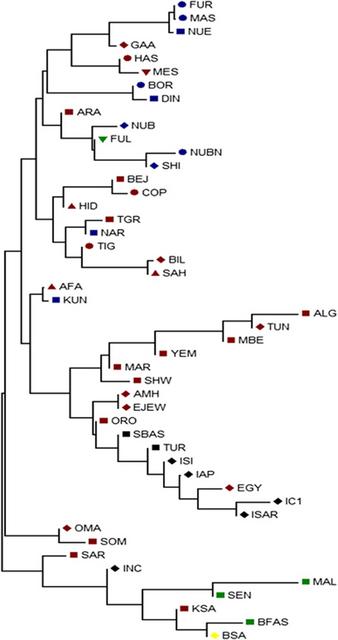 Figure 2 NJ tree based on FST values generated from Arlequin 3.11. Population names are as given in Supplementary Table S1. Population life style: circle – agriculturalists; square – pastoralists; triangle – nomads; inverted triangle – nomadic pastoralists; diamond – agro-pastoralists. The populations are colored according to their language family: red – Afro-asiatic; blue – Nilo-Saharan; green – Niger-Kordofanian; yellow – Khoisan; black – Italic and Basque. Phylogenetic analysis The network analysis on the chromosomes carrying E haplogroups was robust enough with a main cluster near the root represented by Kunama (KUN) encompassing most of Eritreans and Sudanese populations, including Nilo-Saharan and Afro-Asiatic speakers suggesting that linguistic divergence is either a subsequent event to population divergence, language replacement or that the two linguistic families may have shared a common origin. The Southern African populations, which include the Khoisan and Bantu of South Africa populations, are shown to be divergent from the East African larger cluster through its connection to the Somali population. The network also suggests that dispersal of the haplogroup to Southern Africa may reflect the spread of pastoralism from North East Africa.5 The Yemeni, Saudi Arabia and Oman populations on the other hand form a Near Eastern group. The link between the Yemeni and Omani populations with Afar and Saho populations from Eritrea could be attributed to the geographical proximity and possibly past genetic history. The Northern African populations tend to separate into two distinct groups: one containing Moroccan Arabs and Berbers and Saharawi, derived from the larger East African group and the other includes the Northern African populations of Algeria, Egypt and Tunisia, which forms a connection to both Europeans and Eritrean and Ethiopians hinting to recent genetic relationship between North and East African populations as is widely believed.30 The NJ tree, which was not rooted, on the other hand was quite robust in showing similar grouping to that of the network, MDS and PCA plots to imply a correlation with language and relevance to geography. With few exceptions, all populations carrying the haplogroup were either pastoralists or had recorded history of pastoralism. The populations that made exceptions, includes Hausa, Fur and Masalit, have strong agricultural practices, while the latter is thought to have recent history of mixed farming or foraging. The other exceptions are Copts from Egypt and Tigrigna from Eritrea, both with documented history of agricultural practices albeit historically part of larger communities with established pastoralist practices. The Nilo-Saharan speakers and Niger-Kordofanian were confined to the cluster from Sudan and Eritrea. Genetic structure and population differentiation The MDS and the PCA plots (Figure 3 and Supplementary Figure S2, respectively) generated from the E haplogroup frequency data portrayed similar pattern that complement the network result. Generally four main clusters can be identified from the MDS and PCA plots. In the MDS plot, one of the main clusters (grey shaded) constitutes almost all Eastern Africans including most Eritrean and Sudanese populations. The Saho and Afar populations of Eritrea tend to cluster with the Near Eastern or Arabian populations (brown shaded). The West and Southern African populations (blue shaded) form the third cluster, while North African populations forming the fourth cluster (green shaded). Interestingly, populations from Egypt, Tunisia and Ethiopia (Ethiopian Jews) assumed an intermediate position between the East African and Near Eastern clusters. The PCA (Supplementary Figure S2) also gave the same result clustering the majority of East Africans (grey shaded) in the first component and North Africans (brown shaded) separated from Middle East populations (blue shaded) in the second component. The first two components account 83% of the variations observed. 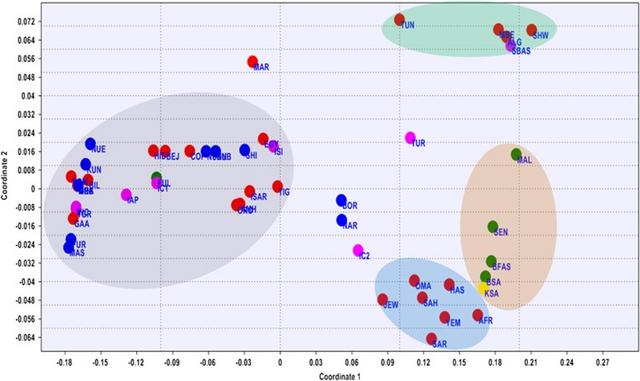 Figure 3 MDS plot based on the FST values generated from Arlequin 3.11 and using Rho similarity measures and with stress value of 0.07101. Populations' descriptions are given in Supplementary Table S1. The network cluster associated with the Eritrean Nilo-Saharan Kunama (Figure 1) may represent an expansion event following the out-of-Africa migration,31, 46 possibly close to the origin of the ancestral Y-chromosome clades.47, 48, 49 The expansion, carrying the diversified E-P2 mutation, may be responsible for the migration of male populations to different parts of the continent and henceforth the rise and spread of the bearers of the macrohaplogroup.50 These type of population movements, or demic expansions, driven by climatic change and/or spread of pastoralism and to some extent agriculture,51, 52, 53, 54 are not uncommon in human history. This scenario is more substantiated by the refining of the E-P2 (Trombetta et al35) and its two basal clades E-M2 and E-M329, which are believed to be prevalent exclusively in Western Africa and Eastern Africa, respectively. Interestingly, this ancestral cluster includes populations like Fulani who has previously shown to display Eastern African ancestry, common history with the Hausa who are the furthest Afro-Asiatic speakers to the west in the Sahel, with a large effective size and complex genetic background.23 The Fulani who currently speak a language classified as Niger-Kordofanian may have lost their original tongue to associated sedentary group similar to other cattle herders in Africa a common tendency among pastoralists. Clearly cultural trends exemplified by populations, like Hausa or Massalit, the latter who have neither strong tradition in agriculture nor animal husbandry, were established subsequent to the initial differentiation of haplogroup E. For example, the early clusters within the network also include Nilo-Saharan speakers like Kunama of Eritrea and Nilotic of Sudan who are ardent nomadic pastoralists but speak a language of non-Afro-Asiatic background the predominant linguistic family within the macrohaplogroup. The subclades of the network some of which are associated with the practice of pastoralism are most likely to have taken place in the Sahara, among an early population that spoke ancestral language common to both Nilo-Saharan and Afro-Asiatic speakers, although it is yet to be determined whether pastoralism was an original culture to Nilo-Saharan speakers, a cultural acquisition or vice versa; and an interesting notion to entertain in the light of the proposition that pastoralism may be quite an antiquated event in human history.17 Pushing the dates of the event associated with the origin and spread of pastoralism to a proposed 12 000–22 000 YBP, as suggested by the network dating, will solve the matter spontaneously as the language differences would not have appeared by then and an original pastoralist ancestral group with a common culture and language50 is a plausible scenario to entertain. Such dates will accommodate both the Semitic/pastoralism-associated expansion and the introduction of Bos taurus to Europe from North East Africa or Middle East.55 The network result put North African populations like the Saharawi, Morocco Berbers and Arabs in a separate cluster. Given the proposed origin of Maghreb ancestors56, 57, 58, 59 in North Africa, our network dating suggested a divergence of North Western African populations from Eastern African as early as 32 000 YBP, which is close to the estimated dates to the origin of E-P2 macrohaplogroup.30, 60 It can be further inferred that the high frequency of E-M81 in North Africa and its association to the Berber-speaking populations25, 30, 32, 60, 61 may have occurred after the splitting of that early group, leading to local differentiation and flow of some markers as far as Southern Europe.30, 60, 62  A branching in the network may once again represent an episode of human migration that carried the haplogroup E-M35 and its subhaplogroups farther to the western coast of the Red Sea to Yemen, Oman and Saudi Arabia and concurrently down to Southern Africa as part of a more recent Y chromosome motivated out of Africa migration episode. The PCA and MDS display similar interesting grouping of the Afar and Saho populations of Eritrea with their Near Eastern Arabian populations to conjure up on the genetic relationship of the two sides of the Red Sea. The arrival of the E-M35 and derived subclades, for example, E-M123/E-M34, to Arabia appears to be strongly linked to expansion into East Africa, North Africa, Europe, Southern Africa, an event that is likely related to pastoralism, hastened by its advent and amenable for analysis and dating using approaches similar to what was proposed for the co-migration of Y chromosome and disease traits.63 The presence of archeological10, 11, 12, 13 and agro-pastoral9, 14, 16 evidences from this side of the Red Sea and the history of migration of animals across the Red Sea,64 however, calls for more molecular dissection of common haplogroups shared by these coastal populations. As suggested by others, this may give clues not only to the origin of E-M123, J-M267, K-M70, but also to the origin of Semitic languages.65, 66 Indeed the trail of such historical movements are detectable by molecular signatures of markers like Y chromosome giving insights into episodes of even more regional nature, for example, the high frequency of E-V32 in Eritrea, in concordance to oral history, supports the historical ties between North East Africa (Egypt) and East Africa including Eritrea, Sudan, Ethiopia and Somalia. Eur J Hum Genet. 2014 Dec; 22(12): 1387–1392. |
|
|
|
Post by Admin on Mar 11, 2019 18:23:07 GMT
 Figure 1 Africa harbors more genetic diversity than any other part of the world (Cann et al., 1987, Tishkoff et al., 2009). This is reflected both in a higher average number of differences among sub-Saharan African genomes than among non-African genomes (Cann et al., 1987, Ramachandran et al., 2005) and in the fact that the ancestry found outside of Africa is largely a subset of that within it (Tishkoff et al., 2009). Today, some of the earliest-branching African lineages are present only in populations with relatively small census sizes, including the southern African Khoe-San (see STAR Methods for terminology), central African rainforest hunter-gatherers, and Hadza of Tanzania (Gronau et al., 2011, Schlebusch et al., 2012, Veeramah et al., 2012). However, the population structure of Africa prior to the expansion of food producers (pastoralists and agriculturalists) remains unknown (Busby et al., 2016, Gurdasani et al., 2015, Patin et al., 2017). Bantu-speaking agriculturalists originating in western Africa are thought to have brought farming to eastern Africa by ∼2,000 years BP (years before present, defined by convention as years before 1950 CE) and to southern Africa by ∼1,500 BP, thereby spreading the largest single ancestry component to African genomes today (Russell et al., 2014, Tishkoff et al., 2009). Earlier migration(s), which brought ancestry related to the ancient Near East (Lazaridis et al., 2016, Pagani et al., 2012, Pickrell et al., 2014), brought herding to eastern Africa by ∼4,000 BP (Marshall et al., 1984) and to southern Africa by ∼2,000 BP (Sadr, 2015).  Figure S1 Archaeological Context and Dating of Newly Reported Human Remains from Malawi, Related to Figure 1 Results To reconstruct African population structure prior to the spread of food production, we generated new genome-wide data from 15 ancient sub-Saharan Africans (Table 1; Tables S1 and S2; STAR Methods). For three individuals from the western Cape of South Africa (∼2,300–1,300 BP), we carried out direct shotgun sequencing to 0.7- to 2.0-fold coverage. For 12 individuals from eastern and south-central Africa, we used in-solution enrichment of ∼1.2 million single nucleotide polymorphisms (SNPs). These included four individuals from the coastal region of Kenya and Tanzania (∼1,400–400 BP), one from interior Tanzania (∼3,100 BP), and seven from Malawi (ranging over ∼8,100–2,500 BP) (Figure S1). All individuals had postmortem degradation characteristic of ancient DNA (Table 1), and we confirmed that key results are unlikely to be artifacts of contamination by restricting analysis to sequences with postmortem degradation (Skoglund et al., 2012, Skoglund et al., 2014a) (Figure S2). We merged the new ancient DNA data with previously reported shotgun sequence data from a ∼4,500 BP Ethiopian highland individual (Llorente et al., 2015) and with SNP genotypes from 584 present-day African individuals from 59 diverse populations (including new data from 34 Malawi individuals; STAR Methods) (Lazaridis et al., 2014, Patterson et al., 2012), as well as 300 high-coverage genomes from 142 worldwide populations (Mallick et al., 2016). We also determined mitochondrial DNA and Y chromosome haplogroups for all newly reported samples (Tables S3 and S4).  Figure S2 Ancient Individuals and African Population Structure, Related to Figure 1 We used principal component analysis (PCA) (Patterson et al., 2006) and automated clustering (Alexander et al., 2009) to relate the 16 ancient individuals to present-day sub-Saharan Africans (Figures 1 and S3). Whereas the two individuals buried in ∼2,000 BP hunter-gatherer contexts in South Africa share ancestry with southern African Khoe-San populations in the PCA, 11 of the 12 ancient individuals who lived in eastern and south-central Africa between ∼8,100 and ∼400 BP form a gradient of relatedness to the eastern African Hadza on the one hand and southern African Khoe-San on the other (Figure 1A). The genetic cline correlates to geography, running along a north-south axis with ancient individuals from Ethiopia (∼4,500 BP), Kenya (∼400 BP), Tanzania (both ∼1,400 BP), and Malawi (∼8,100–2,500 BP), showing increasing affinity to southern Africans (both ancient individuals and present-day Khoe-San). The seven individuals from Malawi show no clear heterogeneity, indicating a long-standing and distinctive population in ancient Malawi that persisted for at least ∼5,000 years (the minimum span of our radiocarbon dates) but which no longer exists today. |
|

