|
|
Post by Admin on Aug 29, 2019 18:15:37 GMT
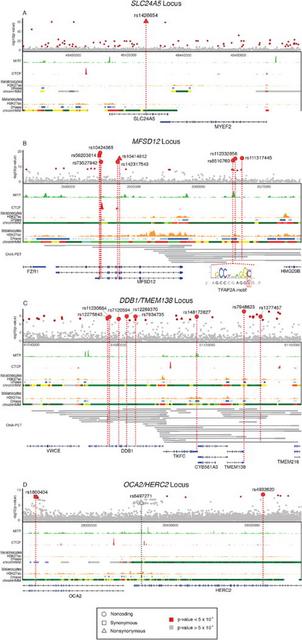 Fig. 3 Genomic context of GWAS loci The SNPs with strongest association with skin color in Africans were on chromosome 15 at or near the Solute Carrier Family 24 Member 5 (SLC24A5)gene (Figs. 1). A functional non-synonymous mutation within SLC24A5 (rsl426654) (14) was significantly associated with skin color (F-test, p-value = 5.5 × 10−62) and was identified as potentially causal by CAVIAR (Table 1). The rsl426654 (A) allele is at high frequency in European, Pakistani, and Indian populations (Fig. 1) and is a target of selection in Europeans, Central Asians and North Indians (15-17). In Africa this variant is common (28-50% frequency) in populations from Ethiopia and Tanzania with high Afroasiatic ancestry (18, 19) and is at moderate frequency (5-11%) in San and Bantu populations from Botswana with low levels of East African ancestry and recent European admixture (20, 21) (Fig. 1 and figs. S2 and S4). We observe a signature consistent with positive selection at SLC24A5 in Europeans on the basis of extreme values of Tajima’s D statistic (fig. S5). Based on coalescent analysis with sequence data from the Simons Genomic Diversity Project (SGDP) (13), the time to most recent common ancestor (TMRCA) of most Eurasian lineages containing the rsl426654 (A) allele is 29 kya (95% credible interval (CI) 28-31 kya), consistent with prior studies (6, 16) (Fig. 4). Haplotype analysis indicates that the rsl426654 (A) variant in Africans is on the same extended haplotype background as Europeans (Fig. 5 and fig. S6), likely reflecting gene flow from western Eurasia over at least the past 3-9 ky (22). The rsl426654 (A) variant is at high frequency (28%) in Tanzanian populations, suggesting a lower bound (~5 kya) for introduction of this allele into East Africa, the time of earliest migration from Ethiopia into Tanzania (23). Further, the frequency of the rsl426654 (A) variant in eastern and southern Africans exceeds the inferred proportion of non-African ancestry (figs. S2 and S4). Estimates of genetic differentiation (FST) at the rsl426654 SNP between the West African Yoruba (YRI) and Ethiopian Amhara populations is 0.76, among the top 0.01% of values on chromosome 15 (table S4). These results are consistent with selection for the rsl426654 (A) allele in African populations following introduction, although complex models of demographic history cannot be ruled out. 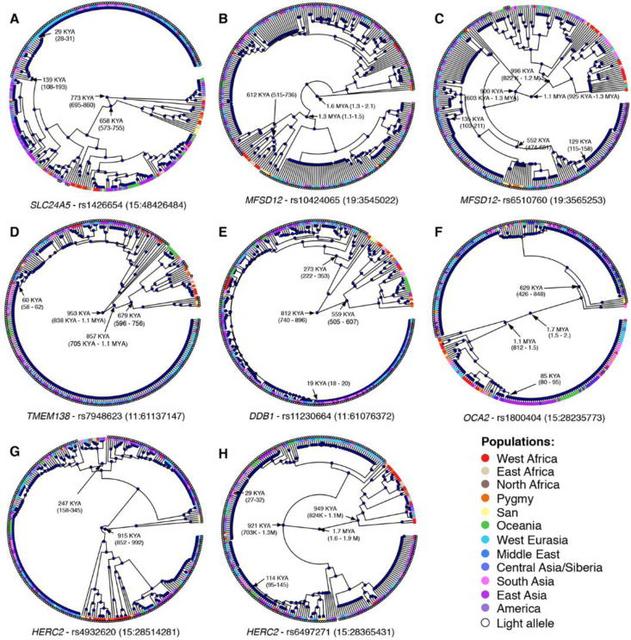 Fig. 4 Coalescent Trees and TMRCA dating A lysosomal transporter protein associated with skin pigmentation The region with the second strongest genetic association with skin pigmentation contains the Major Facilitator Superfamily Domain Containing 12 (MFSD12) gene on chromosome 19 (Figs. 1 and and33 and tables S2 and S3). MFSD12 is homologous to other genes containing MFS domains, conserved throughout vertebrates, which function as transmembrane solute transporters (24). MFSD12 mRNA levels are low in de-pigmented skin of vitiligo patients (25), likely due to autoimmune related destruction of melanocytes. The MFSD12 locus is in a region with extensive recombination, enabling us to fine-map eight potentially causal SNPs (Table 1 and table S3) that cluster in two regions: one within MFSD12 and the other ~7,600–9,000 bp upstream of MFSD12 (Fig. 3). Many SNPs are in predicted regulatory regions active in melanocytes and/or keratinocytes (Table 1 and Fig. 3) and show enhancer activity in luciferase expression assays in a WM88 melanoma cell line (Table 1, table S5, and fig. S7). Within MFSD12, the two SNPs that CAVIAR identifies as having highest probability of being causal are rs56203814 (F-test, p-value = 3.6 × 10⁻¹⁸), a synonymous variant within exon 9, and rsl0424065 (F-test, p-value = 5.1 × 10⁻²⁰), located within intron 8. They are 130 bp apart, in strong LD, and impact gene expression in luciferase expression assays (1.5 – 2.7 × higher expression than the minimal promoter; fig. S7). The SNPs upstream of MFSD12 with highest probability of being causal are rsll2332856 (F-test, p-value = 3.8 × 10⁻¹⁶) and rs6510760 (F-test, p-value = 6.5 × 10⁻¹⁵). They are 346 bp apart, in strong LD, and impact gene expression in luciferase expression assays (4.0 - 19.7 × higher expression than the minimal promoter; fig. S7). The derived rs56203814 and rsl0424065 (T) alleles associated with dark pigmentation are present only in African populations (or those of recent African descent) and are most common in East African populations with Nilo-Saharan ancestry (Fig. 1 and fig. S4). Coalescent analysis of the SGDP dataset indicates that the rsl0424065 (T) allele predates the 300 kya origin of modern humans (26) (estimated TMRCA of 612 kya, 95% CI 515-736 kya) (Fig. 4). At rs6510760 and rsll2332856, the ancestral (G) and (T) alleles, respectively, associated with light pigmentation, are nearly fixed in Europeans and East Asians and are common in San as well as Ethiopian and Tanzanian populations with Afroasiatic ancestry (Fig. 1 and fig. S4). The derived rs6510760 (A) and rs112332856 (C) alleles (associated with dark pigmentation) are common in all sub-Saharan Africans except the San, as well as in South Asian and Australo-Melanesian populations (Fig. 1 and fig. S4). Haplotype analysis places the rs6510760 (A) allele (and linked rsll2332856 (C) allele) in Australo-Melanesians on similar haplotype backgrounds relative to central and eastern Africans (Fig. 5 and fig. S6), suggesting they are identical by descent from an ancestral African population. Coalescent analysis of the SGDP dataset indicates that the TMRCA for the derived rs6510760 (A) allele is 996 kya (95% CI 0.82-1.2 mya; Fig. 4). |
|
|
|
Post by Admin on Aug 30, 2019 17:54:21 GMT
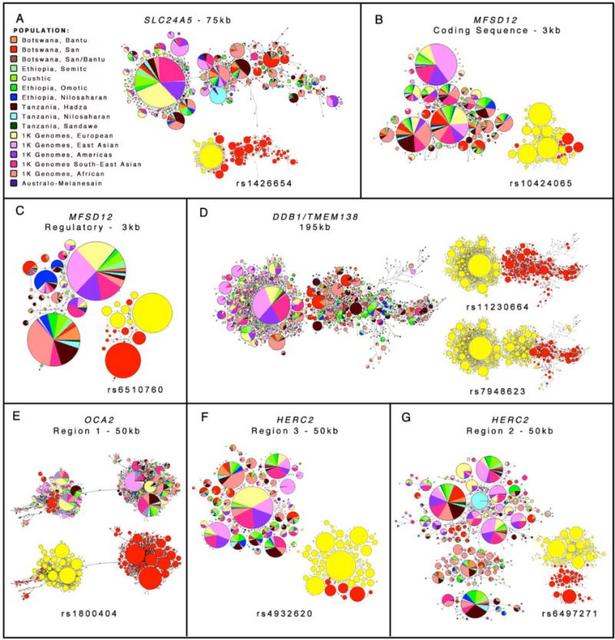 Fig. 5 Haplotype networks at SLC24A5, MFSD12, DDB1/TMEM138, and OCA2/HERC2 We do not detect evidence for positive selection at MFSD12 using Tajima’s D and iHS statistics [figs. S5 and S8, as expected if selection were ancient (27)]. However, levels of genetic differentiation are elevated when comparing East African Nilo-Saharan and western European (CEU) populations (e.g., FST=0.85 for rsll2332856, top 0.05% on chromosome 19), consistent with differential selection at this locus (28) (table S4). MFSD12 is within a cluster of 10 genes with high expression levels in primary human melanocytes relative to primary human keratinocytes (29), with MFSD12 the most differentially expressed (90X; table S6). The genomic region (chr19:3541782-3581062) encompassing MFSD12 and neighboring gene HMG20B (a transcription factor common in melanocytes) has numerous DNase I hypersensitive sites and is enriched for H3K27ac enhancer marks in melanocytes (top 0.1% genome-wide; Fig. 3), suggesting this region may regulate expression of genes critical to melanocyte function (30). Analyses of gene expression using RNA-sequencing data from 106 primary melanocyte cultures (table S7), indicates that African ancestry is significantly correlated with decreased MFSD12 gene expression (Pearson Correlation Coefficient (PCC) p-value = 5.0 × 10⁻²; fig. S9). We observed significant associations between genotypes at rs6510760 and rsll2332856 with expression of HMG20B (Bonferroni adjusted p-value (Padj) < 4.9 × 10⁻³) and MFSD12(Padj < 3.4 × 10⁻²) (fig. S9). In each case, the alleles associated with dark pigmentation correlate with decreased gene expression. Allele-specific expression (ASE) analysis indicates that individuals heterozygous for either rs6510760 or rsll2332856 show increased allelic imbalance, relative to homozygotes, for MFSD12 (Mann-Whitney-Wilcoxon (MWW) test, p-value = 4.9 × 10⁻³ and 1.3 × 10⁻², respectively), consistent with regulation of gene expression in cis. A haplotype containing the rs6510760(A)/rsll2332856(C) variants associated with dark pigmentation showed 4.9 times lower expression in luciferase assays than the haplotype containing rs6510760(G)/rs112332856(T) variants associated with light pigmentation [Kruskal-Wallis Rank Sum (KWRS) Test, p- value=7.7 × 10⁻⁷;fig. S7 and table S5]. We did not have power to detect an association between expression of MFSD12 and rs56203814 or rsl0424065 due to low frequency (~2%) of the alleles associated with dark pigmentation in the primary melanocyte cultures. Identification of variation at OCA2 and HERC2 impacting skin pigmentation Another region of significantly associated SNPs encompasses the OCA2 and HERC2 loci on chromosome 15 (Fig. 3 and table S3). HERC2 was identified in GWAS for eye, hair, and skin pigmentation traits (6, 7, 50-52). The oculocutaneous albinism II gene (OCA2, formerly called the P gene) encodes a 12- transmembrane domain-containing chloride transporter protein and affects pigmentation by modulating melanosomal pH (53). The most common types of albinism in Africans are caused by mutations in OCA2(54). Due to extensive LD in the OCA2 and HERC2 region, CAVIAR predicted 10 potentially causal SNPs (Table 1) that cluster within three regions. We order these clusters on the basis of physical distance; region 1 is located within OCA2, and regions 2 and 3 are located within introns of HERC2 (Fig. 3). The SNP with highest probability of being causal from CAVIAR analysis is rs1800404 (F-test, p-value = 1.0), a synonymous variant located in region 1 within exon 10 of OCA2 (Fig. 3, Table 1, and table S3). The ancestral rs1800404 (C) allele, associated with dark pigmentation, is common in most Africans as well as southern/eastern Asians and Australo-Melanesians, whereas the derived (T) allele, associated with light pigmentation, is most common (frequency >70%) in Europeans and San. Haplotype (Fig. 5) and coalescent analyses (Fig. 4) show two divergent clades, one enriched for the rs1800404 (C) allele and the other for the rs1800404 (T) allele. Coalescent analysis indicates that the TMRCA of all lineages is 1.7 mya (95% CI: 1.52.0 mya) and the TMRCA of lineages containing the derived (T) allele is 629 kya (95% CI 426-848 kya) (Fig. 4). The deep coalescence of lineages, and the positive Tajima’s values in this region in both African and non-African populations (fig. S5), is consistent with balancing selection acting at this locus. The SNP with highest probability of being causal in region 3 is rs4932620 (F-test, p-value = 3.2 × 10⁻⁹) located within intron 11 of HERC2. This SNP is 917 bp from rs916977, a SNP associated with blue-eye color in Europeans (55, 56), and is in strong LD (r2 = 1.0 in most East African populations) with SNPs extending into region 2 of HERC2 (Table 1). The derived rs4932620 (T) allele associated with dark skin pigmentation is most common in Ethiopian populations with high levels of Nilo-Saharan ancestry and is at moderate frequency in other Ethiopian, Hadza, and Tanzania Nilo-Saharan populations. Haplotype analysis indicates that the rs4932620 (T) allele in South Asians and Australo-Melanesians is on the same or similar haplotype background as in Africans (Fig. 5 and fig. S6), suggesting it is identical by descent. The TMRCA of haplotypes containing the rs4932620 (T) allele is 247 kya (95% CI: 158-345 kya) (Fig. 4). We also observe an LD block of SNPs within HERC2 that are associated with skin pigmentation independently of the SNPs described above, though they do not reach genome-wide significance (table S3). These are in a region with enhancer activity in Europeans (50). For example, SNP rs6497271 (F-test, p-value = 1.8 × 10⁻⁶), which is located 437 bp from SNP rs12913832, has been associated with skin color in Europeans (50) and is in a consensus SOX2 motif (a transcription factor which modulates levels of MITF in melanocytes) (57) (Fig. 3). The ancestral rs6497271 (A) allele associated with dark pigmentation is on haplotypes in South Asians and Australo-Melanesians similar or identical to those in Africans (Fig. 5 and fig. S6), suggesting they are identical by descent. The derived (G) allele associated with light skin pigmentation is most common in Europeans and San and dates to 921 kya (CI: 700 kya-1.3 mya). SNPs associated with pigmentation at all three regions show high allelic differentiation when comparing East African Nilo-Saharans and CEU (FST = 0.72 - 0.85, top 0.5% on chromosome 15) (table S4). Analyses of RNA-Seq data from 106 primary melanocyte cultures indicates that African ancestry is significantly correlated with increased OCA2 ;gene expression (PCC, Padj= 6.1 × 10⁻⁷) (fig. S9). A permutation approach identified significant associations between OCA2 expression and SNPs within an LD block tagged by rs4932620 extending across regions 2 and 3 (Padj = 2.2 × 10⁻²). Alleles in this LD block associated with dark pigmentation correlate with increased OCA2 expression. We did not observe associations between the candidate causal variants in region 1 and OCA2 expression despite a high minor allele frequency (34%). However, we observe a significant association between a haplotype tagged by rs1800404 and alternative splicing resulting in inclusion/exclusion of exon 10. Exon 10 encodes the amino acids encompassing the third transmembrane domain of OCA2 and is the location of several albinism-associated OCA2 mutations, raising the possibility that the shorter transcript encodes a non-functional channel. Comparing splice junction usage across individuals, we estimate that each additional copy of the light rs1800404 (T) allele reduces inclusion of exon 10 by ~20% (95% CI 17.9-21.5%; fig. S9). Homozygotes for the light rsl800404 (T) allele are, therefore, expected to produce ~60% functional OCA2 protein (compared to individuals with albinism who produce no functional OCA2 protein). Evolution of skin pigmentation in modern humans Skin pigmentation is highly variable within Africa. Populations such as the San from southern Africa are almost as lightly pigmented as Asians (1), while the East African Nilo-Saharan populations are the most darkly pigmented in the world (Fig. 1). Most alleles associated with light and dark pigmentation in our dataset are estimated to have originated prior to the origin of modern humans ~300 ky ago (26). In contrast to the lack of variation at MC1R, which is under purifying selection in Africa (61), our results indicate that both light and dark alleles at MFSD12, DDB1, OCA2, an HERC2 have been segregating in the hominin lineage for hundreds of thousands of years (Fig. 4). Further, the ancestral allele is associated with light pigmentation in approximately half of the predicted causal SNPs; Neanderthal and Denisovan genome sequences, which diverged from modern human sequences 804 kya (62), contain the ancestral allele at all loci. These observations are consistent with the hypothesis that darker pigmentation is a derived trait that originated in the genus Homo within the past ~2 million years after human ancestors lost most of their protective body hair, though these ancestral hominins may have been moderately, rather than darkly, pigmented (63, 64). Moreover, it appears that both light and dark pigmentation has continued to evolve over hominid history. Individuals from South Asia and Australo-Melanesia share variants associated with dark pigmentation at MFSD12, DDB1/TMEM138, OCA2 an HERC2;that are identical by descent from Africans. This raises the possibility that other phenotypes shared between Africans and some South Asian and Australo-Melanesian populations may also be due to genetic variants identical by descent from African populations rather than convergent evolution (65). This observation is consistent with a proposed southern migration route out of Africa ~80 kya (66). Alternatively, it is possible that light and dark pigmentation alleles segregated in a single African source population (13, 48) and that alleles associated with dark pigmentation were maintained outside of Africa only in the South Asian and Australo-Melanesian populations due to selection. By studying ethnically, genetically, and phenotypically diverse Africans, we identify novel pigmentation loci that are not highly polymorphic in other populations. Interestingly, the loci identified in this study appear to affect multiple phenotypes. For example, DDB1 influences pigmentation (42), cellular response to the mutagenic effect of UVR (39) and female fertility (41). Thus, some of the pigmentation-associated variants identified here may be maintained due to pleiotropic effects on other aspects of human physiology. It is important to note that genetic variants that do not reach genome-wide significance in our study might also impact the pigmentation phenotype. Indeed, the 1000 most strongly associated SNPs exhibit enrichment for genes involved in pigmentation and melanocyte physiology in the mouse phenotype database and in ion transport and pyrimidine metabolism in humans (table S8). Future research in larger numbers of ethnically diverse Africans may reveal additional loci associated with skin pigmentation and will further shed light on the evolutionary history, and adaptive significance, of skin pigmentation in humans. Science. 2017 Nov 17; 358(6365): eaan8433. |
|
|
|
Post by Admin on Mar 20, 2020 19:48:04 GMT
A Genetic Mechanism for Convergent Skin Lightening during Recent Human Evolution Zhaohui Yang, Hua Zhong, Jing Chen, Xiaoming Zhang, Hui Zhang, Xin Luo, Shuhua Xu, Hua Chen Molecular Biology and Evolution, Volume 33, Issue 5, May 2016, Pages 1177–1187, doi.org/10.1093/molbev/msw003Published: 06 January 2016 Abstract Skin lightening among Eurasians is thought to have been a convergence occurring independently in Europe and East Asia as an adaptation to high latitude environments. Among Europeans, several genes responsible for such lightening have been found, but the information available for East Asians is much more limited. Here, a genome-wide comparison between dark-skinned Africans and Austro-Asiatic speaking aborigines and light-skinned northern Han Chinese identified the pigmentation gene OCA2, showing unusually deep allelic divergence between these groups. An amino acid substitution (His615Arg) of OCA2 prevalent in most East Asian populations—but absent in Africans and Europeans—was significantly associated with skin lightening among northern Han Chinese. Further transgenic and targeted gene modification analyses of zebrafish and mouse both exhibited the phenotypic effect of the OCA2 variant manifesting decreased melanin production. These results indicate that OCA2 plays an important role in the convergent skin lightening of East Asians during recent human evolution. Introduction Light skin is thought to be an adaptation gained by modern humans needed to cope with the new environmental and biological factors encountered after exiting Africa about 100,000 years ago (Loomis 1967; Jablonski and Chaplin 2000; Chaplin 2004). Among many environmental factors, ultraviolet (UV) is required for the synthesis of vitamin D, a key nutrient for human bone development (Loomis 1967), and selection on vitamin D synthesis would favor a lighter skin for people living in high latitude regions with relatively weak UV radiation. Previous investigations into the bases of skin lightening among Europeans found a set of pigmentation genes (e.g., SLC24A5 and SLC45A2) responsible for their light skin (Graf et al. 2005; Lamason et al. 2005; Izagirre et al. 2006; Yuasa et al. 2006; Lao et al. 2007; Norton et al. 2007; Sabeti et al. 2007; Soejima and Koda 2007; Han et al. 2008; Beleza et al. 2013; Wilde et al. 2014). The Ala111Thr variant of SLC24A5 proved the most striking, being nearly fixed in Europeans (>95%) due to local Darwinian positive selection, but extremely rare in Africans and East Asians (Lamason et al. 2005). Curiously, while East Asians share similarly light skin, the identified mutations of the pigmentation genes found in Europeans are rare in East Asians; instead, other pigmentation genes (e.g., OCA2, DCT, and ATRN) have been reported under selection in East Asians. For example, the variants of OCA2 (rs1800414 and rs74653330) were shown to be associated with skin melanin content (Edwards et al. 2010; Eaton et al. 2015). The DCT gene harbored a signature of positive selection in Chinese using multiple neutrality tests (Lao et al. 2007; Myles et al. 2007), and many loci in ATRN showed extended blocks in East Asians, an indication of selection (Norton et al. 2007). These data suggest convergent evolution of light skin in both East Asians and Europeans (Lao et al. 2007; Myles et al. 2007; Norton et al. 2007; Edwards et al. 2010). However, no functional analysis has been conducted to reveal the underlying genetic mechanism of how these pigmentation genes affect melanin production in the skin and cause skin lightening in East Asians. Compared with Europeans north of the Mediterranean, East Asian populations living between the equator and North Pole manifest a wider spectrum of skin pigmentation (fig. 1A). Previous studies proposed that in the population tree, the dark-skinned Austro-Asiatic speaking populations (abbreviated as A-A) currently residing in southwestern China and Southeast Asia occupy a more basal clade than the light-skinned northern populations who migrated northward some 25,000–30,000 years ago (supplementary fig. S1, Supplementary Material online) (Su et al. 1999; Shi et al. 2005; Consortium et al. 2009). By extension, the A-A group may represent the skin type of early modern human settlers in eastern Asia. Accordingly, a comparative genomic comparison between light-skinned northern populations (e.g., northern Han Chinese, CHN) and dark-skinned A-A as well as African populations may help identify the pigmentation gene(s) responsible for skin lightening in East Asians. Meanwhile, the phenotypic effect of selected mutations in the pigmentation gene(s) can be modeled in laboratory animals to reveal the genetic mechanism. 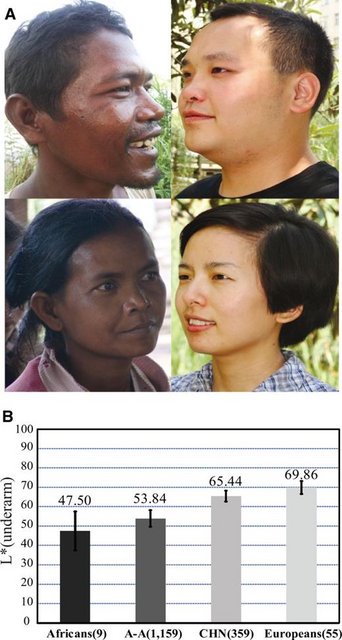 FIG. 1. Skin pigmentation variation in world populations. (A) Skin pigmentation comparison between Austro-Asiatic speakers (left) and northern Han Chinese (right); these individuals represent the middle of skin color values of each population. (B) Comparison of skin darkness among world populations. The y axis indicates the L* value of underarm. The average L* value of each population is shown on the histogram, and the error bar indicates standard deviation. The L* values of Africans (African Americans), Europeans (European Americans) were from a previous report (Shriver and Parra 2000). The data of A-A (Austro-Asiatic speakers) and CHN (northern Han Chinese) were collected in this study. Sample size is indicated in the parenthesis. |
|
|
|
Post by Admin on Mar 21, 2020 5:08:00 GMT
Results Skin Pigmentation in CHN and A-A Populations We measured the level of darkness of the constitutive skin areas (underarm and buttock, unexposed to sunlight) and the facultative skin area (hand back, exposed to sunlight) of 1,518 unrelated individuals from A-A (1,159 individuals from 15 geographic regions) and CHN (359 individuals from 8 northern provinces of China) populations (supplementary table S1, Supplementary Material online). The L* value (a measurement of skin pigmentation reflectance) was used to quantify the level of darkness, that is, lower L* values denote darker skin. A-A populations showed markedly darker skin than the CHN population for both the constitutive and facultative areas (fig. 1 and supplementary fig. S2, Supplementary Material online). After adding published data from African Americans and European Americans (underarm) (Shriver and Parra 2000), there was a clear similarity between A-A and African Americans and also between CHN and European Americans (fig. 1B). Genome-Wide Analysis of Sequence Variations Using an Affymetrix Genome-wide Human Single Nucleotide Polymorphism (SNP) Array 6.0 (>900,000 SNPs), we genotyped 48 individuals randomly selected from A-A populations of southwestern China. Paired with published Affymetrix 6.0 data of other populations (International HapMap et al. 2010), including Han Chinese from Beijing (CHB, 89 individuals), Han Chinese from Denver (CHD, 90 individuals), Japanese (JPT, 90 individuals), Europeans (CEU, 118 individuals), and Africans (YRI, 120 individuals), principal component analysis (PCA) indicated a close relationship among Asian populations (A-A, CHB, CHD, and JPT) (supplementary fig. S3A, Supplementary Material online), with some local divergence (supplementary fig. S3B, Supplementary Material online). To identify the genes responsible for skin pigmentation divergence, we looked for genes showing extraordinarily large divergence between CHN (with CHB used to represent CHN) and A-A and Africans (with YRI used to represent Africans) by calculating between-population allele frequency difference of each SNP (measured by FST) (Weir and Hill 2002). Compared with the randomly selected SNPs, SNPs located in pigmentation genes showed larger enrichment scores (P < 0.001, χ2 test) (supplementary fig. S4, Supplementary Material online), suggesting that pigmentation genes may be under selection in CHB. In total, we identified 1,283 (CHB vs. A-A), 1,640 (CHB vs. YRI), and 1,706 gene regions (YRI vs. A-A) showing large divergences (FST, top 1% regions). Overlapping these gene regions with 171 known pigmentation genes from the human genome (Color Genes database, www.espcr.org/micemut/, last accessed September 03, 2015) yielded three gene-sets (15, 21 and 19 genes, respectively), among which three pigmentation genes (OCA2, EDAR, and PAH) showed consistent signals (supplementary table S2, Supplementary Material online). In the genome-wide FSTanalysis, we pooled the samples of three A-A populations from China, and the potential population substructure may cause false negatives. Consequently, the listed gene sets are conservative callings of genes under selection (supplementary table S2, Supplementary Material online). The identified candidate pigmentation genes are mostly different from those in Europeans, supporting the hypothesized convergent evolution of skin pigmentation in East Asia and Europe. 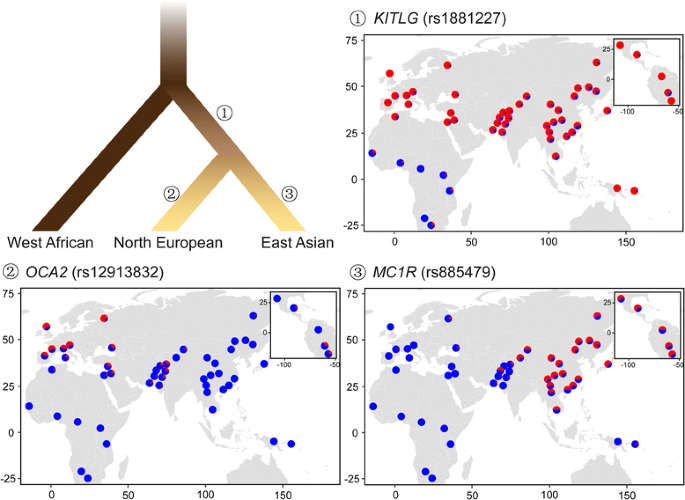 Compared with EDAR and OCA2, the signal of PAH is relatively weak and its functional role in pigmentation remains elusive (Schallreuter et al. 1999). While EDAR has accumulated East Asian specific mutations due to local selection, its functional effect lies in an increased number of active eccrine glands (Kamberov et al. 2013). In contrast, OCA2 showed the largest between-population (light-skinned vs. dark-skinned) divergence and was previously reported to be associated with melanin content (Edwards et al. 2010; Eaton et al. 2015). For further analysis, we focused on OCA2. |
|
|
|
Post by Admin on Mar 21, 2020 20:09:24 GMT
OCA2 Accounts for Light Skin in CHN To search for functional mutation(s) of OCA2, we conducted amplicon sequencing of 40 randomly selected A-A individuals (25 from China and 15 from Cambodia), and obtained sequences of the entire genomic region of OCA2 (344.5 kb) which we compared to data from other populations collected within the 1000 Human Genomes Project (Genomes Project et al. 2012). First, the maps of linkage disequilibrium (LD) (supplementary fig. S5, Supplementary Material online) showed that CHB exhibited the strongest LD, which could be explained either by Darwinian positive selection or population history (e.g., bottleneck effect). Within the gene region of OCA2, we observed a peak of allele frequency divergence (measured by FST) (Weir and Hill 2002) between CHB and A-A, spanning about 44.2 kb, in which rs1800414 was among a group of SNPs showing large FST values (fig. 2A). Further tests via extended haplotype homozygosity (EHH) (Sabeti et al. 2002) and Fay and Wu’s H statistics (Fay and Wu 2000) (the 44.2 kb region was analyzed) supported the signal of selection in CHB (supplementary fig. S6 and table S3, Supplementary Material online), in line with the previous report using other tests of selection (LSBL statistics, InRH, and Tajima’D test) (Edwards et al. 2010). Conversely, no selective signal was observed in A-A and Europeans (supplementary table S3, Supplementary Material online). rs1800414 is a nonsynonymous SNP located in exon 17 of OCA2, and an A to G mutation causes an amino acid change from histidine to arginine (His615Arg). This missense mutation is located in the melanosomal cytoplasmic topological domain (http://www.uniprot.org/, last accessed September 15, 2015). The geographic distribution of this SNP across world populations (data from HGDP database: hgdp.uchicago.edu, last accessed July 10, 2015) showed that the derived G allele of rs1800414 is highly prevalent in most East Asian populations (G allele >50% in Han Chinese), as well as in American Indians, but is in low frequency in A-A populations (G allele = 16.0% [A-A from China]; 21.3% [A-A from Cambodia]), totally absent in Africans, and absent or extremely rare in western Europeans (G allele <0.3%) (fig. 2B). This piece of evidence suggests that rs1800414 is likely an East Asian-specific mutation, consistent with the proposed local selection on this SNP and an independent evolution of skin pigmentation in the area (Edwards et al. 2010).  FIG. 2. Genetic divergence between A-A and CHN and geographic distribution of rs1800414 in world populations. (A) Genetic divergence between A-A and CHN in the sequenced OCA2 gene region (∼344.5 kb) (measured by the averaged FST). The averaged FST of each position is the simple moving average with a sliding window size of 10 kb. The rs1800414 (showing the largest FST value) is labeled. (B) Geographic distribution of rs1800414 derived allele frequencies in world populations. The rs1800414 genotyping data of one CHN population and two A-A populations (Cambodia and China, marked with “red circles”) were from this study. Data of the other populations were from the HGDP database (http://hgdp.uchicago.edu/, last accessed July 10, 2015). Assuming rs1800414 being the functional SNP under selection, we estimated the selective intensity and the time of selection using 1000 Human Genomes Project data (Genomes Project et al. 2012). In CHB, the selective coefficient was estimated to be 0.0157 (95% confidence interval [CI]: 0.0127–0.0186). Assuming a generation time of 25 years, the time of selection onset was estimated at 15,224 years ago (95% CI: 12,818–18,750 years ago), which is slightly older than a recently reported age (10,660 years ago with 95% CI of 8,070–15,780 years ago) using a Hidden Markov model (Chen and Slatking, 2015). The estimated age falls into the Upper Paleolithic, following the proposed northward migration of modern humans in East Asia some 25,000–30,000 years ago (Shi et al. 2005). We conducted skin phenotyping of CHN (359 individuals) to determine whether the OCA2 SNPs affect skin pigmentation. We analyzed five SNPs located in the 44.2 kb region and three SNPs outside this region with strong selective signals. Under the additive genetic model, we detected a significant association of rs1800414 with skin pigmentation for both exposed (P = 5.12 × 10⁻⁴, hand back) and unexposed (P = 5.34 × 10⁻⁶, underarm and P = 1.75 × 10⁻⁸, buttock) areas (association remained significant after Bonferroni correction; fig. 3A), consistent with a previous association analysis of rs1800414 (Edwards et al. 2010; Eaton et al. 2015). No significant association was observed for the other seven SNPs (P > 0.05), except for rs12440942, with a marginal significance for skin on the buttock (P = 0.0395) (supplementary table S4, Supplementary Material online). When conditioning for rs1800414, rs12440942 became nonsignificant (P = 0.632). 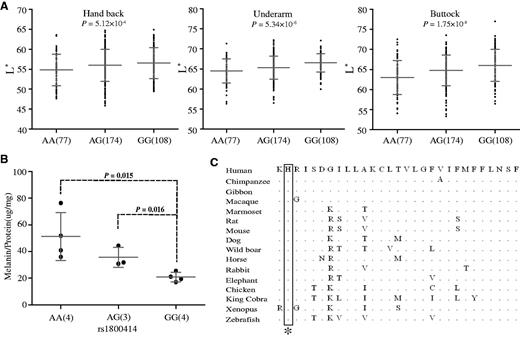 FIG. 3. Genetic association of rs1800414 with skin pigmentation in northern Han Chinese. (A) Measurements of skin darkness (by L* value) of three rs1800414 genotypes. The P values (additive genetic model) are shown in the scatted plots. The y axis represents the L* value; the x axis shows three rs1800414 genotypes with sample sizes in the parentheses. The “error bar” indicates standard deviation. (B) The levels of melanin production in human foreskin melanocytes with different rs1800414 genotypes. Two-tailed t-test was used for statistical evaluation. The y axis represents relative abundance of melanin (Melanin/Protein, μg/mg); the x axis shows the three genotypes with sample size in parentheses. The error bar indicates standard deviation. (C) OCA2 protein sequence (human protein position 614–642) alignment among vertebrate species and rs1800414 (labeled with an asterisk) is highly conserved. The protein sequences were from NCBI (http://www.ncbi.nlm.nih.gov/, last accessed July 10, 2015). Human Skins of Different rs1800414 Genotypes Have Different Melanin Productivity To test whether rs1800414 affects skin pigmentation, we conducted primary cell culture and purification of melanocytes (human foreskin tissue was used) according to published protocols (Cook et al. 2003), and established 11 melanocyte cell lines covering the three genotypes of rs1800414 (4 AA, 3 AG, and 4 GG). We quantified the relative abundance of melanin in each cell line using the total amount of proteins as a control according to published protocols (Cook et al. 2009). As predicted, homozygotes of the derived G allele (Arg615) had the least amount of melanin (correspondent to a relatively lighter skin), whereas the homozygotes of the ancestral A allele (His615) had the highest amount (correspondent to a relatively darker skin), leaving the heterozygotes between the two types of homozygotes (fig. 3B). Surprisingly, the ancestral allele of rs1800414 (His615) is highly conserved among species from zebrafish to human (fig. 3C). The measurement of GERP’s (Genomic Evolutionary Rate Profiling) score suggested a strong functional constraint on this site during evolution (GERP’s score = 366, P = 2.93 × 10−72) (http://mendel.stanford.edu/SidowLab, last accessed October 20, 2015; Cooper et al. 2005), implying that the Arg615 substitution may change OCA2 function. |
|

