Post by Admin on Mar 20, 2021 4:11:20 GMT
Materials and methods
Samples and skin colour phenotyping
We used 1159 individuals from Southern Poland, 347 individuals from Ireland, 119 from Greece, and 329 individuals living in the USA (parental place of birth for many of these individuals is outside the US; these include Nigeria, Mexico, Argentina, Columbia, India, Bangladesh, Cuba, Palestine, Canada, China, Honduras, Germany, Philippines, Russia, Sudan, Japan, Saudi Arabia, Pakistan, El Salvador, Spain, Haiti, South Korea, Vietnam—see online resource information 1). Informed consent was obtained from all individual participants included in the study and was approved by ethical committees of the cooperating institutions. Also included in this study were 71 individuals from the HGDP-CEPH (Rosenberg 2006) set, i.e., from Senegal (n = 21), Nigeria (n = 21), Kenya (n = 11), and Papua New Guinea (n = 17). In total, 2025 individuals were genotyped.
In terms of phenotyping, skin colour classifications followed the Fitzpatrick scale (Fitzpatrick 1988). The scale represents a dermatological assessment to estimate the response of different types of skin to UV light; therefore, it takes into account visual perception of skin colour, as well as tanning ability (Fitzpatrick 1988). It is commonly used by medical practitioners for the classification of a persons skin type, ranging from skin type 1 (pale white skin—no tanning ability), 2 (white skin—minimal tanning ability), 3 (light brown skin—tanning ability), 4 (moderate brown skin—tanning ability), and 5 (dark brown skin—tanning ability) to skin type 6 (deeply pigmented dark brown to black skin)—see online resource information 2. The Polish samples were assessed for their Fitzpatrick skin type by an experienced dermatologist (AB) at sample collection. The Irish, Greek, and US individuals were also assessed by the same dermatologist upon consultation of photographic imagery, and a detailed questionnaire on their ability to tan. Images were taken approximately 20 cm from the forearm of the individual using a Nikon D5300 and R1 ring flash with the following settings: Focus 22, Aperture 1/125, ISO 200. Therefore, all individuals collected were assigned an objective Fitzpatrick scale designation by the same qualified dermatologist avoiding the subjective designations that the volunteers themselves would provide in questionnaire data. For the HGDP-CEPH samples, for which no individual skin colour phenotype information was available, Fitzpatrick scales 6 was assigned as assumed from population knowledge of these African and New Guinean groups, as people living in these geographic regions only have very dark-black skin colour. The 6 Fitzpatrick scales were then re-classified into 5 final skin colour prediction categories for further analyses, i.e., Very Pale (6% of all samples used), Pale (44%), Intermediate (42%), Dark (3%), and Black (5%) by condensing the Fitzpatrick categories 3 and 4 into the Intermediate prediction category and leaving all other categories the same. Categories 3 and 4 of the Fitzpatrick scale are considered very close dermatologically; therefore, it was deemed acceptable to combine these categories for the prediction training of this skin colour model. In a 3-category scale, we grouped Fitzpatrick scale 1–4 Into Light (92%), scale 5 Into Dark (3%), and scale 6 into Dark-Black (5%). Henceforth, the term skin colour category with reference to the categories predicted shall be used for reasons of simplicity in the text; however, it does include not only the visual perception of skin colour but also the ability or lack of to tan. Further information on the Fitzpatrick scale can be found in online resource information 2.
For directly comparing our findings with those from Maroñas et al. (2014), individuals from an independent sample set (n = 194, 17 different populations from Europe, Middle-East, Africa, and Asia) not used in the previous marker ascertainment, model building, or testing, were predicted for skin colour using both models, the one established here, and the one proposed by Maroñas et al. (2014). For this, the same skin colour phenotyping approach as described by Maroñas et al. (2014) was used to make the study outcomes directly comparable. L*ab groups were designated a simple 3-category definition of White, Intermediate, and Black based on groups of L*ab values. The spectrometer values were: L*ab = 74.14–60.36 for White, comprising 132 samples; 59.32–40.04 for Intermediate, comprising 43 samples; 39.75–29.99 for Black, comprising 20 samples.
SNP assessment, genotyping, & statistical analyses
This study examined 2025 individuals for 77 single-nucleotide polymorphisms (SNPs) from 37 genetic loci that were associated with human pigmentation variation, skin colour in particular, in the previous studies (see Table 1 for more details). SNPs were genotyped using SNaPshot (Life Technologies) multiplexes designed and optimized very similar to those described elsewhere (Walsh et al. 2011b, 2013). A subset of 53 SNPs (see Table 1) from 24 genes were selected for further assessment based on their independent contribution (R 2 p value <0.05 uncorrected) towards categorical skin colour prediction, while factoring in sex and population. Finally, the Akaike Information Criterion (AIC) was used for determining optimal SNP selection from the 53 SNPs, which resulted in 36 SNPs from 16 genes (SLC24A5 rs1426654, IRF4 rs12203592, MC1R rs1805007, rs1805008, rs11547464, rs885479, rs228479, rs1805006, rs1110400, rs1126809, rs3212355, OCA2 rs1800414, rs1800407, rs12441727, rs1470608, rs1545397 SLC45A2 rs16891982, rs28777, HERC2 rs1667394, rs2238289, rs1129038, rs12913832, rs6497292, TYR rs1042602, rs1393350, RALY rs6059655, DEF8 rs8051733, PIGU rs2378249, ASIP rs6119471, SLC24A4 rs2402130, rs17128291, rs12896399, TYRP1 rs683, KITLG rs12821256, ANKRD11 rs3114908, and BNC2 rs10756819).
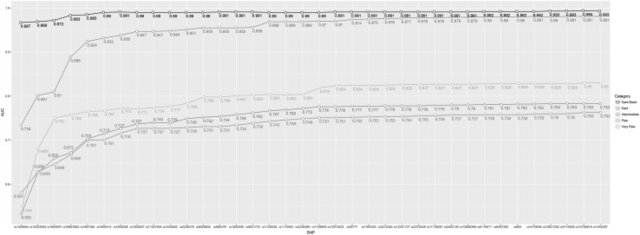
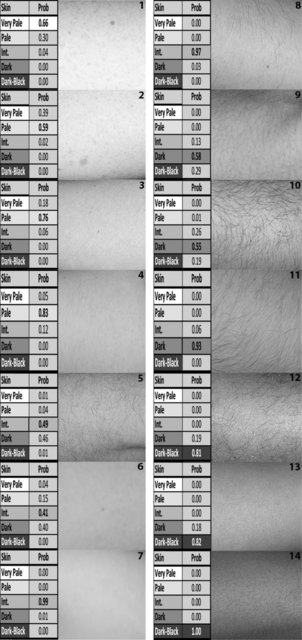
After quality control due to some missing genotypes for the full 36 SNP set, Multinomial Logistic Regression (MLR) modelling was performed for the prediction of categorical skin colour based upon a set of 1423 individuals. Details of the model for the prediction analysis follow studies on eye (Liu et al. 2009; Walsh et al. 2011b) and hair (Branicki et al. 2011; Walsh et al. 2013) colour prediction previously performed. In brief, categorical skin colour, based on five categories (and also three categories), is designated y, and is determined by genotype × (number of minor alleles per k) of k SNPs. For the 5-category designation, π1, π2, π3, π4, and π5 denote the probability of Very Pale, Pale, Intermediate, Dark, and Dark-Black, respectively. To investigate the performance of the 36 skin colour-associated SNPs in a prediction model overall, cross validations were conducted in 1000 randomized replicates; in each replicate, 80% individuals were used as the new training set (n = 1138) and the remaining samples were used as the testing set (n = 285). AUC values were derived from the testing set, and the average AUC values and the standard deviation were reported. AUC values of 0.5 designate a random prediction, whereas values closer to 1 indicate perfect prediction accuracy. Prediction results were produced for five categories as previously named and for three categories; Light (collapsing Very Pale, Pale, and Intermediate), Dark and Dark-Black to illustrate a 3-category grouping. For this study, skin colour prediction probabilities were generated for the test set with the highest probability leading to the most probable prediction for skin colour for each individual.
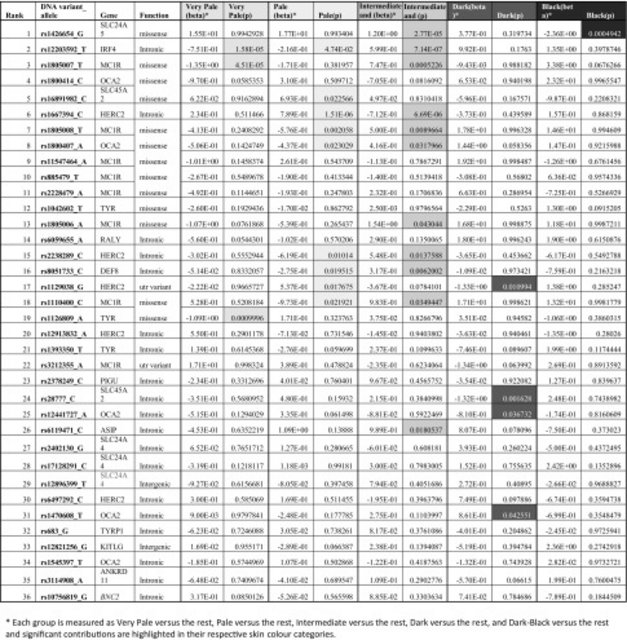
Table 1
DNA variant information for 77 SNPs previously associated with human pigmentation variation including their location, citations, as well as skin colour association and prediction ranking details obtained from the present study
For comparing our findings with those of Maroñas et al. (2014), an independent set of individuals (n = 194) described as the ‘model comparison set’ were genotyped for the 36 skin colour SNP predictors identified in this study as well as the 10 skin colour SNP predictors proposed by Maroñas et al. (2014) study, allowing a direct comparison of the prediction performance of these two models and their own sets of DNA predictors. For this, the 10 SNPs proposed by Maroñas et al. (2014); KITLG rs10777129, SLC45A2 rs13289 and rs16891982, TYRP1 rs1408799, SLC24A5 rs1426654, OCA2 rs1448484, SLC24A4 rs2402130, TPCN2 rs3829241, ASIP rs6058017, and rs6119471 were genotyped in these 194 samples using SNaPshot (Life Technologies) multiplexing. The Naïve Bayes skin classifier (http://mathgene.usc.es/snipper/skinclassifier.html) was used to predict each individual using the websites requested genotype input. An assessment of the models performance for categorical skin colour prediction was made on the full set of 194 individuals using a confusion matrix of prediction versus observed phenotype, which yielded AUC, Sensitivity, Specificity, Positive Predictive Value (PPV), and Negative Predictive Value of the model. To directly compare to the performance of the 36 markers proposed by this group, the same individuals were assessed using this study’s proposed 3-category model using the same phenotype scale as recommended by Maroñas et al. (2014). Therefore, the only differing factor was the performance of the Maroñas et al. (2014) skin colour classifier and the 36-marker model proposed in this study for the prediction of categorical skin colour.
All statistical analyses were performed with the R statistics software (R Core Team 2013), using packages MASS (Venables 2002), mlogit (Croissant 2013), ROCR (Sing et al. 2005), pROC (Robin et al. 2011), and caret (Kuhn et al. 2016).
Samples and skin colour phenotyping
We used 1159 individuals from Southern Poland, 347 individuals from Ireland, 119 from Greece, and 329 individuals living in the USA (parental place of birth for many of these individuals is outside the US; these include Nigeria, Mexico, Argentina, Columbia, India, Bangladesh, Cuba, Palestine, Canada, China, Honduras, Germany, Philippines, Russia, Sudan, Japan, Saudi Arabia, Pakistan, El Salvador, Spain, Haiti, South Korea, Vietnam—see online resource information 1). Informed consent was obtained from all individual participants included in the study and was approved by ethical committees of the cooperating institutions. Also included in this study were 71 individuals from the HGDP-CEPH (Rosenberg 2006) set, i.e., from Senegal (n = 21), Nigeria (n = 21), Kenya (n = 11), and Papua New Guinea (n = 17). In total, 2025 individuals were genotyped.
In terms of phenotyping, skin colour classifications followed the Fitzpatrick scale (Fitzpatrick 1988). The scale represents a dermatological assessment to estimate the response of different types of skin to UV light; therefore, it takes into account visual perception of skin colour, as well as tanning ability (Fitzpatrick 1988). It is commonly used by medical practitioners for the classification of a persons skin type, ranging from skin type 1 (pale white skin—no tanning ability), 2 (white skin—minimal tanning ability), 3 (light brown skin—tanning ability), 4 (moderate brown skin—tanning ability), and 5 (dark brown skin—tanning ability) to skin type 6 (deeply pigmented dark brown to black skin)—see online resource information 2. The Polish samples were assessed for their Fitzpatrick skin type by an experienced dermatologist (AB) at sample collection. The Irish, Greek, and US individuals were also assessed by the same dermatologist upon consultation of photographic imagery, and a detailed questionnaire on their ability to tan. Images were taken approximately 20 cm from the forearm of the individual using a Nikon D5300 and R1 ring flash with the following settings: Focus 22, Aperture 1/125, ISO 200. Therefore, all individuals collected were assigned an objective Fitzpatrick scale designation by the same qualified dermatologist avoiding the subjective designations that the volunteers themselves would provide in questionnaire data. For the HGDP-CEPH samples, for which no individual skin colour phenotype information was available, Fitzpatrick scales 6 was assigned as assumed from population knowledge of these African and New Guinean groups, as people living in these geographic regions only have very dark-black skin colour. The 6 Fitzpatrick scales were then re-classified into 5 final skin colour prediction categories for further analyses, i.e., Very Pale (6% of all samples used), Pale (44%), Intermediate (42%), Dark (3%), and Black (5%) by condensing the Fitzpatrick categories 3 and 4 into the Intermediate prediction category and leaving all other categories the same. Categories 3 and 4 of the Fitzpatrick scale are considered very close dermatologically; therefore, it was deemed acceptable to combine these categories for the prediction training of this skin colour model. In a 3-category scale, we grouped Fitzpatrick scale 1–4 Into Light (92%), scale 5 Into Dark (3%), and scale 6 into Dark-Black (5%). Henceforth, the term skin colour category with reference to the categories predicted shall be used for reasons of simplicity in the text; however, it does include not only the visual perception of skin colour but also the ability or lack of to tan. Further information on the Fitzpatrick scale can be found in online resource information 2.
For directly comparing our findings with those from Maroñas et al. (2014), individuals from an independent sample set (n = 194, 17 different populations from Europe, Middle-East, Africa, and Asia) not used in the previous marker ascertainment, model building, or testing, were predicted for skin colour using both models, the one established here, and the one proposed by Maroñas et al. (2014). For this, the same skin colour phenotyping approach as described by Maroñas et al. (2014) was used to make the study outcomes directly comparable. L*ab groups were designated a simple 3-category definition of White, Intermediate, and Black based on groups of L*ab values. The spectrometer values were: L*ab = 74.14–60.36 for White, comprising 132 samples; 59.32–40.04 for Intermediate, comprising 43 samples; 39.75–29.99 for Black, comprising 20 samples.
SNP assessment, genotyping, & statistical analyses
This study examined 2025 individuals for 77 single-nucleotide polymorphisms (SNPs) from 37 genetic loci that were associated with human pigmentation variation, skin colour in particular, in the previous studies (see Table 1 for more details). SNPs were genotyped using SNaPshot (Life Technologies) multiplexes designed and optimized very similar to those described elsewhere (Walsh et al. 2011b, 2013). A subset of 53 SNPs (see Table 1) from 24 genes were selected for further assessment based on their independent contribution (R 2 p value <0.05 uncorrected) towards categorical skin colour prediction, while factoring in sex and population. Finally, the Akaike Information Criterion (AIC) was used for determining optimal SNP selection from the 53 SNPs, which resulted in 36 SNPs from 16 genes (SLC24A5 rs1426654, IRF4 rs12203592, MC1R rs1805007, rs1805008, rs11547464, rs885479, rs228479, rs1805006, rs1110400, rs1126809, rs3212355, OCA2 rs1800414, rs1800407, rs12441727, rs1470608, rs1545397 SLC45A2 rs16891982, rs28777, HERC2 rs1667394, rs2238289, rs1129038, rs12913832, rs6497292, TYR rs1042602, rs1393350, RALY rs6059655, DEF8 rs8051733, PIGU rs2378249, ASIP rs6119471, SLC24A4 rs2402130, rs17128291, rs12896399, TYRP1 rs683, KITLG rs12821256, ANKRD11 rs3114908, and BNC2 rs10756819).
After quality control due to some missing genotypes for the full 36 SNP set, Multinomial Logistic Regression (MLR) modelling was performed for the prediction of categorical skin colour based upon a set of 1423 individuals. Details of the model for the prediction analysis follow studies on eye (Liu et al. 2009; Walsh et al. 2011b) and hair (Branicki et al. 2011; Walsh et al. 2013) colour prediction previously performed. In brief, categorical skin colour, based on five categories (and also three categories), is designated y, and is determined by genotype × (number of minor alleles per k) of k SNPs. For the 5-category designation, π1, π2, π3, π4, and π5 denote the probability of Very Pale, Pale, Intermediate, Dark, and Dark-Black, respectively. To investigate the performance of the 36 skin colour-associated SNPs in a prediction model overall, cross validations were conducted in 1000 randomized replicates; in each replicate, 80% individuals were used as the new training set (n = 1138) and the remaining samples were used as the testing set (n = 285). AUC values were derived from the testing set, and the average AUC values and the standard deviation were reported. AUC values of 0.5 designate a random prediction, whereas values closer to 1 indicate perfect prediction accuracy. Prediction results were produced for five categories as previously named and for three categories; Light (collapsing Very Pale, Pale, and Intermediate), Dark and Dark-Black to illustrate a 3-category grouping. For this study, skin colour prediction probabilities were generated for the test set with the highest probability leading to the most probable prediction for skin colour for each individual.
Table 1
DNA variant information for 77 SNPs previously associated with human pigmentation variation including their location, citations, as well as skin colour association and prediction ranking details obtained from the present study
	SNP	Chromosome	Gene	Alleles	BP (GRCh38)	Reference pigmentation association	Skin colour correlation [r 2 (p value)]*	Ranking in final model	Coefficients (fitted glm)	P value
1	rs6679651	1	HIST2H2BF	C/T	149,757,453		ns
2	rs12233134	2	EFR3B	C/T	25,106,146	Quillen et al. (2012)	ns
3	rs40132	5	SLC45A2	A/G	33,950,597	Nan et al. (2009)	ns
4	rs16891982	5	SLC45A2	C/G	33,951,587	Liu et al. (2009); Stokowski et al. (2007); Valenzuela et al. (2010); Branicki et al. (2011)	0.142 (8.13e-58)	5	0.27912209	1.72E-08
5	rs2287949	5	SLC45A2	C/T	33,954,405	Stokowski et al. (2007)	0.006 (0.004)
6	rs28777	5	SLC45A2	G/T	33,958,853	Branicki et al. (2011); Duffy et al. (2010); Han et al. (2008)	0.097 (3.14E-40)	24	8.65E-02	7.57E-02
7	rs26722	5	SLC45A2	A/G	33,963,764	Han et al. (2008); Liu et al. (2009); Stokowski et al. (2007)	ns
8	rs6867641	5	SLC45A2	C/T	33,985,751	Graf et al. (2007)	ns
9	rs13289	5	SLC45A2	C/G	33,986,303	Graf et al. (2007); Han et al. (2008); Maroñas et al. (2014)	0.0114 (5.8E-05)
10	rs1936208	6	Intergenic between ATP5F1P6 and LOC100129554	C/T	139,644,247		ns
11	rs12203592	6	IRF4	C/T	396,320	Branicki et al. (2011); Han et al. (2008); Liu et al. (2009); Praetorius et al. (2013)	0.0201 (5.18e-09)	2	−0.17565966	1.97E-12
12	rs4959270	6	LOC105374875	A/C	457,747	Branicki et al. (2011); Han et al. (2008); Sulem et al. (2007)	ns
13	rs477823	7	<NA>	G/T	63,287,722		0.0068 (0.001)
14	rs1385229	8	C8orf37-AS1	A/G	95,759,318		ns
15	rs10756819	9	BNC2	A/G	16,858,085	Liu et al. (2015); Visser et al. (2014)	0.021 (2.48E-09)	36	1.32E-03	9.46E-01
16	rs683	9	TYRP1	A/C	12,709,304	Branicki et al. (2011); Liu et al. (2009)	0.0096 (4.6E-05)	32	1.70E-02	3.83E-01
17	rs376397	10	GATA3	A/G	8,061,334		ns
18	rs10443915	10	PRKG1	A/T	52,060,818		ns
19	rs12765852	10	PRKG1	C/T	52,061,566		ns
20	rs10831496	11	GRM5	A/G	88,824,822	Nan et al. (2009)	ns
21	rs4936890	11	Intergenic between OR10G7 and OR10D5P	A/G	124,044,034		0.0113 (1.5E-05)
22	rs35264875	11	TPCN2	A/T	69,078,930	Jacobs et al. (2015); Sulem et al. (2008); Valenzuela et al. (2010); Zhang et al. (2013)	0.0034 (0.016)
23	rs1042602	11	TYR	A/C	89,178,527	Branicki et al. (2011); Jonnalagadda et al. (2016); Sulem et al. (2007)	0.0025 (0.04)	12	−0.06223707	3.52E-03
24	rs1393350	11	TYR	A/G	89,277,877	Han et al. (2008); Liu et al. (2009); Nan et al. (2009); Sulem et al. (2007)	0.0109 (1.8E-05)	21	−5.60E-02	5.96E-02
25	rs1126809	11	TYR	A/G	89,284,793	Branicki et al. (2011); Duffy et al. (2010); Sulem et al. (2007)	0.015 (2.2E-06)	19	−0.08357710	2.28E-02
26	rs642742	12	KITLG	A/G	88,905,968	Jonnalagadda et al. (2016)	0.0533 (5.2E-21)
27	rs12821256	12	KITLG	C/T	88,934,557	Branicki et al. (2011); Guenther et al. (2014); Sulem et al. (2007)	0.0024 (0.046)	33	−1.52E-02	6.53E-01
28	rs3782974	13	DCT	A/T	94,440,641	Lao et al. (2007)	0.0095 (6.6E-05)
29	rs2050537	13	HS6ST3	C/T	96,608,646		ns
30	rs4983161	14	<NA>	A/T	19,726,716		0.007 (0.001)
31	rs12896399	14	LOC105370627 (upstream of SLC24A4)	G/T	92,307,318	Han et al. (2008); Liu et al. (2009); Sulem et al. (2007)	0.011 (1.8E-05)	29	-2.55E-02	2.08E-01
32	rs2402130	14	SLC24A4	A/G	92,334,858	Branicki et al. (2011); Sulem et al. (2007)	0.027 (6.8E-12)	27	3.98E-02	1.09E-01
33	rs17128291	14	SLC24A4	A/G	92,416,481	Liu et al. (2015)	0.0147 (7.28E-07)	28	−3.91E-02	1.30E-01
34	rs12914268	15	<NA>	A/G	22,150,292		ns
35	rs1129038	15	HERC2	A/G	28,111,712	Liu et al. (2010); Mengel-From et al. (2010)	0.092 (1.77E-37)	17	0.10536412	8.38E-03
36	rs12913832	15	HERC2	A/G	28,120,471	Branicki et al. (2011); Duffy et al. (2007); Kayser et al. (2008); Liu et al. (2009); Mengel-From et al. (2010); Sturm et al. (2008); Sulem et al. (2007); Visser et al. (2012)	0.091 (9.9E-37)	20	8.12E-02	3.45E-02
37	rs2238289	15	HERC2	C/T	28,208,068	Mengel-From et al. (2009), (2010)	0.033 (5.24E-14)	15	−0.11378297	8.00E-03
38	rs8182028	15	HERC2	C/T	28,222,788	Liu et al. (2009)	ns
39	rs3940272	15	HERC2	A/C	28,223,576	Eiberg et al. (2008)	ns
40	rs6497292	15	HERC2	A/G	28,251,048	Kayser et al. (2008); Liu et al. (2009)	0.075 (2.29E-30)	30	5.79E-02	2.27E-01
41	rs16950941	15	HERC2	A/G	28,257,597	Liu et al. (2009)	ns
42	rs1667394	15	HERC2	A/G	28,285,035	Duffy et al. (2007); Kayser et al. (2008); Liu et al. (2009); Mengel-From et al. (2010); Sturm et al. (2008); Sulem et al. (2007)	0.052 (1.15E-21)	6	0.16017374	4.70E-08
43	rs1473917	15	LOC101927079	C/T	22,067,210		ns
44	rs1545397	15	OCA2	A/T	27,942,625	Edwards et al. (2010)	0.0166 (2.27E-07)	34	−1.03E-02	7.51E-01
45	rs1800414	15	OCA2	A/G	27,951,890	Donnelly et al. (2012); Edwards et al. (2010)	0.047 (2.79E-19)	4	−0.53990294	6.12E-11
46	rs1800407	15	OCA2	A/G	27,985,171	Branicki et al. (2011); Donnelly et al. (2012); Duffy et al. (2010); Liu et al. (2009)	0.007 (4.4E-04)	8	−0.19827349	1.20E-06
47	rs1800401	15	OCA2	C/T	28,014,906	Branicki et al. (2008b); Duffy et al. (2007)	0.0054 (0.005)
48	rs12441727	15	OCA2	A/G	28,026,628	Liu et al. (2009)	0.0047 (0.005)	25	6.03E-02	8.23E-02
49	rs1448485	15	OCA2	A/C	28,037,594	Duffy et al. (2007); Kayser et al. (2008); Liu et al. (2009)	ns
50	rs16950821	15	OCA2	A/G	28,038,360	Branicki et al. (2011)	0.037 (3.6E-15)
51	rs1470608	15	OCA2	A/C	28,042,974	Branicki et al. (2011); Mengel-From et al. (2009)	0.063 (1.04E-25)	31	−3.79E-02	2.66E-01
52	rs7495174	15	OCA2	A/G	28,099,091	Branicki et al. (2009); Donnelly et al. (2012); Duffy et al. (2007); Edwards et al. (2010); Liu et al. (2009)	ns
53	rs1426654	15	SLC24A5	A/G	48,134,286	Lamason et al. (2005); Stokowski et al. (2007); Sturm and Larsson (2009); Valenzuela et al. (2010)	0.15 (1.19E-59)	1	0.52412661	1.92E-23
54	rs11076649	16	AFG3L1P	C/G	89,992,927		0.0058 (0.002)
55	rs3114908	16	ANKRD11	A/G	89,317,316	Law et al. (2015)	0.0201 (9.8E-09)	35	3.93E-03	8.56E-01
56	rs8049897	16	DEF8	A/G	89,957,793	Han et al. (2008); Jin et al. (2012)	0.022 (1.5E-09)
57	rs8051733	16	DEF8	A/G	89,957,797	Law et al. (2015)	0.029 (2.7E-12)	16	−0.06364481	8.16E-03
58	rs164741	16	DPEP1	C/T	89,625,889	Han et al. (2008); Nan et al. (2009)	0.015 (2.76E-07)
59	rs2239359	16	FANCA	C/T	89,783,071		ns
60	rs3212355	16	MC1R	C/T	89,917,969	Valenzuela et al. (2010)	0.0206 (2.89E-08)	22	2.00E-01	6.14E-02
61	rs312262906 (N29insA)	16	MC1R	INDEL -/insA	89,919,341	Branicki et al. (2011)	0.0085 (1.2E-04)
62	rs1805005	16	MC1R	G/T	89,919,435	Branicki et al. (2011); Duffy et al. (2010); Stokowski et al. (2007); Sturm et al. (2003)	ns
63	rs1805006	16	MC1R	A/C	89,919,509	Branicki et al. (2011); Duffy et al. (2010); Liu et al. (2015)	0.003 (2.2E-02)	13	−0.31065309	5.63E-03
64	rs2228479	16	MC1R	A/G	89,919,531	Branicki et al. (2011); Sturm et al. (2003)	0.019 (7.45E-09)	11	−0.10915180	1.70E-03
65	rs11547464	16	MC1R	A/G	89,919,682	Branicki et al. (2011); Duffy et al. (2010)	0.0071 (4.6E-04)	9	−2.96E-01	5.06E-04
66	rs1805007	16	MC1R	C/T	89,919,708	Branicki et al. (2011); Duffy et al. (2010); Sulem et al. (2007)	0.0268 (1.28E-11)	3	−0.28231475	5.92E-12
67	rs201326893 (Y152OCH)	16	MC1R	C/A	89,919,713	Branicki et al. (2011)	ns
68	rs1110400	16	MC1R	C/T	89,919,721	Branicki et al. (2011)	0.0037 (1.1E-02)	18	−0.20059956	1.02E-02
69	rs1805008	16	MC1R	C/T	89,919,735	Branicki et al. (2011); Sulem et al. (2007)	0.021 (9.2E-10)	7	−0.19994906	1.25E-07
70	rs885479	16	MC1R	A/G	89,919,746	Branicki et al. (2011); Sturm et al. (2003)	0.0326 (7.63E-14)	10	−0.16300889	5.42E-04
71	rs1805009	16	TUBB3	C/G	89,920,137	Branicki et al. (2011); Duffy et al. (2010)	ns
72	rs333113	17	SPNS2	C/G	4,497,060		0.013 (2.41E-06)
73	rs6119471	20	ASIP	C/G	34,197,405	Hart et al. (2013)	0.214 (4.76E-85)	26	9.27E-02	9.51E-02
74	rs2424984	20	ASIP	C/T	34,262,568	Valenzuela et al. (2010)	0.044 (2.06E-17)
75	rs1885120	20	MYH7B	C/G	34,989,185	Liu et al. (2015)	0.003 (0.039)
76	rs2378249	20	PIGU	A/G	34,630,285	Branicki et al. (2011)	0.008 (1.4E-04)	23	−4.76E-02	7.36E-02
77	rs6059655	20	RALY	A/G	34,077,941	Jacobs et al. (2015); Liu et al. (2015)	0.008 (4.2E-04)
For comparing our findings with those of Maroñas et al. (2014), an independent set of individuals (n = 194) described as the ‘model comparison set’ were genotyped for the 36 skin colour SNP predictors identified in this study as well as the 10 skin colour SNP predictors proposed by Maroñas et al. (2014) study, allowing a direct comparison of the prediction performance of these two models and their own sets of DNA predictors. For this, the 10 SNPs proposed by Maroñas et al. (2014); KITLG rs10777129, SLC45A2 rs13289 and rs16891982, TYRP1 rs1408799, SLC24A5 rs1426654, OCA2 rs1448484, SLC24A4 rs2402130, TPCN2 rs3829241, ASIP rs6058017, and rs6119471 were genotyped in these 194 samples using SNaPshot (Life Technologies) multiplexing. The Naïve Bayes skin classifier (http://mathgene.usc.es/snipper/skinclassifier.html) was used to predict each individual using the websites requested genotype input. An assessment of the models performance for categorical skin colour prediction was made on the full set of 194 individuals using a confusion matrix of prediction versus observed phenotype, which yielded AUC, Sensitivity, Specificity, Positive Predictive Value (PPV), and Negative Predictive Value of the model. To directly compare to the performance of the 36 markers proposed by this group, the same individuals were assessed using this study’s proposed 3-category model using the same phenotype scale as recommended by Maroñas et al. (2014). Therefore, the only differing factor was the performance of the Maroñas et al. (2014) skin colour classifier and the 36-marker model proposed in this study for the prediction of categorical skin colour.
All statistical analyses were performed with the R statistics software (R Core Team 2013), using packages MASS (Venables 2002), mlogit (Croissant 2013), ROCR (Sing et al. 2005), pROC (Robin et al. 2011), and caret (Kuhn et al. 2016).