|
|
Post by Admin on Sept 27, 2018 18:19:39 GMT
 A Different View of African Origins The lineage of Homo sapiens probably originated in Africa at least ∼500 thousand years ago (ka) [1], and the earliest observed morphological manifestations of this clade appeared by ∼300ka [2]. Early H. sapiens fossils do not demonstrate a simple linear progression towards contemporary human morphology. Instead, putative early H. sapiens remains exhibit remarkable morphological diversity and geographical spread. Together with recent archaeological and genetic lines of evidence, these data are consistent with the view that our species originated and diversified within strongly subdivided (i.e., structured) populations, probably living across Africa, that were connected by sporadic gene flow [1, 3, 4, 5, 6, 7, 8]. This concept of ‘African multiregionalism’ [1] may also include hybridization between H. sapiens and more divergent hominins (see Glossary) living in different regions [1, 9, 10, 11, 12]. Crucially, such population subdivisions may have been shaped and sustained by shifts in ecological boundaries [7, 13, 14], challenging the view that our species was endemic to a single region or habitat, and implying an often underacknowledged complexity to our African origins.  Figure 1 Evolutionary Changes of Braincase Shape from an Elongated to a Globular Shape. The latter evolves within the H. sapiens lineage via an expansion of the cerebellum and bulging of the parietal. (Left) Micro-computerized tomography scan of Jebel Irhoud 1 (∼300ka, North Africa). (Right) Qafzeh 9 (∼95ka, the Levant). The Morphological Diversity and Spread of the Homo sapiens Clade The constellation of morphological features characterizing H. sapiens is debated. This has strongly impacted on interpretations of recent human origins by variably including or excluding different fossils from interpretative analyses. For example, different morphological criteria and analytical methods have been used to support both a gradual, mosaic-like process of modernization of our species or, conversely, a punctuated speciation (e.g., [1]). Extant human crania are characterized by a combination of features that distinguish us from our fossil relatives and ancestors, such as a small and gracile face, a chin, and a globular braincase. However, these typical modern human features emerge in a mosaic-like fashion within the H. sapiens clade. The oldest currently recognized members of the H. sapiens clade, from Jebel Irhoud in North Africa, have a facial morphology very similar to extant H. sapiens, as well as endocranial volumes that fall within the contemporary range of variation [2]. However, their braincase shapes are elongated rather than globular, suggesting that distinctive features of brain shape, and possibly brain function, evolved within H. sapiens [2, 5] (Figure 1). Other early H. sapiens fossils from Florisbad in South Africa (∼260ka), Omo Kibish (∼195ka) and Herto (∼160ka), both in Ethiopia, are morphologically diverse [1, 16]. This diversity has led some researchers to propose that fossils such as Jebel Irhoud and Florisbad actually represent a more primitive species called ‘H. helmei’, using the binomen given to the Florisbad partial cranium in 1935 [17, 18]. In a similar vein, the fossil crania from Herto [19], which combine a relatively globular braincase with a robust occipital and large face, were described as the subspecies H. sapiens idaltu because they fall outside the variation of recent humans. However, we view H. sapiens as an evolving lineage with deep African roots, and therefore prefer to recognize such fossils as part of the diversity shown by early members of the H. sapiens clade. The full suite of cranial features characterizing contemporary humans does not appear until fairly recently, between about ∼100–40ka [20]. The character and chronology of early H. sapiens fossils, together with their geographic distribution across Africa, suggests that evolution may at times have progressed independently in different regions, in populations that were often semi-isolated for millennia by distance and/or ecological barriers, such as hyperarid regions or tropical forests. 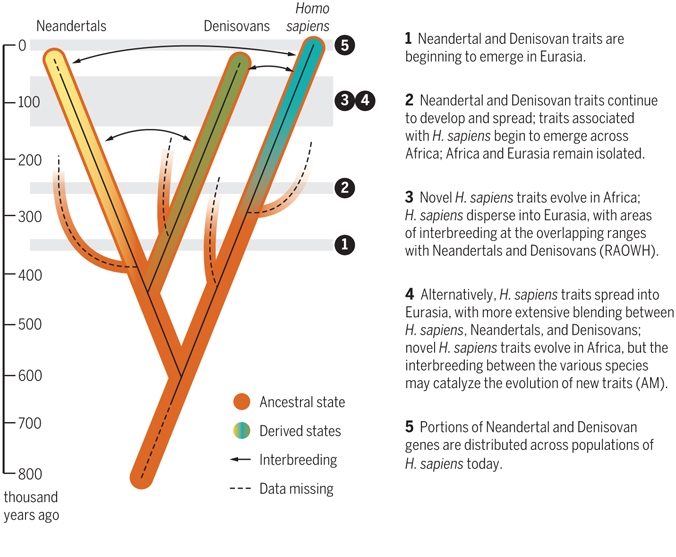 Further insights into the geographic extent and potential habitat diversity of early H. sapiens populations can be gained from more recent forager populations in Africa, which were also strongly structured. For example, Later Stone Age (LSA) human remains highlight both the retention of ‘archaic’ traits and the maintenance of considerable morphological diversity into the terminal Pleistocene [11, 21]. In the Holocene, the skeletal record becomes much richer, but there remains considerable spatial variation in morphology. Variation between populations in different regions and environments of Africa may have been shaped by isolation-by-distance and local environmental adaptations [22, 23, 24, 25, 26]. For example, challenging environments (e.g., deserts, rainforest) and isolation have likely played a significant role in shaping the population structure of Holocene African foragers and isolated hunter-gatherers across the tropics [25, 27]. Ultimately, the processes underlying the emergence of any ‘package’ of derived features diagnostic of early H. sapiens anatomy remain incompletely understood. However, the data do not seem to be consistent with the long-held view that human ancestry is derived predominantly from a single African region hosting a panmictic population. Instead, H. sapiens likely descended from a shifting structured population (i.e., a set of interlinked groups whose connectivity changed through time), each exhibiting different characteristics of anatomical ‘modernity’. The discovery that the primitive-looking H. naledi dates to between ∼335ka and 236ka [28], and that the Broken Hill 1 Homo heidelbergensis skull may date to ∼300–125ka [29], also shows that other hominin species in Africa coexisted with H. sapiens, raising the possibility of African archaic interbreeding. Future research should attempt to determine which features evolved before the appearance of our species and which primarily developed within the evolutionary history of our species. Another key area concerns understanding the extent to which different processes shaped observed changes. For example, the narrowing of the pelvis may reflect different processes including neutral genetic drift, adaptation to ecological variation, and life-history variation. |
|
|
|
Post by Admin on Sept 28, 2018 18:21:16 GMT
A Pan-African Cultural Patchwork Across Africa, the virtual abandonment of handheld large cutting tools such as handaxes, and an increased emphasis on prepared core technologies and hafting, marked a profound technological reconfiguration of hominin material culture. These technological changes, which define the transition to the Middle Stone Age (MSA), seem to have occurred across Africa at a broadly similar time; for example at ∼300ka both at Jebel Irhoud, where they are found with early H. sapiens fossils [16], and at Olorgesailie in East Africa [30], and at ∼280ka in southern Africa at Florisbad [31]. Currently, the earliest dates in West Africa are younger, at ∼180ka, but the region remains very poorly characterized [32]. The MSA is associated with H. sapiens fossils, but both H. naledi and H. heidelbergensis probably persisted into the late Middle Pleistocene. Clear regionally distinctive material culture styles, typically involving complex stone tools, first emerged within the MSA. For example, the Central African MSA includes heavy-duty axes, bifacial lanceolates, backed flakes and blades, picks and segments, probably from at least the late Middle Pleistocene [33]. In the Late Pleistocene, grassland and savannah expansion in North Africa led to dense human occupation associated with specific regional technological features such as tanged implements (Figure 2) [34]. At approximately the same time there was an emergence of comparably distinctive industries in parts of southern Africa. As in North Africa, some of these industries are also associated with other aspects of complex material culture such as ochre, bone tools, shell beads, and abstract engravings (Figure 2) [35].  Figure 2Middle Stone Age Cultural Artefacts. (A–D) Bifacial foliates from northern Africa (A, Mugharet el Aliya; B–D, Adrar Bous). (E–G) Bifacial foliates from southern Africa (Blombos Cave). (H,I) Tanged tools from northern Africa. (J) Segmented piece bearing mastic residue from southern Africa (Sibudu). (K) Engraved ochre fragment (Blombos Cave). (L–N) Engraved ostrich eggshell fragments from southern Africa (Diepkloof). (O,P) Bone points from southern Africa (Sibudu and Blombos Cave, respectively). (Q) Bone point from northern Africa (El Mnasra). (R–V) Perforated Trivia gibbosula shells from northern Africa (R,S, Grotte de Pigeons; T–V, Rhafas, Ifri n’Ammar, and Oued Djebbana, respectively). (W–Aa) Perforated Nassarius kraussianus shells from Blombos Cave. (Ab) Conus ebraeus shell bead (Conus 2) from southern Africa (Border Cave). (Ac) Ochre fragment shaped by grinding from southern Africa (Blombos Cave). All scales are 1cm. Boxed items indicate rescaled artefacts. Images reproduced, with permission, from (A–D, H, I) The Stone Age Institute; (E–G, J–P, Ac) from [35]; (Q) from [47]; and (R–Ab) from [35, 47, 48]. Such regionalization is typically linked with the emergence of ‘modern’ cognition. However, it arguably also reflects the interaction between demographic variables (e.g., increased population density) [36, 37, 38] and the learned traditions of long-lived regional subpopulations or demes (Figure 2). For example, northern and southern Africa, apart from being geographically distant, were also separated by environmental factors as a consequence of the expansion and contraction of forests in equatorial Africa, synchronous with amelioration in northern Africa. Other factors, such as habitat variability and adaptation to local environmental conditions, are also likely to play some role in material culture diversification. Although geographical differences are clear at the continental scale, localized spatial patterning is harder to discern. Similarities between regions may have been produced by occasional contact or by convergent adaptation to common environmental conditions. In East Africa, for example, although there is certainly some variation, there appears to be underlying continuity in material culture throughout much of the MSA (e.g., [39]). In many regions, ‘generic’ MSA assemblages that do not carry an obvious signal of regionalization are common [40]. In a cognitive model, these differences suggest that not all these early populations manifested a ‘modern mind’. However, such assemblages are augmented by shifting frequencies of tool types that appear to be spatially or temporally indicative, and likely reflect demographic factors. In some parts of Africa, the full suite of generalized MSA characteristics continues largely unchanged until the Pleistocene/Holocene boundary [41], matching the morphological patterns, and suggesting that the end of the MSA may have been as structured and mosaic-like as its beginnings. This view has support from LSA material culture. Despite superficial similarities in LSA lithic miniaturization, the cultural record shows continued differentiation and derivation into the Holocene, supporting the biological evidence for variable population dynamics that did not result in wide-scale homogenization [42].  Simple IBD Model with Cultural Data. Note that similarity can increase with distance under some circumstances, for example when similar habitats are separated by considerable distances, with areas of different habitat types being located between them. The reasons for, and therefore implications of, the geographic and temporal structuring of MSA cultural diversity are still poorly characterized and likely reflect several processes. These include adaptations to different environments [43]. Long-term, large-scale population separation may also have been the norm for much of Pleistocene Africa (Box 1; i.e., isolation by distance and isolation by habitat, representing null models to be rejected). Rare and spatially explicit models exploring Pleistocene technological innovations have also linked cultural complexity with variation in regional patterns of population growth, mobility, and connectedness (e.g., [36, 44, 45]), supported by evidence of long-distance transfer of stone raw material (e.g., [46]). Major new archaeological research directions should include: (i) unraveling the relative contributions of different African regions/habitats to recent human evolution; (ii) understanding shifting patterns of population structure through the differential appearance, expansion, contraction, and disappearance of regionally distinct artefact forms (Box 1); and (iii) exploiting the growing interface between archaeology, ecology, morphology, and genetics to explore the extent to which material culture patterning is coupled or decoupled from these associated (but potentially independent) axes. |
|
|
|
Post by Admin on Sept 29, 2018 18:32:49 GMT
Why Genetic Models Must Incorporate a More Complex View of Ancient Migration and Divergence in Africa The starting point for most genetic studies of human origins has been to investigate the depth of present-day diversity between and within African populations. Most studies have used simple ‘tree-like’ demographic models to infer population split times, neglecting or simplifying population structure, even if sometimes considering a degree of gene flow between branches (Box 2). Such studies have produced a variety of split-time estimates, with the KhoeSan populations of southern Africa, who retain the greatest levels of genetic diversity among human populations today, comprising one branch of the deepest divergence inferred, at 150–300ka [52, 53, 54, 55, 56, 57, 58]. Some authors have interpreted this, in conjunction with a gradient of south to north decreasing genetic diversity within Africa, as favoring a single-origin model for modern humans with a locus in southern Africa rather than in eastern Africa [59, 60]. Variation in inferred split times reflects a variety of different methodologies, model assumptions, and data sources, with a general trend for more recent analyses to infer older dates. In addition to ancient gene flow and structure, more recent population movements within Africa, such as the expansion of Bantu-speaking peoples from West Africa at 2–1.5ka [52, 61], will have obscured signatures of older demographic processes, as will have episodes of ‘back-to-Africa’ migration from Europe and southwest Asia into several regions of the continent [60, 62, 63, 64, 65].  Models incorporating more complex population structure can be considerably more parameter-rich and therefore more difficult to test computationally, particularly with limited data. However, they do offer a more generalized and flexible view of past demography – one that can accommodate, but not be limited to, more traditional population tree models. Furthermore, the increased availability of genomic data and developments in analytical methodologies now permit inference under more complex and realistic models. These developments have shown that structure cannot be neglected, and can cause patterns in genetic data that are similar to those generated by other forms of demographic change (e.g., [66, 67]). For example, inferred changes in effective population size (Ne) may result from changes in connectivity between ancient populations rather than from, or in addition to, changes in census population size [7, 68]. Indeed, the relationship between inferred Ne and census population size is not straightforward, and may even be counterintuitive when structure exists [7, 66, 68]. The geographical scale at which population genetic structure may have existed is also difficult to infer. For example, one recent genomic study showed substantial structure between pre-agricultural human populations separated by only tens or hundreds of kilometers [69]. These insights challenge the view that the early prehistory of our species can be well approximated by population growth within a single lineage [70].  Figure 3Inferring Population Size Change in Unstructured and Structured Populations Although modern genomic data have been shaped by, and thus contain large amounts of information on, past demography, these data can be explained by many different models of population history (equifinality). Moreover, all such models are necessarily abstractions and simplifications of the true population histories, and the discrepancies involved may be particularly problematic for certain questions about the past (mis-specification). This means that structure can be difficult to unambiguously detect, and even harder to reconstruct. For example, several studies on African populations have identified genes with coalescence times on the order of 1 million years, which could be interpreted as indicating admixture with archaic hominins [9, 10, 73]. However, even in a single population some very old coalescence times (>1My) are expected for humans (Figure 3), and therefore inferences based on the tail of the distribution of coalescence times, which are particularly sensitive to model mis-specification, need to be interpreted with caution. Indeed, several authors have argued that deep coalescence times are compatible with a single human lineage in Africa with deep population structure [7, 68, 74]. Ancient DNA (aDNA) data can provide additional resolution, and studies on Holocene individuals recently revealed extensive structure and migratory activity during that period [8, 75]. Ancient Pleistocene-aged aDNA would be more informative, but is difficult to obtain because tropical environments are mostly unfavorable for DNA preservation. However, a recent study showed that Late Pleistocene aDNA can be retrieved in some African regions [65]. These studies demonstrate that inferences from patterns of human genomic diversity need to consider fluctuating population structure over long periods, in addition to the range of panmictic African population origin models. |
|
|
|
Post by Admin on Sept 30, 2018 18:24:09 GMT
Environmental and Ecological Drivers of Population Structure The genetic, fossil, and archaeological data discussed above indicate that H. sapiens evolved in highly structured populations, probably across many regions of Africa. Elucidating the degree of and mechanisms underlying population structure will require consideration of Middle and Late Pleistocene environmental variability in both space and time (e.g., [13]) (Figure 4). Refugia have been highlighted as key catalysts of evolutionary change [76], and certainly would have generated population structure. Nevertheless, some regions acting as ‘backwaters’ and isolated habitat islands may also have been central in the persistence of relict populations. Research has emphasized broad asynchronous environmental changes in different African regions (e.g., [13, 77]). The northern and southern tips of the continent are most strongly affected by winter westerly precipitation, variation in which is largely driven by changes in Atlantic Ocean circulation. However, most of Africa experiences monsoonal rainfall associated with the intertropical convergence zone (ITCZ), the strength and location of which varies according to changes in insolation that are driven primarily by precessional aspects of Milankovitch forcing. Consequently, parts of tropical Africa that are currently humid likely experienced numerous episodes of extreme aridity in the past [78, 79]. At the same time that the monsoon migrated northwards, the Sahara contracted, and networks of lakes and rivers expanded across much of north Africa [80, 81, 82], with matching conditions in parts of southwest Asia. Finer-scale shifts in the monsoon are also evident. For example, in West Africa the extent of savannah and forested areas is strongly affected by small changes in patterns of rainfall [83, 84].  Figure 4 Middle and Late Pleistocene African Environmental Variability in Space and Time. (Left) Map of Africa with key archaeological and fossil sites discussed in the text. Colored boxes indicate averaged regions for simulated precipitation changes from the transient glacial/interglacial LOVECLIM climate model experiment [81]. (Right) Precipitation changes (%) relative to the long-term 784thousand year mean in the key regions highlighted in left panel, as simulated by transient 784thousand year-long LOVECLIM climate model simulation [81]. From top to bottom the regions are eastern equatorial Africa, southern Africa, northwestern Africa, and the central Sahara region. Climate therefore varied greatly, and periods of relatively increased aridity or humidity were asynchronous across Africa. Crucially, these factors are major drivers of faunal population structure and speciation [85, 86], illustrated by numerous sub-Saharan animals exhibiting similar phylogenetic patterns in their distribution. For example, Bertola and colleagues [87] show that dozens of species exhibit distinct populations in the two major evolutionary realms of west/central Africa and east/southern Africa. Many also show a further subdivision between east Africa and southern Africa, signifying important refuges in these three regions. These species occupy a range of trophic levels, suggesting that climate affected whole ecological communities. Therefore, faunal speciation largely appears to have been catalyzed by climate-driven habitat fragmentation and interaction between different biomes over time. This provides insights into how human population structure could have been maintained over significant timescales and geographic areas of Africa. In Africa, the concept of ‘refugium networks’ has been specifically implicated in Pleistocene human population subdivisions and expansions [18], and as a result such regions are of major evolutionary interest. Although fragmentation of suitable habitat has been highlighted as a major driver of population structure over and above isolation-by-distance (Box 1), isolation-by-habitat can also play an important role in animal [84] and probably also human population structure [14, 88]. Major challenges remain in integrating fossil, archaeological, and genetic lines of evidence into paleoenvironmental and paleoecological contexts (but see [3] and [72] for diverse attempts to do so). Currently, the chronology of much of the paleoanthropological record remains too coarse to allow any firm conclusions to be drawn about the role of environmental changes. Promising new avenues of research include genomic analyses of fauna, including the identification of commensal species and reconstructions of human habitats through stable-isotope analyses.  Concluding Remarks: Moving Forwards Available morphological, archaeological, genetic, and paleoenvironmental data indicate that the subdivision of Middle and Late Pleistocene African human populations drove the mosaic-like emergence and evolution of derived H. sapiens morphology. Reproductively semi-isolated populations adapted to local ecologies alongside drift. Such population isolation was likely facilitated by small population sizes. Thus, as with other fauna, gene flow should not be assumed to have been constant through time, or to have occurred at the same rate within and between different regions. Across the large timescales of the Middle and Late Pleistocene, with their strong climatic fluctuations, the number of intermediate populations connecting different regions is also likely to have fluctuated considerably. Several major unanswered questions flow from this reorientation of recent human origins (see Outstanding Questions). Did key diagnostic morphological characteristics emerge in one region and become elaborated with subsequent dispersals? Or did the transition from ‘archaic’ to ‘modern’ – whether indicated by morphology or material culture – occur gradually, and in a mosaic-like fashion across the continent? If this was the case, did African archaic hybridization also play a role? How does the existing evidence for structure affect our understanding of the history of population size changes and dispersals? Similarly, we have no firm grasp on the concordance that might exist between morphological and cultural structuring. Regional cultural signatures are apparent, raising the possibility that spatially distinct forms of material culture reflect similar patterns of population isolation and aggregation. Filling in these knowledge gaps requires us to reconsider paleoanthropological species concepts which are challenged by the view of deep population structure with sporadic gene flow/admixture. Ultimately, reconstructing the demographic history of human populations in its full complexity is beyond the power of population genomics alone, necessitating an interdisciplinary approach. In the past this has been achieved by geneticists working with archaeologists and paleoanthropologists to define a narrow set of simplified hypotheses whose genetic outcomes can be compared to identify the models that best explain the data. While such an approach has met with considerable success, a more complete picture will require integrating different data types (genetic, fossil, material culture, paleoclimate and paleoecological data) using the same or analogous models of population structure, size change, and dispersal. This represents a major challenge for ancestral demographic inference over the coming years. Ecology & Evolution, VOLUME 33, ISSUE 8, P582-594, AUGUST 01, 2018 |
|
|
|
Post by Admin on Oct 1, 2018 18:22:57 GMT
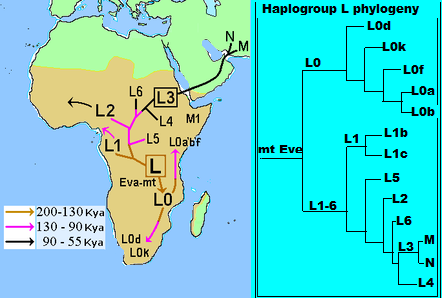 Genetic analysis of mitochondrial (mt) DNA has been an important tool in understanding human evolution due to characteristics of mtDNA, such as high copy number, lack of recombination, high substitution rate, and a maternal mode of inheritance (Ballard and Whitlock 2004). However, most studies of human evolution that have included mtDNA sequences have been confined to the d-loop, which occupies less than 7% of the mtDNA genome (e.g., Cann et al. 1987; Vigilant et al. 1991; Chen et al. 1995; Watson et al. 1996; Quintana-Murci et al. 1999; Wallace et al. 1999; Chen et al. 2000; Jorde et al. 2000; Salas et al. 2002; Kivisild et al. 2004; Salas et al. 2004). Inferences drawn from the d-loop alone can be problematic given that the d-loop mutates rapidly and is subject to saturation due to excessive homoplasy (Tamura and Nei 1993; Bandelt et al. 2006). Mutations are not randomly distributed across the length of the locus, making rate heterogeneity another important issue in calculating divergence date estimates (Excoffier and Yang 1999; Meyer et al. 1999; Bandelt et al. 2006). In addition, several equally likely gene trees can often be inferred from d-loop sequences, particularly when large numbers of samples are analyzed (Maddison et al. 1992; Ballard and Whitlock 2004). Comprehensive studies of the human mtDNA genome have been carried out by analyzing single nucleotide polymorphisms (SNPs) determined by restriction fragment length polymorphism (RFLP) analysis and sequences of the first hypervariable region of the d-loop (Chen et al. 1995, 2000; Salas et al. 2002, 2004). These studies have demonstrated that human mtDNA is geographically structured and may be classified into groups of related haplotypes (i.e, haplogroups) (Chen et al. 1995; Wallace et al. 1999). Only 2 mtDNA macrohaplogroups (M and N) and their derivatives persisted in non-Africans after the migration of modern humans out of Africa. Macrohaplogroup L is geographically limited to sub-Saharan Africa and has been divided into haplogroups L0–L6 (Mishmar et al. 2003; Salas et al. 2004; Kivisild, Metspalu, et al. 2006). The phylogeny of macrohaplogroup L is largely based on d-loop sequence and RFLP analysis and is, therefore, not well resolved (fig. 1A and B) particularly at basal tree nodes (Kivisild, Metspalu, et al. 2006). In particular, African mtDNAs that belong to L0 and L1 fall into several distinctive subhaplogroups, but their history is complex and poorly understood (Pereira et al. 2001; Kivisild, Metspalu, et al. 2006).  Evolutionary history of mtDNA haplogroup structure in African populations inferred from mtDNA d-loop and RFLP analysis. (A) Relationships among different mtDNA haplogroup lineages inferred from mtDNA d-loop sequences and mtDNA coding region SNPs from previous studies (Kivisild, Metspalu, et al. 2006). Dashed lines indicate previously unresolved relationships. (B) Relative frequencies of haplogroups L0, L1, L5, L2, L3, M, and N in different regions of Africa from mtDNA d-loop and mtDNA coding region SNPs from previous studies. (C) Relative frequencies of haplogroups L0, L1, and L5 subhaplogroups (excluding L2 and L3) in different regions of Africa from mtDNA d-loop and mtDNA coding region SNPs from previous studies. Haplogroup frequencies from previously published studies include East Africans (Ethiopia [Rosa et al. 2004], Kenya and Sudan [Watson et al. 1997; Rosa et al. 2004]), Mozambique (Pereira et al. 2001; Salas et al. 2002), Hadza (Vigilant et al. 1991), and Sukuma (Knight et al. 2003); South Africans (Botswana !Kung [Vigilant et al. 1991]); Central Africans (Mbenzele Pygmies [Destro-Bisol et al. 2004], Biaka Pygmies [Vigilant et al. 1991], and Mbuti Pygmies [Vigilant et al. 1991]); West Africans (Niger, Nigeria [Vigilant et al. 1991; Watson et al. 1997]; and Guinea [Rosa et al. 2004]). L1*, L2*, and L3* from previous studies indicate samples that were not further subdivided into subhaplogroups. Haplogroup L0 is divided into subhaplogroups L0a, L0d, L0f, and L0k (Salas et al. 2002; Mishmar et al. 2003; Salas et al. 2004; Kivisild, Metspalu, et al. 2006) (fig. 1). Based on their geographic distribution throughout Africa (fig. 1C), Salas et al. (2002, 2004) suggested the following scenario about the origin and diversification of subhaplogroups belonging to L0 and L1. L0a probably originated in eastern Africa and is common in eastern, central, and southeastern Africa, but is almost absent in northern, western, and southern Africa (Salas et al. 2002). L0d is found almost exclusively among southern African Khoisan (SAK) speakers (Salas et al. 2002). There is only a single L0d haplotype from a Turkana of Kenya (Watson et al. 1997), as well as a few L0d haplotypes from Mozambique, which may have arisen by recent gene flow with the SAK (Pereira et al. 2001). Similarly, L0k is found exclusively among the SAK (Salas et al. 2002). However, the phylogenetic relationship of L0d and L0k is uncertain (Watson et al. 1997; Kivisild, Metspalu, et al. 2006). L0f is rare and appears to be geographically confined to east Africa (Salas et al. 2002). Haplogroup L1 is composed of L1b and L1c (fig. 1C). L1b is concentrated in western Africa, but it also occurs in central and northern Africa (Watson et al. 1997; Rosa et al. 2004). L1c occurs frequently among central African Bantu speakers (Vigilant et al. 1991; Destro-Bisol et al. 2004) and probably originated among peoples near the Atlantic coast in western equatorial Africa (Salas et al. 2002, 2004). Both L1b and L1c are nearly absent in eastern and southern Africa. Haplogroup L5 (Kivisild et al. 2004) (previously referred to as L1e [Pereira et al. 2001]) has been observed at low frequency only in eastern Africa (Salas et al. 2002), Egypt (Stevanovitch et al. 2004), and among the Mbuti Pygmies (Kivisild, Shen, et al. 2006). A global sample of complete mtDNA genome sequences has become publicly available making it possible to more precisely make phylogenetic inferences and calculate divergence dates for these mtDNA haplogroups (Ingman et al. 2000; Torroni et al. 2001; Ingman and Gyllensten 2003; Mishmar et al. 2004; Ruiz-Pesini et al. 2004; Macaulay et al. 2005; Thangaraj et al. 2005; Kivisild, Metspalu, et al. 2006; Kivisild, Shen, et al. 2006). However, these previous analyses have included few samples representing many of the African mtDNA subhaplogroups (L0a, L0d, L0f, L0k, L1b, L1c, and L5), particularly from people residing in eastern Africa. East African populations may provide important clues toward understanding modern human origins. Both paleobiological and archeological data indicate that modern humans may have originated in eastern Africa (McBrearty and Brooks 2000; White et al. 2003), perhaps as early as 196,000 years ago (kya) (McDougall et al. 2005). In addition, the earliest migrations of modern humans out of Africa are thought to have originated from eastern Africa (Tishkoff et al. 1996; Quintana-Murci et al. 1999; Kivisild et al. 2004). Despite the paleobiological evidence that modern humans originated in eastern Africa, previous genetic studies have observed that L0k and L0d, which are found primarily among the SAK, occur at the root of the human mtDNA gene tree (Chen et al. 1995; Ingman et al. 2000; Mishmar et al. 2003; Ruiz-Pesini et al. 2004; Kivisild, Metspalu, et al. 2006). However, the presence of click-speaking populations in Tanzania (the Hadza and Sandawe) as well as Y chromosome data from the Hadza (Knight et al. 2003), Ethiopian, and Sudanese populations (Underhill et al. 2000, 2001; Cruciani et al. 2002; Semino et al. 2002) indicate that the SAK may have originated in eastern Africa, although the divergence between populations from these regions was quite ancient. Until now, no genetic data existed for the Sandawe. 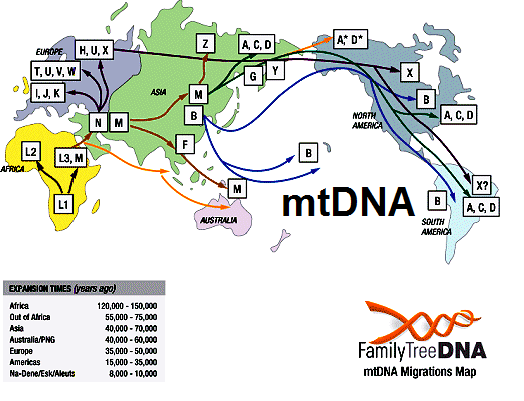 Time to Most Recent Common Ancestor We tested for nucleotide substitution rate heterogeneity for each gene tree using a likelihood ratio test (−2lnΛ) comparing constrained (molecular clock enforced) versus unconstrained (no clock) trees (Huelsenbeck and Crandall 1997). Because we found significant rate heterogeneity in the NJ and Bayesian trees, we estimated divergence times for the mtDNA haplogroup clades using a penalized likelihood (PL) model as implemented in the program r8s 1.07 (Sanderson 1997, 2002, 2003) using the optimal smoothing value (S = 320) obtained by a cross-validation procedure in R8s. We estimated confidence intervals (CIs) for each tree node using a 100 replicate bootstrap resampling procedure (Baldwin and Sanderson 1998) that was implemented by Perl scripts in the r8s-bootkit provided by Torsten Eriksson at www.bergianska.se/index_forskning_soft.html. We generated 100 bootstrap replicate data sets from the tree obtained from MrBayes v. 3.1 using SEQBOOT in PHYLIP (Felenstein 1993). In order to determine the 95% CI, we used a log likelihood decline of 2.0 units, which is roughly equivalent to 2 SDs (Sanderson and Doyle 2001). We conducted all analyses using a discrete approximation of a gamma distribution to accommodate for among-site rate heterogeneity. We calibrated our time to most recent common ancestor (TMRCA) estimates by assuming that the Pan and Homo lineages had separated from each other completely by 6 MYA (Kumar et al. 2005; Patterson et al. 2006) and added 500 ky for lineage sorting (Macaulay et al. 2005). Median-Joining Network Analysis Networks of L0/L1 mtDNA genome haplogroups were constructed using Network 4.1.1.1 (Fluxus Technology Ltd., 2004 [Bandelt et al. 1999]) in order to provide a detailed analysis of nucleotide substitutions along branches. We prepared sequences for analysis in MacClade 4.06 OS X. We excluded all invariant nucleotide positions in our L0/L1 alignment. We found 486 variable sites in the coding region, which spanned basepairs 593–16,077 of the Cambridge Reference Sequence (Andrews et al. 1999). These 486 variable sites were each assigned equal weight in the analyses (for contrasting method see Finnila et al. 2001). Additionally, we constructed a median-joining (MJ) network including P. troglodytes as an outgroup (GenBank accession number D38113). Although Network 4.1.1.1 is not intended for interspecies comparison, the chimpanzee was included to root the network and to unambiguously infer branching patterns at the base of the human mtDNA network for comparisons to our phylogenetic analyses. |
|

