|
|
Post by Admin on Mar 31, 2017 20:19:44 GMT
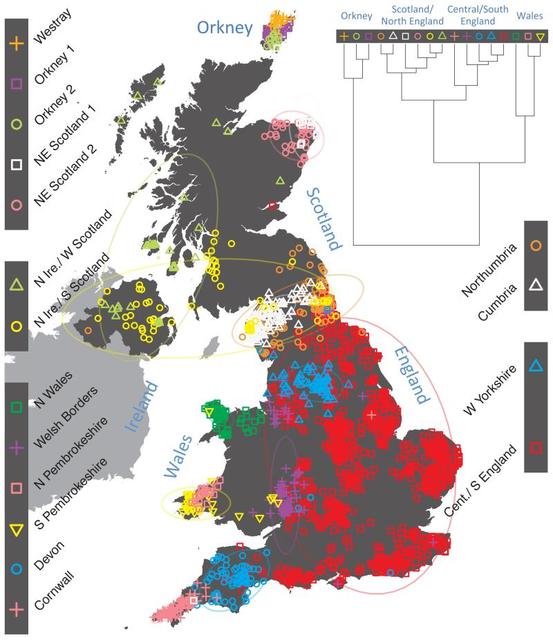 Figure 1 Clustering of the 2,039 UK individuals into 17 clusters based only on genetic data Fig. 1 shows this map for 17 clusters, together with the tree showing how these clusters are related at coarser levels of the hierarchy. (There is nothing special about this level of clustering, but it is convenient for describing some of the main features of our analysis. Extended Data Fig. 3 depicts maps showing other levels of the hierarchical clustering.) The correspondence between the genetic clusters and geography is striking: most of the genetic clusters are highly localised, with many occupying non-overlapping regions. Because the genetic clustering made no reference to the geographical location of the samples, the resulting correspondence between genetic clusters and geography reassures us that our approach is detecting real population differentiation at fine scales. Our approach can separate groups in close proximity, such as in Cornwall and Devon in southwest England, where the genetic clusters closely match the modern county boundaries, or in Orkney, off the north coast of Scotland. It is instructive to consider the tree that describes the hierarchical splitting of the 2,039 genotyped individuals into successively finer clusters (Fig. 1). The coarsest level of genetic differentiation (i.e. the assignment into two clusters) separates the samples in Orkney from all others. Next the Welsh samples separate from the other non-Orkney samples. Subsequent splits reveal more subtle differentiation (reflected in the shorter distances between branches), including separation of north and south Wales, then separation of the north of England, Scotland, and Northern Ireland from the rest of England, and separation of samples in Cornwall from the large English cluster. There is a single large cluster (red squares) that covers most of central and southern England and extends up the east coast. Strikingly, even at the finest level of differentiation returned by fineSTRUCTURE (53 clusters), this cluster remains largely intact, and contains almost half the individuals (1,006) in our study. 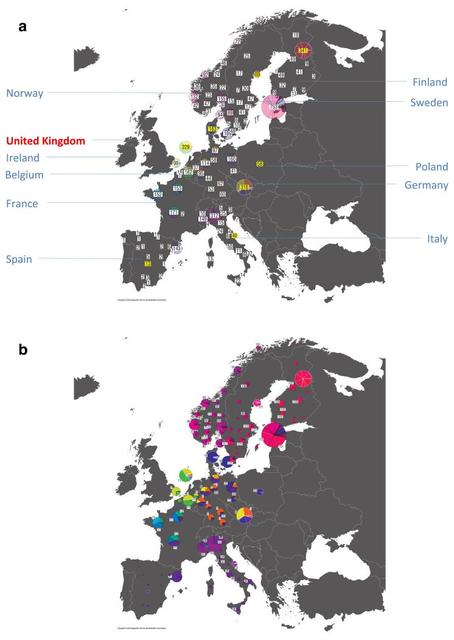 Extended Data Fig. 6a Genetic differences between UK clusters might in part reflect their relative isolation from each other, and in part differing patterns of migration and admixture from populations outside the UK. To gain further insight into this second aspect, we first applied similar fineSTRUCTURE analyses to 6,209 samples from continental Europe (henceforth “Europe”, see Extended Data Fig. 6a for the distribution of the samples by region), and then characterised the genetic composition of the UK clusters with respect to the genetic groups we found in Europe. A fuller analysis of the clustering within Europe, and its interpretation, will be described elsewhere. To avoid confusion below, we will refer to each of the 17 sets of individuals defined by our fineSTRUCTURE analyses in the UK as a “cluster”, and to each of the sets of individuals defined in our analyses of Europe as a “group”. We focus in these analyses on the division of the European samples into 51 such groups (Extended Data Fig. 6b). We italicise names of UK clusters, to distinguish them from the geographic region (e.g. the pink cross cluster Cornwall, and the county Cornwall). European groups are each given a unique identifying number (these are consecutive at the finest level of clustering, but not at the level we consider). In the text, groups are identified by this number and, for clarity, a three-letter label identifying the country (or countries) where the group is mainly represented (e.g. GER6 for the group labelled “6”, which is mostly found in Germany). 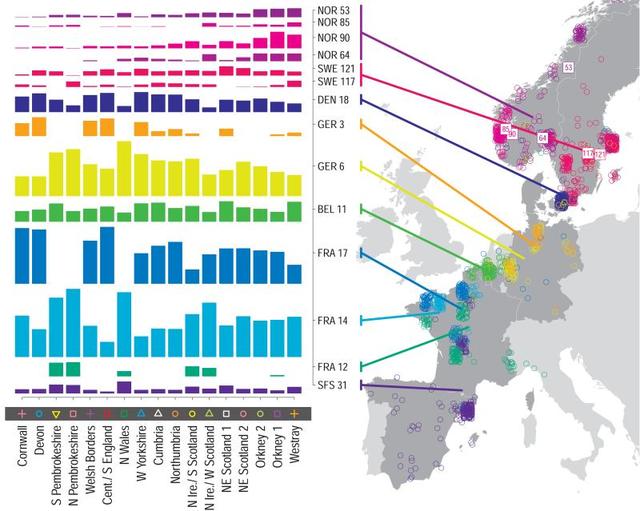 Figure 2 European ancestry profiles for the 17 UK clusters For each UK cluster we estimated an “ancestry profile” which characterises the ancestry of the cluster as a mixture of the ancestry of the 51 European groups. (see Methods for details, also Supplementary Table 4). As for the fineSTRUCTURE clustering, these analyses use no geographical information. The estimated “ancestry profiles” are illustrated in Fig. 2 which also depicts the sampling locations in Europe of the groups contributing to the ancestry profiles (see also Extended Data Fig 7a). Note that it is possible for distinct clusters within the UK to have very similar ancestry profiles: e.g. two UK regions could receive similar contributions from a set of European groups (thus similar ancestry profiles) but then evolve separately (leading to different patterns of shared ancestry within and between the regions, and thus to distinct clusters in fineSTRUCTURE). The bar charts in Fig. 2 show that some European groups feature substantially in the ancestry profiles of all UK clusters. These are: GER6 (yellow green) found predominantly in western Germany; BEL11 (green), in the northern, Flemish part of Belgium; FRA14 (light blue), in north-west France; DEN18 (dark blue), in Denmark; SFS31 (blue/purple) in southern France and Spain. In contrast, some European groups feature substantially in the ancestry profiles of some UK clusters but are absent from those of other UK clusters: GER3 (orange), in northern Germany; FRA12 (dark green), in France; and FRA17 (blue), also in France. Two Swedish groups (SWE117 and SWE121) feature in the ancestry profiles of the UK clusters, with Norwegian groups (shades of purple) featuring substantially in the ancestry profiles of the Orkney clusters, and to a lesser extent the clusters involving Scotland and Northern Ireland. |
|
|
|
Post by Admin on Apr 2, 2017 20:07:07 GMT
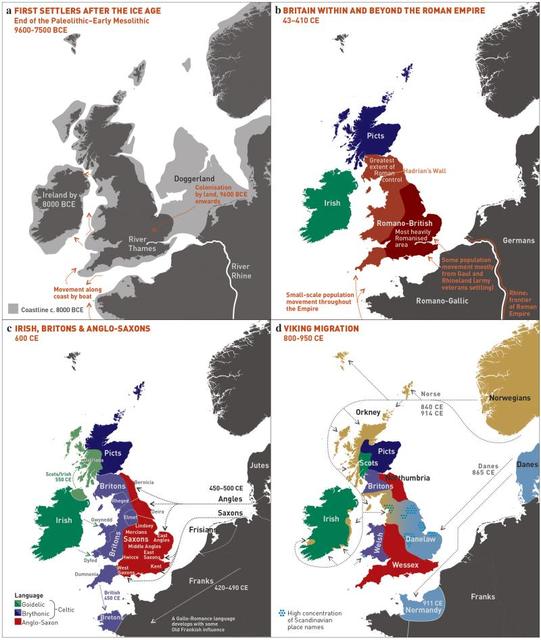 Figure 3 Major events in the peopling of the British Isles To facilitate further discussion, Figure 3 and Extended Data Figure 8 give an overview of the major population groups and movements of people within and into the UK at different times, based on archaeological, historical and linguistic evidence. For more detail see the Supplementary Note. Our observation that samples in Orkney differ genetically from those in the rest of the UK has been noted before18–21 and is consistent with the historical settlement, and long-term control, of Orkney by Norse Vikings (Orkney was a part of Norway from 875 to 1472). Further, the estimated ancestry profiles of the Orkney clusters show substantial contributions from groups in Norway (Fig. 2). This consistency with history and archaeology provides external validation of our approach.  The observation (Fig. 2, Supplementary Table 4) that particular European groups (e.g. GER3, FRA12, FRA17) contribute substantially to the ancestry profiles of some, but not all, UK clusters strongly suggests that at least some of the structure we observe in the UK results from differential input of DNA to different parts of the UK: the absence in particular UK clusters of ancestry from specific European groups is best explained by the DNA from those European groups never reaching those UK clusters. A critical observation which follows is that groups which contribute significantly to the ancestry profiles of all UK clusters most probably represent, at least in part, migration events into the UK that are relatively old, since their DNA had time to spread throughout the UK. Conversely, groups that contribute to the ancestry profiles of only some UK groups most probably represent more recent migration events, with the resulting DNA not yet spread throughout the UK by internal migration. “Old” and “recent” here are relative terms – we can infer the order of some events in this way but not their absolute times. Although we refer to “migration events” we cannot distinguish between movements of reasonable numbers of people over a short time or on-going movements of smaller numbers over longer periods. After the Saxon migrations, the language, place names, cereal crops, and pottery styles all changed from that of the existing (Romano-British) population to those of the Saxon migrants. There has been ongoing historical and archaeological controversy about the extent to which the Saxons replaced the existing Romano-British populations. Earlier genetic analyses, based on limited samples and specific loci, gave conflicting results. With genome-wide data we can resolve this debate. Two separate analyses (ancestry profiles and GLOBETROTTER) show clear evidence in modern England of the Saxon migration, but each limits the proportion of Saxon ancestry, clearly excluding the possibility of long-term Saxon replacement. We estimate the proportion of Saxon ancestry in C./S England as very likely to be under 50%, and most likely in the range 10%-40%. 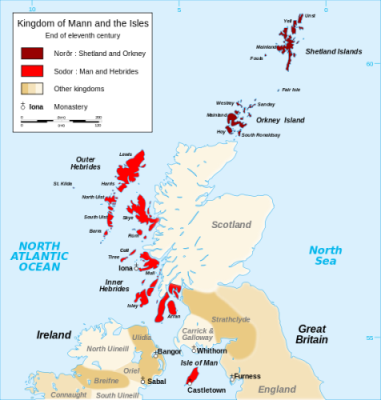 A more general conclusion of our analyses is that while many of the historical migration events leave signals in our data, they have had a smaller effect on the genetic composition of UK populations than has sometimes been argued. In particular, we see no clear genetic evidence of the Danish Viking occupation and control of a large part of England, either in separate UK clusters in that region (cf. Orkney), or in estimated ancestry profiles, suggesting a relatively limited input of DNA from the Danish Vikings and subsequent mixing with nearby regions, and clear evidence for only a minority Norse contribution (about 25%) to the current Orkney population. We saw no evidence of a general “Celtic” population in non-Saxon parts of the UK. Instead there were many distinct genetic clusters in these regions, some amongst the most different in our analyses. Further, the ancestry profile of Cornwall (perhaps expected to resemble other “Celtic” clusters) is quite different from that of the Welsh clusters, and much closer to that of Devon, and Cent./ S England. Nevertheless, the data suggest that the Welsh clusters represent populations that are more similar to the early post-ice-age settlers of Britain than those from elsewhere in the UK. Eur J Hum Genet. 2012 Feb; 20(2):203-10. |
|
|
|
Post by Admin on Jan 20, 2019 18:42:26 GMT
 Figure 1 Clustering of the 2,039 UK individuals into 17 clusters based only on genetic data For each individual, the coloured symbol representing the genetic cluster to which the individual is assigned is plotted at the centroid of their grandparents’ birthplace. Cluster names are in side-bars and ellipses give an informal sense of the range of each cluster (see Methods). No relationship between clusters is implied by the colours/symbols. The tree (top right) depicts the order of the hierarchical merging of clusters (see Methods for the interpretation of branch lengths). Fig. 1 shows this map for 17 clusters, together with the tree showing how these clusters are related at coarser levels of the hierarchy. (There is nothing special about this level of clustering, but it is convenient for describing some of the main features of our analysis. Extended Data Fig. 3 depicts maps showing other levels of the hierarchical clustering.) The correspondence between the genetic clusters and geography is striking: most of the genetic clusters are highly localised, with many occupying non-overlapping regions. Because the genetic clustering made no reference to the geographical location of the samples, the resulting correspondence between genetic clusters and geography reassures us that our approach is detecting real population differentiation at fine scales. Our approach can separate groups in close proximity, such as in Cornwall and Devon in southwest England, where the genetic clusters closely match the modern county boundaries, or in Orkney, off the north coast of Scotland. It is instructive to consider the tree that describes the hierarchical splitting of the 2,039 genotyped individuals into successively finer clusters (Fig. 1). The coarsest level of genetic differentiation (i.e. the assignment into two clusters) separates the samples in Orkney from all others. Next the Welsh samples separate from the other non-Orkney samples. Subsequent splits reveal more subtle differentiation (reflected in the shorter distances between branches), including separation of north and south Wales, then separation of the north of England, Scotland, and Northern Ireland from the rest of England, and separation of samples in Cornwall from the large English cluster. There is a single large cluster (red squares) that covers most of central and southern England and extends up the east coast. Strikingly, even at the finest level of differentiation returned by fineSTRUCTURE (53 clusters), this cluster remains largely intact, and contains almost half the individuals (1,006) in our study. 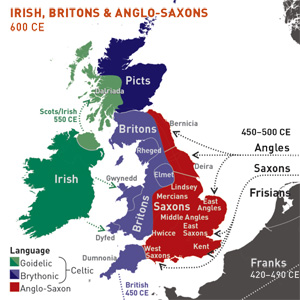 Although larger than between the sampling locations, estimated FST values between the clusters represented in Fig 1 are small (average 0.002, maximum 0.007, Supplementary Table 2), confirming that differentiation is subtle. On the other hand, all comparisons between pairs of clusters of their patterns of ancestry as estimated by fineSTRUCTURE show highly significant differences (Supplementary Table 3). We compared our approach to two widely used analysis tools, namely principal components17 and ADMIXTURE16 (Extended Data Figure 4). Both approaches broadly separate samples from Wales and from Orkney, but are not able to distinguish many of the other clusters found by fineSTRUCTURE. We also performed analyses to show that the clustering is not an artefact of our sampling scheme preferentially selecting related individuals (see Methods, Extended Data Fig. 5 and Supplementary Note).  Figure 2 European ancestry profiles for the 17 UK clusters For each UK cluster we estimated an “ancestry profile” which characterises the ancestry of the cluster as a mixture of the ancestry of the 51 European groups. (see Methods for details, also Supplementary Table 4). As for the fineSTRUCTURE clustering, these analyses use no geographical information. The estimated “ancestry profiles” are illustrated in Fig. 2 which also depicts the sampling locations in Europe of the groups contributing to the ancestry profiles (see also Extended Data Fig 7a). Note that it is possible for distinct clusters within the UK to have very similar ancestry profiles: e.g. two UK regions could receive similar contributions from a set of European groups (thus similar ancestry profiles) but then evolve separately (leading to different patterns of shared ancestry within and between the regions, and thus to distinct clusters in fineSTRUCTURE). The bar charts in Fig. 2 show that some European groups feature substantially in the ancestry profiles of all UK clusters. These are: GER6 (yellow green) found predominantly in western Germany; BEL11 (green), in the northern, Flemish part of Belgium; FRA14 (light blue), in north-west France; DEN18 (dark blue), in Denmark; SFS31 (blue/purple) in southern France and Spain. In contrast, some European groups feature substantially in the ancestry profiles of some UK clusters but are absent from those of other UK clusters: GER3 (orange), in northern Germany; FRA12 (dark green), in France; and FRA17 (blue), also in France. Two Swedish groups (SWE117 and SWE121) feature in the ancestry profiles of the UK clusters, with Norwegian groups (shades of purple) featuring substantially in the ancestry profiles of the Orkney clusters, and to a lesser extent the clusters involving Scotland and Northern Ireland. |
|
|
|
Post by Admin on Jan 20, 2019 22:00:52 GMT
To facilitate further discussion, Figure 3 and Extended Data Figure 8 give an overview of the major population groups and movements of people within and into the UK at different times, based on archaeological, historical and linguistic evidence. For more detail see the Supplementary Note.  Figure 3 Major events in the peopling of the British Isles See Supplementary Note for further details. a, The routes taken by the first settlers after the last ice age. b, Britain during the period of Roman rule. c, The regions of ancient British, Irish and Saxon control. d, The migrations of Norse and Danish Vikings. The main regions of Norse Viking (light brown) and Danish Viking (light blue) settlement are shown. Our observation that samples in Orkney differ genetically from those in the rest of the UK has been noted before18–21 and is consistent with the historical settlement, and long-term control, of Orkney by Norse Vikings (Orkney was a part of Norway from 875 to 1472). Further, the estimated ancestry profiles of the Orkney clusters show substantial contributions from groups in Norway (Fig. 2). This consistency with history and archaeology provides external validation of our approach. Our approach is clearly powered to detect quite subtle levels of population structure. Not finding such structure in central and southern England is thus informative. While some structure may exist within this region, there must have been sufficient movement of people, and hence of their DNA, since the last major invasions of the UK to make it relatively homogeneous genetically. This does not require large-scale population movements; it could be achieved by relatively local migration over many generations. This region of Britain lacks major geographical and (for the most part since the Roman occupation) geo-political barriers to human movement.  Other UK clusters may well reflect historical events. For example, several genetic clusters in Fig. 1 match the geo-political boundaries in Fig. 3c, and may represent remnants of communities/kingdoms present after the Saxon migrations, while the cluster spanning Northern Ireland and Southern Scotland may reflect the ‘Ulster Plantations’. The Supplementary Note contains further observations relating to the genetic clustering. Relative isolation has clearly been a major determinant of fine-scale population structure within the UK. To assess the role of a different possible cause, namely differential migration into different parts of the UK, we estimated European “ancestry profiles” for each of the UK genetic clusters (Fig. 2). Here we must use modern-day groupings, in Europe and the UK, as surrogates for the sources and results of major migration events. Population movements between these events and the present, involving either the source populations or recipient groups, will attenuate signals of the original migration. For this and other reasons, it is hard to provide definitive explanations for our observations. Nonetheless, genetic differences persist through many generations and where we can check our conclusions against historical evidence, there is good concordance. In what follows we focus on the most likely explanations for various observations. See Supplementary Note for a fuller discussion. For definiteness, we focus on the clustering in Fig. 1 and Extended Data Fig. 6b, although other levels are informative. Analysis of additional UK and European samples, particularly in regions where our data is sparse (e.g. central Wales and Scotland, Spain, the Netherlands) would improve our ability to infer historical events.  After the Saxon migrations, the language, place names, cereal crops, and pottery styles all changed from that of the existing (Romano-British) population to those of the Saxon migrants. There has been ongoing historical and archaeological controversy about the extent to which the Saxons replaced the existing Romano-British populations. Earlier genetic analyses, based on limited samples and specific loci, gave conflicting results. With genome-wide data we can resolve this debate. Two separate analyses (ancestry profiles and GLOBETROTTER) show clear evidence in modern England of the Saxon migration, but each limits the proportion of Saxon ancestry, clearly excluding the possibility of long-term Saxon replacement. We estimate the proportion of Saxon ancestry in C./S England as very likely to be under 50%, and most likely in the range 10%-40%. A more general conclusion of our analyses is that while many of the historical migration events leave signals in our data, they have had a smaller effect on the genetic composition of UK populations than has sometimes been argued. In particular, we see no clear genetic evidence of the Danish Viking occupation and control of a large part of England, either in separate UK clusters in that region (cf. Orkney), or in estimated ancestry profiles, suggesting a relatively limited input of DNA from the Danish Vikings and subsequent mixing with nearby regions, and clear evidence for only a minority Norse contribution (about 25%) to the current Orkney population. We saw no evidence of a general “Celtic” population in non-Saxon parts of the UK. Instead there were many distinct genetic clusters in these regions, some amongst the most different in our analyses. Further, the ancestry profile of Cornwall (perhaps expected to resemble other “Celtic” clusters) is quite different from that of the Welsh clusters, and much closer to that of Devon, and Cent./ S England. Nevertheless, the data suggest that the Welsh clusters represent populations that are more similar to the early post-ice-age settlers of Britain than those from elsewhere in the UK. In summary, we have presented the first fine-scale dissection of subtle levels of genetic differentiation within a country, by utilising careful sampling, genomic data, and powerful statistical methods. The resulting genetic clusters, and the characterisation of their ancestry in terms of European groups, provide important and novel insights into the peopling of the British Isles. Nature. 2015 Mar 19; 519(7543): 309–314. |
|
|
|
Post by Admin on Apr 15, 2019 21:09:07 GMT
Ancient farmers carrying Early Neolithic Aegean ancestry dispersed in two directions: west along the Mediterranean and northwest into central Europe, with both showing complex patterns of admixture with local Mesolithic hunter-gatherers. It took around one thousand years after appearing in proximate areas of continental Europe for Neolithic cultures to emerge in Britain (ca. 4000 BCE). This delay feeds into an idea of British Neolithic exceptionalism, as it provides ample time for Mesolithic hunter-gatherers to absorb Neolithic lifeways gradually through long-term interactions with their neighbours on continental Europe.  The main challenge in investigating the British Neolithic transition is the paucity of human remains dating to the Mesolithic. It seems that most people who lived in Britain at this time were subject to funerary rites which left no archaeological trace. As a human remains specialist, it is hard not to take this personally. Luckily, we were successful in generating genetic data from the remains of six Mesolithic individuals, as well as from 67 British Neolithic people, mainly originating from archetypal megalithic tombs and long barrows, as well as cave sites.  We found that the development of Neolithic cultures in Britain was accompanied by the arrival of people carrying Aegean-derived ancestry typical of Neolithic farmers from continental Europe, indicating that the Neolithic revolution in Britain was mainly driven by migrations of people across the Channel. Our latest Mesolithic sample, from a woman who died less than 500 years before the beginning of the Neolithic, has entirely local ancestry, suggesting there had been little to no interaction with continental Neolithic farmers over the previous one thousand years. Curiously, outside of western Scotland where at least two Early Neolithic samples show recent local ancestry, there is little or no detectable signature of admixture between newly-arrived farmers and local Mesolithic groups. This is strange given the patterns seen in continental Europe and western Scotland that show these populations were not averse to carnal liaisons. Population density in Late Mesolithic Britain may have been particularly low. 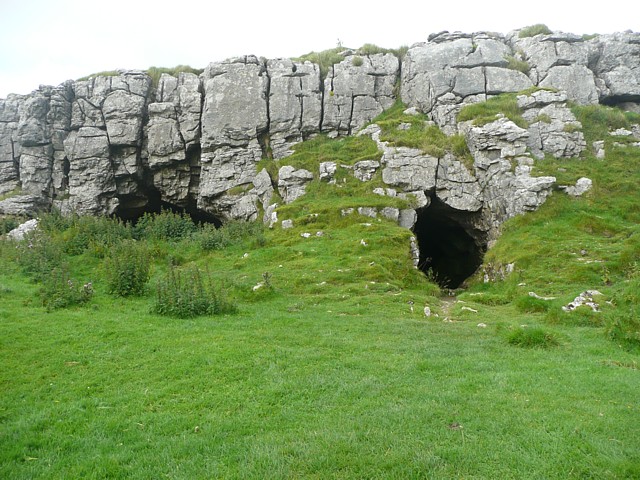 British Neolithic populations are largely descended from groups who dispersed along the Mediterranean Sea, with only low levels of ancestry from Neolithic inhabitants of central Europe. Regional variability in the ancestry of British Neolithic populations suggests at least two groups migrated to Britain from mainland Europe at about the same time. Why do these populations move into Britain simultaneously after such a long delay? A more detailed synthesis of the archaeological and archaeogenetic evidence is required to answer this question, but it may be notable that peculiarly maritime societies characterised by megalith-building arise in northern France just before Neolithic cultures first appear in Britain. Abstract The roles of migration, admixture and acculturation in the European transition to farming have been debated for over 100 years. Genome-wide ancient DNA studies indicate predominantly Aegean ancestry for continental Neolithic farmers, but also variable admixture with local Mesolithic hunter-gatherers. Neolithic cultures first appear in Britain circa 4000 bc, a millennium after they appeared in adjacent areas of continental Europe. The pattern and process of this delayed British Neolithic transition remain unclear. We assembled genome-wide data from 6 Mesolithic and 67 Neolithic individuals found in Britain, dating 8500–2500 bc. Our analyses reveal persistent genetic affinities between Mesolithic British and Western European hunter-gatherers. We find overwhelming support for agriculture being introduced to Britain by incoming continental farmers, with small, geographically structured levels of hunter-gatherer ancestry. Unlike other European Neolithic populations, we detect no resurgence of hunter-gatherer ancestry at any time during the Neolithic in Britain. Genetic affinities with Iberian Neolithic individuals indicate that British Neolithic people were mostly descended from Aegean farmers who followed the Mediterranean route of dispersal. We also infer considerable variation in pigmentation levels in Europe by circa 6000 bc. Nature Ecology & Evolution (2019) |
|

